Quantum-state selection, alignment, and orientation of large molecules using static electric and laser fields
Abstract
Supersonic beams of polar molecules are deflected using inhomogeneous electric fields. The quantum-state selectivity of the deflection is used to spatially separate molecules according to their quantum state. A detailed analysis of the deflection and the obtained quantum-state selection is presented. The rotational temperatures of the molecular beams are determined from the spatial beam profiles and are all approximately 1 K. Unprecedented degrees of laser-induced alignment and orientation of iodobenzene molecules are demonstrated when the state-selected samples are used. Such state-selected and oriented molecules provide unique possibilities for many novel experiments in chemistry and physics.
pacs:
37.20.+j, 33.15.-eI Introduction
For a large range of experiments in chemistry and physics, a high level of control over the external and internal degrees of freedom of molecules is very beneficial. This includes control over the translational and the rotational motions, as well as the selection of a single quantum state or a small set of states. Such quantum-state-selected targets provide unique possibilities, for example, for manipulating the external degrees of freedom with static electric fields Loesch and Remscheid (1990); Friedrich and Herschbach (1991) or optical fields Friedrich and Herschbach (1995a); Stapelfeldt and Seideman (2003), or both Friedrich and Herschbach (1999a, b). The quantum-state selection also naturally discriminates between individual stereo-isomers of large molecules Filsinger et al. (2008). The resulting samples of aligned or oriented individual isomers offer unique prospects for novel experiments with complex molecules, such as femtosecond pump-probe measurements, x-ray or electron diffraction in the gas-phase Spence and Doak (2004); Peterson et al. (2008), high-harmonic generation Levesque et al. (2007), or tomographic reconstructions of molecular orbitals Itatani et al. (2004). Moreover, it would provide considerably increased control in reaction dynamics experiments Stolte (1988).
Strong cooling can be achieved in supersonic expansions of molecules seeded in an inert atomic carrier gas. For small molecules (consisting of just a few atoms) only a few rotational states are populated at the typical temperatures on the order of 1 K. For larger polyatomic systems rotational cooling down to or even below 1 K still leaves the molecular ensemble distributed over a considerable number of rotational states, thereby often masking quantum-state-specific effects. State selection can be performed using inhomogeneous electric or magnetic fields. The possibility to deflect polar molecules in a molecular beam with an electric field was first described by Kallmann and Reiche in 1921 Kallmann and Reiche (1921) and experimentally demonstrated by Wrede in 1927 Wrede (1927). As early as 1926, Stern suggested that the technique could be used for the quantum-state separation of small diatomic molecules at low temperatures Stern (1926). In 1939 Rabi introduced the molecular beam resonance method, by using two deflection elements of oppositely directed gradients in succession, to study the quantum structure of atoms and molecules Rabi et al. (1939). Whereas deflection experiments allow the spatial dispersion of quantum states, they do not provide any focusing. For small molecules in low-field-seeking states this issue could be resolved using multipole focusers with static electric fields. These were developed independently in 1954/55 in Bonn Bennewitz and Paul (1954); Bennewitz et al. (1955) and in New York, where they were used to produce the population inversion for the first MASER experiments Gordon et al. (1954, 1955). About ten years later, molecular samples in a single rotational state were used for state specific inelastic scattering experiments by the Bonn group Bennewitz et al. (1964) and, shortly thereafter, for reactive scattering Brooks and Jones (1966); Beuhler et al. (1966). In the following decades, multipole focusers were extensively used to study steric effects in gas-phase reactive scattering experiments Parker and Bernstein (1989); Stolte (1988). Also for the investigation of steric effects in gas-surface scattering Kuipers et al. (1988) and photodissociation Rakitzis et al. (2004) experiments, the preparation of oriented samples of state-selected molecules using electrostatic focusers was essential. For about ten years, it is also possible to manipulate the speed of small molecules using switched inhomogeneous electric fields in the so-called Stark decelerator Bethlem et al. (1999). More recently, also its optical Fulton et al. (2004) and magnetic Vanhaecke et al. (2007) analogs have been demonstrated.
Obtaining similar control over large molecules is more difficult, because all low-lying quantum states are high-field seeking at the required electric field strengths. In order to confine these molecules, dynamic focusing schemes are necessary Auerbach et al. (1966); Bethlem et al. (2006); Tarbutt and Hinds (2008). Dynamic focusing of large molecules has been demonstrated in the alternating-gradient (AG) deceleration of benzonitrile Wohlfart et al. (2008a) and in the conformer selection of 3-aminophenol Filsinger et al. (2008). However, if focusing is not necessary, spatial dispersion of quantum states can still be achieved using static electric fields in a Stern-Gerlach-type deflector. This molecular beam deflection has been used extensively as a tool to determine dipole moments and polarizabilities of molecular systems ranging from diatomics Wrede (1927) over clusters Moro et al. (2003) to large biomolecules Broyer et al. (2007).
Recently, we have demonstrated the quantum-state selection of large molecules Holmegaard et al. (2009) following the original proposal of Stern Stern (1926). Here, the details of the electrostatic deflection are presented. It is shown, how the rotational temperature of cold supersonic jets can be determined with high precision from deflection measurements and that indeed a small subset of quantum states can be addressed in deflected samples of large molecules. In particular, the ground state has the largest Stark shift and molecules residing in this state are deflected the most. Our goal is to isolate and use rotational ground state molecules, or at least samples of molecules in the few lowest lying states, as targets for various experiments. Since the deflection does not change the initial state distribution but merely disperses it, it is crucial that the population of ground state molecules in the molecular beam is initially as large as possible. Therefore, the rotational temperature of the molecular beam is made as low as possible using a high-pressure supersonic expansion Hillenkamp et al. (2003). It is shown how the resulting state-selected molecules can be used to improve one-dimensional (1D) laser-induced alignment Stapelfeldt and Seideman (2003); Kumarappan et al. (2006) and mixed field orientation Buck and Fárník (2006); Minemoto et al. (2003); Holmegaard et al. (2009). Here, alignment refers to confinement of a molecule-fixed axis (typically, the largest polarizability axis) along a laboratory-fixed axis and orientation refers to the molecular dipole moments pointing in a particular direction. Alignment and orientation occur in the adiabatic limit where the laser field, used to align the molecules, is turned on and off slowly compared to the inherent rotational periods of the molecule Friedrich and Herschbach (1995b); Sakai et al. (1999). The state selection leads to strong enhancement in the degree of orientation and alignment of iodobenzene molecules compared to that achieved when no deflection is used.
II Experimental
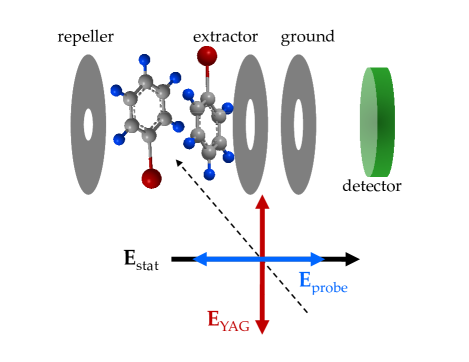
A schematic of the experimental setup is shown in Figure 1.
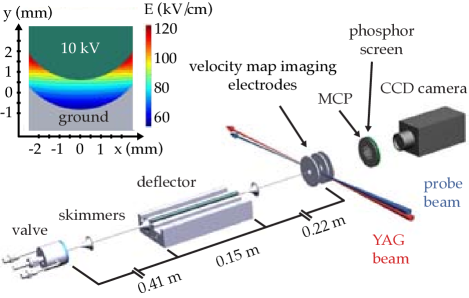
The molecular beam machine consists of three differentially pumped vacuum chambers; The source chamber housing a pulsed valve (pumped by a 2000 l/s turbomolecular pump), the deflector chamber (pumped by a 500 l/s turbomolecular pump) and the detection chamber housing the ion/electron spectrometer (pumped by a 500 l/s turbomolecular pump). About 3 mbar of iodobenzene (Sigma Aldrich, 98 % purity) or benzonitrile (Sigma Aldrich, 98 % purity) is seeded in an inert carrier gas and expanded through a pulsed valve into vacuum. In order to obtain optimal cooling of the molecular beam, a miniaturized, high pressure Even-Lavie valve Hillenkamp et al. (2003) is used operating at a backing pressure of 90 bar of He or 20 bar of Ne, limited by the onset of cluster formation. While rotational temperatures down to 0.4 K have been achieved under similar conditions Even et al. (2000), the typical rotational temperature in our experiments is K. Two 1-mm-diameter skimmers placed 15 cm (separating the source and the deflector chamber) and 38 cm downstream from the nozzle collimate the molecular beam before it enters a 15-cm-long electrostatic deflector. A cut through the electrodes of the deflector is shown in the inset of Figure 1 together with the electric field created. A trough with an inner radius of curvature of 3.2 mm at ground potential and a rod with a radius of 3.0 mm at high voltage create a two-wire field Ramsey (1956). The vertical gap across the molecular beam axis is 1.4 mm, while the smallest distance between the electrodes is 0.9 mm. The two-wire field geometry is ideally suited for molecular beam deflection. The gradient of the electric field along the vertical direction is large and nearly constant over a large area explored by the molecular beam, while the electric field is very homogeneous along the horizontal direction. Thus, a polar molecule experiences a nearly constant force in the vertical direction independent of its position within the deflector, while the force in the horizontal direction (i. e., broadening of the beam in the horizontal direction) is minimized. In our setup, the deflector is mounted such that molecules in high-field-seeking (low-field-seeking) quantum states are deflected upwards (downwards).
After passing through the deflector, the molecular beam enters the differentially pumped detection chamber via a third skimmer of 1.5 mm diameter. In the detection area, the molecular beam is crossed by one or two laser beams that are focused by a spherical lens with a focal length of mm. The lens is mounted on a vertical translation stage so that the height of the laser foci can be adjusted with high precision. In the first part of the experiment, where the beam deflection of iodobenzene and benzonitrile is characterized, only one laser, the probe laser, is used. This Ti:Sapphire laser (25 fs (FWHM) pulses, 800 nm, beam-waist µm) is used to determine the relative density in the molecular beam via photoionization. In the second part of the experiment, an additional laser pulse is included to study laser-induced alignment and orientation of iodobenzene. For these experiments, 10 ns (FWHM) long pulses from a Nd:YAG laser (1064 nm, µm) are overlapped in time and space with the probe laser pulses. While the YAG laser induces adiabatic alignment and orientation, here the fs-laser is used to determine the spatial orientation of the target molecules via Coulomb explosion. Ionic fragments produced in the Coulomb explosion are accelerated in a velocity focusing geometry towards the detector. The detector can be gated with a time resolution of ns, which allows for mass selective detection of individual fragments. A microchannel plate (MCP) detector backed by a phosphor screen is employed to detect the position of mass-selected ions. In particular, I+ fragment ions, formed in the Coulomb explosion of iodobenzene, are particularly useful experimental observables since they recoil along the C-I symmetry axis of the molecule. Thus, 2D ion images of I+ recorded with a CCD camera provide direct information about the instantaneous molecular orientation of the C-I bond axis with respect to the laboratory frame and are, therefore, the basic observables in these experiments. All experiments are conducted at 20 Hz, limited by the repetition rate of the YAG laser.
III Results and Discussion
In the first experiments shown in subsection III.1, a detailed analysis of electrostatic beam deflection is presented. It is shown, that electrostatic deflection of cold molecular beams can be used to determine the rotational temperature of a supersonic jet. Furthermore, the degree of quantum-state selectivity that can be achieved with our setup is investigated. As an application it is demonstrated, how this quantum-state selectivity of the deflection process can be exploited to obtain an unprecedented degree of laser-induced alignment (subsection III.2) and orientation (subsection III.3) of iodobenzene molecules.
III.1 Electrostatic Deflection of Cold Molecular Beams
In the first experiment, the deflection of benzonitrile molecules (BN, C7H5N) seeded in 90 bar of He is investigated. BN is an ideal candidate for electrostatic beam deflection due to its large permanent dipole moment of 4.515 D. From the precisely known molecular constants Wohlfart et al. (2008b) the energy of a given rotational quantum state can be calculated as a function of the electric field strength. The exact procedure is detailed in subsection A.1. Figure 2 shows the Stark energies for the lowest rotational states of BN.
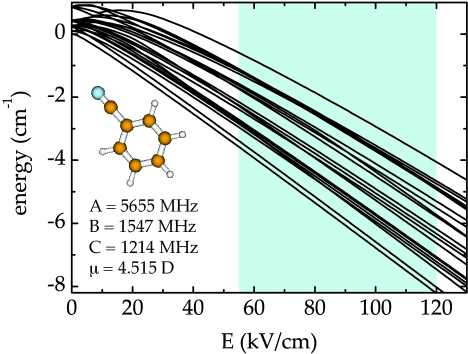
Due to the small rotational constants and the resulting high density of rotational states, a large number of states is populated even under the cold conditions in a supersonic expansion. At a rotational temperature of 1 K, the typical temperature in our experiments (vide infra), 66 rotational quantum states (with 419 -components) have a population larger than 1 % relative to the ground state. At the electric field strengths present in the deflector, indicated by the shaded area in Figure 2, all low-lying quantum states are high-field seeking. This is due to mixing of closely spaced states of the same symmetry and is typical for large asymmetric top molecules. The Stark shift and thus the force a molecule experiences in an inhomogeneous electric field depends on the rotational quantum state. Molecules in the ground state have the largest Stark shift and are, therefore, deflected the most. In general, the Stark shift decreases with increasing quantum number. Thus, the lower the rotational temperature of the molecular beam is, the more the beam is deflected.
Figure 3 shows vertical intensity profiles of BN for various high voltages applied to the deflector.
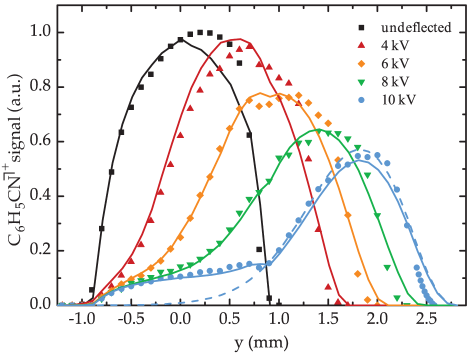
Vertical intensity profiles are obtained by recording the BN+ signal from photoionization by the fs-laser as a function of the vertical position of the laser focus. If no high-voltage is applied to the deflector, the molecular beam extends over about mm. In this case, the size of the molecular beam in the detection region is determined by the mechanical aperture of the experimental setup, i. e., by the dimensions of the deflector and the last skimmer before the detection region. As the high voltage is turned on, the molecular beam profile broadens and shifts upwards. At a voltage of 10 kV, a large fraction of the molecules is deflected out of the original, undeflected beam profile. A small fraction of the molecules, however, is almost unaffected by the deflector.
In order to understand these experimental findings, Monte Carlo simulations are employed, which are described in detail in subsection A.2. In brief, trajectory calculations are performed for molecular packets of individual rotational quantum states. These calculations yield single-quantum-state deflection profiles. Then, the single-state profiles are averaged according to the populations of the respective states in the original molecular beam (i. e., at the entrance of the deflector). From these simulations it is obvious, that the molecules in the original beam are not rotationally thermalized, an effect that has previously been observed in rotationally resolved spectroscopy Wu and Levy (1989); Berden et al. (1995). A number of different descriptions of the populations of rotational states have been given Berden et al. (1995); we use the formula for a two-temperature model originally proposed by Levy and coworkers Wu and Levy (1989). For details and the approximation of the high-temperature component see subsection A.3. Finally, the rotational temperature of the low-temperature component in the molecular beam is obtained by fitting the simulated deflection profiles to the experimental data using a local optimization algorithm. All deflection profiles measured at the different voltages are fitted simultaneously, where the fraction of the low-temperature component, a general intensity scaling factor of the deflected profiles (with respect to the undeflected beam profile), and the rotational temperature of the low-temperature component are the fitting parameters. Best agreement between experimental data and simulations is found for and K. The resulting simulated deflection profiles nicely reproduce the experimental data as shown in Figure 3 (solid lines). In particular, the undeflected part of the molecular beam for 10 kV can be perfectly simulated, which indicates that the use of a two-temperature model was indeed justified. For comparison, also a simulated deflection profile for 10 kV using a one-temperature model is shown (dashed line in Figure 3).
In order to estimate the uncertainty of , deflection profiles are calculated for different rotational temperatures. For each fixed rotational temperature, the best values for and are determined using the fitting procedure outlined above and the resulting deflection profile for a voltage of 10 kV is plotted in Figure 4.
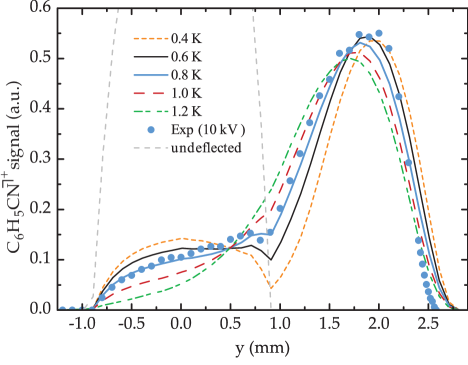
With increasing , the peak of the beam profile shifts towards smaller y-values, while, at the same time, the intensity in the undeflected part of the beam profile is reduced. From the comparison of experimental data and simulation, an uncertainty of of K is estimated.
The deflection of iodobenzene molecules (IB, C6H5I) is investigated in the same way. Vertical intensity profiles are measured by recording the signal of I+ ions, created by Coulomb explosion with a circularly polarized probe pulse, as a function of the vertical position of the probe laser focus. Figure 5 a) shows deflection measurements for IB seeded in 90 bar of He.
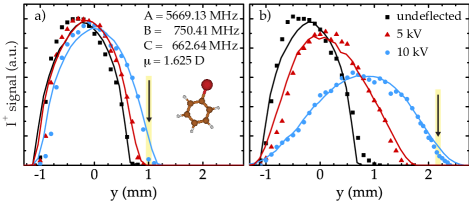
IB (mass 204 u) is heavier than BN (mass 103 u) and has a considerably smaller dipole moment of only 1.625 D Dorosh et al. (2007) compared to BN. Therefore, smaller deflection amplitudes are observed for IB under identical expansion conditions. However, the interaction time with the electric field and the time-of-flight from deflector to detection region can be increased when Ne is used as a carrier gas instead of He. Changing the carrier gas reduces the mean velocity of the molecular beam from m/s to m/s and significantly enhances the observed deflection as shown in Figure 5 b). Following the fitting procedure outlined above, can be determined for IB as well. In the case of IB, a one-temperature model with a rotational temperature of 1.05 K fits the experimental data best for the deflection measurements in helium as well as in neon. The uncertainty of is estimated to be K for IB seeded in Ne and K for IB in He. The somewhat larger uncertainty for the measurements in He reflects the small deflections observed for He. The simulated deflection profiles for IB are shown as solid lines in Figure 5 and agree well with the experimental data.
The main purpose of the deflection studies presented in this work is to provide quantum-state-selected samples of large molecules for further experiments. The degree of deflection that a molecule experiences in the electric field of the deflector depends on its quantum state. The relevant quantity is the effective dipole moment (the negative slope of the Stark curve), which depends on the electric field strength. Molecules residing in low rotational quantum states have generally the largest and are, therefore, deflected most. These molecules can simply be addressed by moving the laser focus in the detection region towards the upper cut-off of the molecular beam profile. In order to understand the laser-induced alignment and orientation experiments presented in subsection III.2 and III.3, it is crucial to know the relative populations of individual quantum states that are probed at a given height of the laser focus. The positions of the laser foci within the molecular beam profile during the alignment and orientation measurements are indicated by arrows in Figure 5. At this position, the intensity of the deflected beam is 9 % of the undeflected peak intensity. The composition of the molecular packets in the detection region can be extracted from the simulated deflection profiles. Table 1 provides an overview of the most abundant quantum states present in different regions of the beam profiles for IB at a rotational temperature of 1.05 K.
| IB in He at | IB in Ne at | IB in Ne at | undeflected beam | |||||
| (%) | (%) | (%) | (%) | (%) | (%) | (%) | ||
| 0 | 17.51 | 17.51 | 26.06 | 26.06 | 6.24 | 6.24 | 1.15 | |
| 7.71 | 13.61 | 3.24 | ||||||
| 17.58 | 23.84 | 7.79 | 1.55 | |||||
| 1.82 | 6.26 | 1.55 | ||||||
| 7.74 | 4.75 | |||||||
| 3.22 | 7.90 | 2.28 | ||||||
| 29.73 | 36.61 | 19.00 | 5.47 | |||||
| 2.98 | 2.65 | |||||||
| 3.99 | 7.68 | 5.43 | ||||||
| 10.52 | 13.49 | 7.58 | 2.54 | |||||
| 6.73 | 4.80 | |||||||
| 1.66 | 1.90 | 2.22 | ||||||
| 5.67 | 1.92 | |||||||
| 1.26 | 1.91 | |||||||
| 99.41 | 100.00 | 96.67 | 41.46 | |||||
For comparison, also the population of each rotational quantum state in the undeflected beam for this rotational temperature is given. At the position of the laser focus for the orientation experiments in Ne (column four in Table 1), the population of the lowest quantum states is significantly enhanced in the deflected beam compared to the undeflected beam. The fraction of ground state molecules is enhanced by a factor of five, for instance. About 97 % of the population resides in the quantum states listed in Table 1 with the state being most abundant. Moving the laser focus even closer towards the upper cut-off in the beam profile should reduce the number of quantum states that are probed even further. If a reduction of the beam intensity by two orders of magnitude (compared to the undeflected beam) can be afforded, only 4 quantum states are predicted to be probed with 37 % of the molecules being in the state. At first glance, it is surprising that this state and not the absolute ground state, which is expected to have the largest , is populated most in the deflected beam. In order to understand this, the Stark curves for the most deflected quantum states of IB are shown in Figure 6 a), together with their effective dipole moments (Figure 6 b).
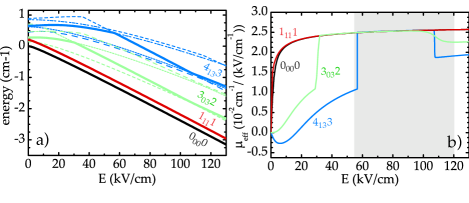
Below the relevant electric field strengths, both the and the M-sublevels have avoided crossings with close-by states of the same symmetry (dashed lines in Figure 6 a). These avoided crossings lead to large local effective dipole moments that are comparable to the ground-state . 111On the other hand, the local effective dipole moments of the neighboring states (dashed lines in Figure 6 a) are reduced by these crossings. At an avoided crossing, the two levels that are involved “exchange” their effective dipole moments. For large asymmetric top molecules, many avoided crossings can lead to a complicated shape of the adiabatic Stark curve and a strongly varying effective dipole moment with the electric field strength. Thus molecules in these quantum states are deflected as much as ground-state molecules. Furthermore, states with are doubly degenerate, whereas the ground state with is only singly degenerate. Therefore, the population of molecules in the in the undeflected beam is already larger than the population in the ground state. 222In principle, deflection of the quantum states that are coincidentally polar for the range of electric field strengths in the deflector could be reduced by operating the deflector at a different high voltage. However, due to the large number of quantum states populated and the resulting large number of avoided crossings, other quantum states might be conincidentally polar for these operation conditions. From Table 1 it is clear, that it will be difficult to isolate the rotational ground state of iodobenzene in our setup. Nevertheless, given that the fraction of ground-state molecules could be increased from 1 % in the undeflected to 26 % in the deflected beam, dramatic effects are to be expected for a variety of further experiments.
We point out, that we are assuming adiabatic following of potential energy curves in all simulations. Non-adiabatic transitions are unlikely in the strong fields inside the deflector, since the number of avoided crossings and their energy gaps generally increase with electric field strength. Moreover, the probability for non-adiabatic following depends on the rate of change of the field strength, which is only due to the slow translational motion of the molecules. However, non-adiabatic transitions have been observed in different Stark decelerator beamlines at real Wohlfart et al. (2008c) and avoided crossings Kirste et al. (2009) for small electric fields. Similarly, when the deflected molecules in the experiments reported here enter a field-free region, scrambling of population over the various components of their rotational state will occur.
For small molecules, like OCS or ClCN, the preparation of an ensemble of molecules, all in a single quantum state will be feasible with the present setup. For these systems, the number of quantum states that are populated in a supersonic jet is significantly smaller compared to large asymmetric top molecules like IB or BN. The spacing between neighboring quantum states is larger and the number of avoided crossings smaller. Thus, the differences in the effective dipole moment between individual quantum states are larger and, therefore, the degrees of their deflection will vary considerably.
III.2 Laser-Induced Alignment of Quantum-State-Selected Molecules
We now turn to studying alignment induced by the YAG pulse. The basic experimental observables are 2D I+ ion images recorded when the iodobenzene molecules are irradiated with both the YAG pulse and the probe pulse. The geometry of the laser pulse polarizations with respect to the velocity map imaging spectrometer (VMI) is illustrated in Figure 7.
The YAG pulse is linearly polarized along the vertical direction, i. e., in the detector plane. The probe pulse is linearly polarized perpendicular to the detector plane, which ensures that there is no detection bias on the molecular orientation in that plane. This results in a circularly symmetric I+ image, when only the probe pulse is used (Figure 8 A1).
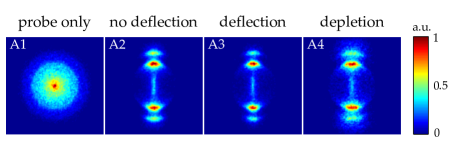
When the YAG pulse is included (Figure 8 A2-A4) the I+ images exhibit strong angular confinement along the polarization of the YAG pulse.
The I+ ions appear as two pairs of radially localized regions, corresponding to two different fragmentation channels of the Coulomb explosion. The radius of the outermost (and weakest) pair of rings is approximately times larger than the radius of the innermost (and brightest) pair of rings. Since the radius is proportional to the velocity of the ions the I+ ions from the outermost pair of rings originate from a Coulomb explosion channel that releases twice as much kinetic energy as the channel producing the I+ ions in the innermost pair of rings. As pointed out in several previous studies from our group (see for instance reference Larsen et al., 1999) this is only consistent with the innermost pair of rings originating from iodobenzene being doubly ionized by the probe pulse and fragmenting into an I++ C6H5+ ion pair, and the outermost pair of rings originating from I+ ions formed by triple ionization and fragmentation into an I++ C6H52+ ion pair. The pronounced angular confinement observed in images A2-A4 is quantified by calculating the expectation value of , where is the angle between the YAG pulse polarization and the projection of the I+ recoil velocity vector onto the detector plane. In this paper, values are calculated only from ions detected in radial region corresponding to the I++ C6H52+ channel. By doing so, the YAG intensities probed are restricted to a narrow range close to the maximum value, as the high nonlinearity of the multiphoton process occurs efficiently only in the spatial regions close to the focal point of the YAG beam.
Image A1, recorded with only the probe pulse present, should correspond to a target of randomly oriented molecules. As expected the image is circular symmetric and . When the YAG pulse is included (image A2) a pronounced angular confinement is observed along the polarization of the YAG pulse and is increased to 0.947. These observations are in complete agreement with previous studies Kumarappan et al. (2006). When the deflector is turned on and the laser foci moved to the edge of the most deflected molecules (at the position marked in Figure 5 a), corresponding to molecules in the lowest rotational states, the angular confinement is further enhanced (image A3) leading to a value of 0.968. By contrast, when the experiment is conducted on the least deflected molecules in the depleted region (image A4), corresponding to molecules in the highest rotational states, the alignment is weakened and =0.900.
We repeated the alignment measurements when iodobenzene was seeded in Ne. The results are displayed in Figure 9.
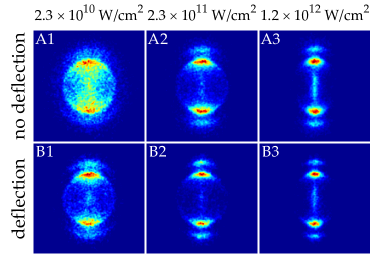
Like in the He case a pronounced improvement is observed when deflected rater than undeflected molecules are employed. Figure 9 shows images of I+ recorded at three different intensities of the YAG laser for both undeflected and deflected molecules seeded in Ne. The effect of the deflector is clearly seen when comparing, for instance, image B1 (deflected) and A1 (undeflected). At this low YAG intensity ( W/cm2) weak alignment is obtained in the non-deflected beam with . Going to the edge of the deflected molecular beam (position indicated in Figure 5 b ) a clear enhancement is observed (image B1) with the value rising to 0.869. Also, at high YAG intensity ( W/cm2) the difference in angular confinement comparing the undeflected (image A3) to the deflected molecules (image B3) is visible. While =0.929 represents the limit of the degree of alignment of iodobenzene seeded in Ne in the undeflected beam, emloying the deflector leads to an unprecedented degree of laser-induced alignment of . We note that = 1 would correspond to the quantum mechanically unfeasible situation of perfectly 1D aligned molecules.
To quantify the angular information of the images, values are plotted as a function of YAG intensity, the results are displayed in Figure 10.
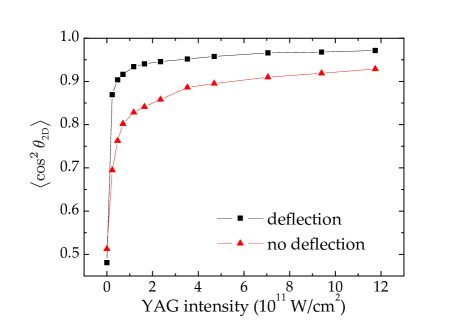
Even at very low laser intensities a high degree of alignment can be obtained from an ensemble of quantum-state-selected molecules. The tendency shown in this graph with a steep rise and early saturation of the degree of alignment agrees with previous results investigating the dependence of alignment on the rotational temperature of the ensemble of molecules Kumarappan et al. (2006). Effectively, the quantum-state selection corresponds to a “colder” albeit non-thermal beam (see subsection III.1).
Note that the contrast between the undeflected and the deflected beam is expected to be greater if Ne is used instead of He as a carrier gas. In the undeflected beam the maximum degree of alignment that can be achieved is smaller in Ne because the rotational cooling in the supersonic expansion is less effective due to the lower stagnation pressureHillenkamp et al. (2003). Additionally, in the deflected beam a better degree of alignment is expected for Ne, as the efficiency of the quantum-state selection in the present setup is significantly enhanced due to the longer residence time in the deflector (see subsection III.1).
III.3 Laser-Induced Orientation of Quantum-State-Selected Molecules
Next, we discuss orientation due to the combined action on the molecules by the YAG pulse and the static electric field (E) from the VMI electrodes Friedrich and Herschbach (1999a, b).
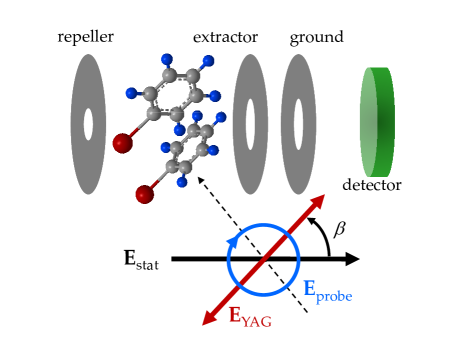
Figure 11 illustrates the polarization state of the YAG and the probe pulse with respect to the static electric field of the VMI electrodes. The important difference compared to the alignment data is that the YAG polarization is rotated away from the axis perpendicular to the static field. Thus, the orientation data result from geometries where the angle , between the YAG polarization (the C-I bond axis) and the static electric field, is different from 90∘- see Figure 11. To image orientation a circularly polarized probe pulse is used. This ensures that any molecule will be ionized - and thus detected - with the same probability independent of . This circularly polarized probe will induce some bias on the angular distribution of the I+ ions (see Figure 12 A1 and C1), however, importantly, it is up/down symmetric.
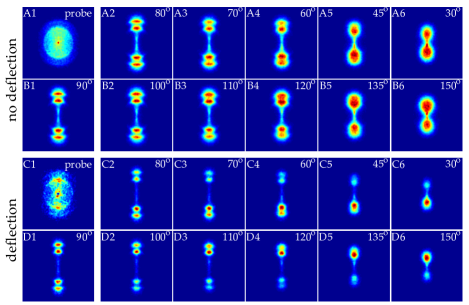
Figure 12 shows I+ ion images for different values for both deflected and undeflected molecules seeded in He. As mentioned the circularly polarized probe alone gives rise to an image that exhibits some angular confinement with =0.70 (Figure 12 A1). Consequently, including the YAG pulse at ∘ results in an image (Figure 12 B1) that appears slightly different from the corresponding image with a linearly polarized probe (Figure 8 A2), but still shows that the molecules are tightly aligned.
Focussing first on the non-deflected data of Figure 12 (row A and B) two prominent changes are observed as the polarization of the YAG pulse is gradually rotated away from the detector plane (images A2-A6 and B2-B6). First, the location of the I+ rings shifts closer to the center of the images. This is due to the fact that the C-I axis alignment, and thus the emission direction of the I+ ions, follows the YAG pulse polarization. When the C-I axis is aligned at an angle the magnitude of the I+ velocity vector recorded on the detector will be reduced by the factor . The detrimental effect on the radial (velocity) resolution is obvious at (image A5 and B5) and (image A6 and B6), where the two I+ explosion channels, I++ C6H5+ and I++ C6H52+, become indistinguishable as they merge in the 2D projection onto the detector plane.
Secondly, as the YAG pulse polarization is turned away from 90∘the up/down symmetry of the images, characteristic for the alignment data described in subsection III.2 (and Figure 12 column 1), is broken. For images with (images B2-B6) more I+ ions are detected in the upper part, whereas for (images A2-A6) more I+ ions are detected in the lower part. The asymmetry becomes more pronounced as the YAG polarization is rotated closer to the axis of the static field. We interpret these observations as orientation due to the combined effect of the YAG laser field and the projection of the static electric extraction field (E) on the YAG polarization axis. This projection (numerical value: increases as is rotated towards 0∘ or 180∘, which is expected to cause an increase of the orientation Friedrich and Herschbach (1999a, b), in agreement with the experimental findings.
As discussed in subsection III.1 all states of iodobenzene are high-field seeking, hence the orientation is expected to place the I-end of the molecules towards the repeller plate (see Figure 11), where the electrical potential is highest, because the dipole moment of iodobenzene is directed along the C-I axis pointing from iodine (“negative end”) towards the phenyl ring (“positive end”). The expected resulting molecular orientation at a given angle of is shown in Figure 11. Thus, for the I+ ions are expected to preferentially be ejected downwards, and for they will be ejected upwards. This is in agreement with the up/down asymmetry in the images.
The alignment (images D1) and orientation (images C2–C6 and D2–D6) improves significantly when the deflector is turned on and the foci of the lasers are moved to the position of the most deflected molecules [position marked in Figure 5 a)]. The markedly better orientation resulting in a much more pronounced up/down asymmetry is clearly visible even when the the YAG pulse is only turned slightly away from perpendicular, i. e., comparing deflected and undeflected images for =100∘ (image C2 and A2) and (image D2 and B2). From the previous discussion it appears that the highest degree of orientation is achieved when is rotated towards 0∘ or 180∘. This is clearly seen from the images in row C and D and, again, the improvement obtained with deflected molecules is striking - compare image C6 to A6 (or D6 to B6).
Similar orientation measurements were conducted for iodobenzene seeded in Ne instead of in He. Figure 13 shows I+ images at a series of values for two different intensities of the YAG pulse recorded with the deflector at 10 kV at the position marked in Figure 5 b).
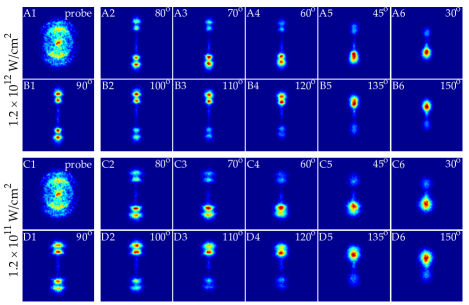
Compared to the images displayed in Figure 12 row A and B, although recorded at slightly different intensities of the YAG pulse, a significant improvement is observed. Furthermore even at low intensity of the YAG a high degree of orientation for iodobenzene seeded in Ne is achieved. At the same time some loss in the angular confinement, i. e., in the alignment degree, is visible. We assign the clear improvement in the up/down asymmetry to the more stringent state selection in Ne compared to He as described in subsection III.1, hence, manifesting itself in a higher degree of orientation.
To quantify the up/down asymmetry, i. e., the degree of orientation, we determine for each image the number of I+ ions, N(I+), in the upper part of the I+ + C6H5+ and I+ + C6H52+ channels (i. e., ions detected in the upper half of the images) as well as the total number of ions, . This ratio, as a function of , is displayed in Figure 14.
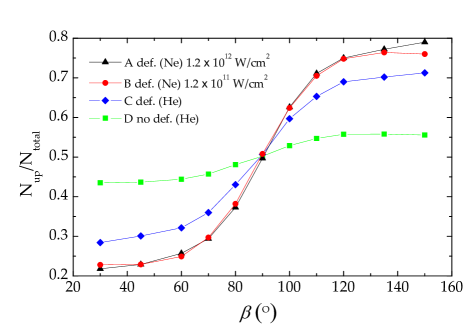
Focussing first on curves C and D, representing iodobenzene seeded in He, the difference between the data for the deflected molecules and the data obtained with the deflector turned off is striking and shows the advantage of selecting the lowest-lying rotational states for strongly increasing the degree of orientation. The further improvement when Ne is used instead of He is clear from curves A and B. These two curves also show that the pronounced degree of orientation is maintained when the intensity of the YAG pulse is lowered by an order of magnitude compared to the maximum value of W/cm2.
IV Conclusion and Outlook
In conclusion, we have shown that deflection of cold molecular beams with an inhomogeneous static
electric field enables the selection and the spatial separation of the most polar quantum states,
i. e., the lowest-lying rotational states. The method demonstrated here is complementary to
state-selection for small molecules using a hexapole focuser, which has been suggested to be applied
for improved alignment and orientation experiments Gijsbertsen et al. (2007) and recently been
experimentally demonstrated Ghafur et al. (2009). While a hexapole focuser only works for small
molecules in low-field-seeking quantum states, beam deflection will apply broadly to a wide range of
molecules, from diatomics to large biomolecules. The deflection is strongest for molecules with a
large permanent dipole moment to mass ratio. For a given molecule the deflection is optimized by
employing stronger deflection fields, increasing the length of the deflector, or lowering the speed
of the molecule, for instance, by using neon rather than helium as a carrier gas. For small
molecules, the preparation of an ensemble of molecules all in a single quantum state should be
feasible. As an application of the state-selected molecules we showed that selection of iodobenzene
in low lying rotational states allows to achieve unprecedented degrees of laser-induced adiabatic
alignment and mixed laser- and static-field orientation. In particular, we demonstrated that strong
alignment and orientation can be maintained even when the intensity of the alignment pulse is
lowered to the – W/cm2 range. This can reduce unwanted disturbance from the
laser field in future applications of adiabatically aligned or oriented molecules. We note that it
should be possible to improve the degree of orientation obtained here simply by increasing the
static electric field. Due to experimental constraints this was not implemented in the present work.
Getting access to cold molecules in the gas phase typically involves using a molecular beam from a
supersonic expansion that usually consists of more than 99 percent carrier gas and less than one
percent of the specific molecules. In several types of experiments the atomic carrier gas can
contribute to, or even completely overshadow the particular signal measured. The electrostatic
deflection naturally separates the polar molecules from the unpolar carrier gas and thus removes this
unwanted background. We conservatively estimate the density in the original molecular beam to be molecules/cm3. In the experiments presented here the density in the deflected part of the beam is approximately molecules/cm3. We foresee this density to be sufficient for a variety of applications, such as photoelectron spectroscopy with VUV, EUV Ng (2002), or x-ray light sources, including
attosecond pulses, or high harmonic generation experiments with fs laser
pulses Li et al. (2008). For all of these applications the separation of the molecular
target from the carrier gas might be of great relevance.
Additionally, brute-force orientation Loesch and Remscheid (1990); Friedrich and Herschbach (1991), that is, the spatial orientation of polar molecules using strong dc electric fields, will benefit from the state-selected samples similar to what was demonstrated here. In fact, the states that are deflected the most are also oriented the most in a dc electric field. To illustrate the achievable orientation, we have calculated the ensemble averaged orientation in a homogeneous electric field of 250 kV/cm for iodobenzene for a thermal ensemble of 1 K. For this ensemble is obtained. For a deflected, quantum-state-selected sample of iodobenzene molecules at 1 % of the undeflected peak intensity (see Table 1), an increased ensemble averaged orientation of is predicted. For nonadiabatic alignment Rosca-Pruna and Vrakking (2001); Stapelfeldt and Seideman (2003) it was demonstrated, that the dynamics and, importantly, the degree of alignment and orientation depends strongly on the initial rotational state distribution T. Seideman (2001); M. Machholm (2001); F. Rosca-Pruna and M. J. J. Vrakking (2002); Péronne et al. (2004); Muramatsu et al. (2009). Selection of rotational states is, therefore, highly advantageous for nonadiabatic laser-induced schemes to control the spatial orientation of molecules, as recently demonstrated for NO molecules. Ghafur et al. (2009) In general, complete elimination of the rotational tumbling of an asymmetric top molecule requires, that all three principal axes are confined along laboratory fixed axes. This is the area of 3D alignment and orientation, subjects that have been treated theoretically and experimentally Larsen et al. (2000); Tanji et al. (2005); Lee et al. (2006); Viftrup et al. (2007); Rouzee et al. (2008); Nevo et al. (2009). A straightforward extension of the current work would be significantly improved 3D alignment and orientation of polar molecules by employing state-selected molecules and we have recently performed such experiments Nevo et al. (2009).
For large (bio-)molecules, typically multiple structural isomers (conformers) Suenram and Lovas (1980) are present even at the low temperatures in a supersonic jet Rizzo et al. (1985). These conformers often exhibit large, and largely different dipole moments what can be exploited to spatially separate them using inhomogeneous electric fields. This separation has recently been demonstrated in an alternating gradient focusing (AG) selector for the cis- and trans-conformers of 3-aminophenol Filsinger et al. (2008). However, also the static field of a deflector can be used to spatially isolate individual conformers Filsinger et al. (2009). In general, the ability to achieve very high degrees of alignment and orientation is of great interest for a number of applications. We therefore believe state-selected molecules could be very beneficial for areas such as photoelectron angular distributions from fixed-in-space molecules Bisgaard et al. (2009), (ultrafast) diffraction with electron or x-ray sources Spence and Doak (2004); Peterson et al. (2008) and time-resolved studies of light-induced stereochemistry Madsen et al. (2009). Furthermore, Janssen and coworkers have shown that the ability to select a single rotational state with a hexapole focuser enables new possibilities for studying directional dynamics of fragments in photodissociation of small molecules Rakitzis et al. (2004). The deflection method strongly increases the number of molecules to which single rotational state selection, and subsequent orientation, can be applied. In particular, it will offer access to studies of photoinitiated processes in oriented targets of larger asymmetric tops.
Appendix A Simulation of Beam Profiles
In this Appendix, the simulations of the experimental deflection profiles are described in detail. First, the calculation of the Stark effect for asymmetric top molecules is explained in subsection A.1. subsection A.2 describes how single-quantum-state deflection profiles are obtained from trajectory simulations using the calculated Stark curves. Finally, the single-quantum-state profiles are averaged in a suitable way to simulate a thermal ensemble for a given rotational temperature, which is described in subsection A.3, and fitted to the experimental data (subsection A.4).
A.1 Stark Effect Calculations
In order to calculate the adiabatic energy curves for asymmetric top molecules, the Hamiltonian matrix is set up in the basis of symmetric top wavefunctions. In the presence of an electric field, only is a good quantum number for an asymmetric rotor. , which is a good quantum number in the field-free case, is mixed by the field, whereas is mixed by the molecular asymmetry. Thus, the adiabatic energy curves can be calculated for the different levels individually by setting up and diagonalizing the matrices including all and levels. An accurate description of higher rotational quantum states also requires including centrifugal distortion constants. The Hamiltonian of an asymmetric rotor molecule with dipole moment in an electric field of strength can be written as the sum of the Hamiltonian of an asymmetric rotor in free space in Watson’s A-reduction Watson (1977) and the contribution due to the Stark effect as
| (1) |
Following references Watson, 1977 and Abd El Rahim et al., 2005, the corresponding matrix elements are: 333Note that in reference Abd El Rahim et al., 2005 representation is used.
| (2) | ||||
| (3) | ||||
| (4) | ||||
| (5) | ||||
| (6) | ||||
| (7) | ||||
| (8) | ||||
| (9) |
For the correct assignment of the states to the “adiabatic quantum number labels” , i. e., to the adiabatically corresponding field-free rotor states, one has to classify the states according to their character in the electric field symmetry group Watson (1975); Bunker and Jensen (1998). This symmetry classification can be performed by applying a Wang transformation Wang (1929) to the Hamiltonian matrix. If the molecule’s dipole moment is along one of the principal axes of inertia, the matrix will be block diagonalized by this transformation according to the remaining symmetry in the field and the blocks can be treated independently. For arbitrary orientation of the dipole moment in the inertial frame of the molecule the full matrix must be diagonalized. In any case, this process ensures that all states (eigenvalues and eigenvectors) obtained from a single matrix diagonalization do have the same symmetry, and, therefore, no real crossings between these states can occur. Therefore, by sorting the resulting levels by energy and assigning quantum number labels in the same order as for the field-free states of the same symmetry yields the correct adiabatic labels. These calculations are performed for a number of electric field strengths – typically in steps of 1 kV/cm from 0 kV/cm to 200 kV/cm – and the resulting energies, , are stored for later use in simulations using the libcoldmol program package Küpper and Filsinger (2003-2008).
A.2 Monte Carlo Simulations of a Molecular Beam
Simulations of the electrostatic beam deflection in our setup are performed with the home-built software package libcoldmol Küpper and Filsinger (2003-2008). Trajectories for individual molecules in a given rotational quantum states are obtained from numerical integration of the 3D equations of motion using a Runge-Kutta algorithm. The initial phase space distribution of the molecular packet in the transverse spatial coordinates, and , is described by the mean values and widths of circular uniform distributions. For the velocity coordinates, Gaussian distributions characterized by their mean values and full widths at half maximum are used. Also the initial time spread of the molecular beam, which corresponds to the opening time of the valve, is described by a Gaussian distribution centered around . From the initial phase space distribution, the position of a molecule in phase space is randomly chosen. Then, it is propagated through the beamline, which includes all mechanical apertures of the experimental setup. From the electric field in the electrostatic deflector, which is calculated in two dimensions using finite element methods (Comsol Multiphysics 3.4), and the Stark energy (see Appendix A.1), the force acting on the molecule in the transverse directions is obtained: . The electric field is taken to be constant along . Finally, the deflected molecules are propagated through field-free space to the detection region. For each quantum state, 105 trajectories are calculated yielding single-quantum-state deflection profiles .
A.3 Deflection Profiles
The spatial deflection profile for an ensemble of molecules at a given rotational temperature, , is calculated from the single-quantum-state deflection profiles, , as follows:
| (10) |
Here, is the number of quantum states included in the simulations and is the population weight for a given quantum state:
| (11) |
with being the field-free potential energy of the ground state and the field-free energy of the current state; for and otherwise; accounts for the nuclear spin statistical weight of the current state. For both, benzonitrile and iodobenzene, for even and otherwise. The normalization is given by .
In some cases, a molecular beam cannot be accurately described by a single rotational temperature Wu and Levy (1989). Therefore, a two-temperature model is implemented in our simulations. In the two-temperature model, the low-temperature part of the molecular beam is calculated as described above. In order to realistically simulate the high-temperature component in the molecular beam, a very large number of quantum states would have to be included in the simulations for large asymmetric top molecules. Because these Monte Carlo simulations are very time consuming, the high-temperature component is approximated by adding a small fraction of undeflected molecules to the deflected beam profile. This approximation is well justified, because typical rotational temperatures for the high-temperature component in a molecular beam are on the order of 10 K and, for these temperatures, most of the molecules reside in high rotational quantum states that have a small Stark shift and, therefore, remain almost undeflected. Thus, the deflection profile, , in the two-temperature model is calculated as
| (12) |
where and denotes the undeflected spatial beam profile that is obtained when both electrodes are grounded.
A.4 Fit of Rotational Temperature
In order to calculate the rotational temperature of the molecular beam, the simulated deflection profiles are fitted to the experimental data using a Nelder-Mead simplex algorithm. In the fitting procedure, the difference between simulated and measured deflection profiles is minimized, where the rotational temperature of the low-temperature component, the fraction of molecules in this low-temperature component, and a general intensity scaling factor of the deflected profiles (with respect to the undeflected beam profile) are used as fitting parameters. All deflection curves measured for different high voltages are fitted simultaneously to determine the rotational temperature.
Acknowledgements.
We thank Henrik Haak for expert technical support. This work is further supported by the Carlsberg Foundation, the Lundbeck Foundation, the Danish Natural Science Research Council, and the Deutsche Forschungsgemeinschaft within the priority program 1116.References
- Loesch and Remscheid (1990) H. J. Loesch and A. Remscheid, J. Chem. Phys. 93, 4779 (1990).
- Friedrich and Herschbach (1991) B. Friedrich and D. R. Herschbach, Nature 353, 412 (1991).
- Friedrich and Herschbach (1995a) B. Friedrich and D. Herschbach, Phys. Rev. Lett. 74, 4623 (1995a).
- Stapelfeldt and Seideman (2003) H. Stapelfeldt and T. Seideman, Rev. Mod. Phys. 75, 543 (2003).
- Friedrich and Herschbach (1999a) B. Friedrich and D. Herschbach, J. Chem. Phys. 111, 6157 (1999a).
- Friedrich and Herschbach (1999b) B. Friedrich and D. Herschbach, J. Phys. Chem. A 103, 10280 (1999b).
- Filsinger et al. (2008) F. Filsinger, U. Erlekam, G. von Helden, J. Küpper, and G. Meijer, Phys. Rev. Lett. 100, 133003 (2008).
- Spence and Doak (2004) J. C. H. Spence and R. B. Doak, Phys. Rev. Lett. 92, 198102 (2004).
- Peterson et al. (2008) E. R. Peterson, C. Buth, D. A. Arms, R. W. Dunford, E. P. Kanter, B. Krassig, E. C. Landahl, S. T. Pratt, R. Santra, S. H. Southworth, and L. Young, Astrophys. Lett. & Comm. 92, 094106 (2008).
- Levesque et al. (2007) J. Levesque, Y. Mairesse, N. Dudovich, H. Pépin, J.-C. Kieffer, P. B. Corkum, and D. M. Villeneuve, Phys. Rev. Lett. 99, 243001 (2007).
- Itatani et al. (2004) J. Itatani, J. Levesque, D. Zeidler, H. Niikura, H. Pépin, J. C. Kieffer, P. B. Corkum, and D. M. Villeneuve, Nature 432, 867 (2004).
- Stolte (1988) S. Stolte, in Atomic and molecular beam methods, edited by G. Scoles (Oxford University Press, New York, NY, USA, 1988), vol. 1, chap. 25, pp. 631–652.
- Kallmann and Reiche (1921) H. Kallmann and F. Reiche, Z. Phys. 6, 352 (1921).
- Wrede (1927) E. Wrede, Z. Phys. 44, 261 (1927).
- Stern (1926) O. Stern, Z. Phys. 39, 751 (1926).
- Rabi et al. (1939) I. I. Rabi, S. Millman, P. Kusch, and J. R. Zacharias, Phys. Rev. 55, 526 (1939).
- Bennewitz and Paul (1954) H. G. Bennewitz and W. Paul, Z. Phys. 139, 489 (1954).
- Bennewitz et al. (1955) H. G. Bennewitz, W. Paul, and C. Schlier, Z. Phys. 141, 6 (1955).
- Gordon et al. (1954) J. P. Gordon, H. J. Zeiger, and C. H. Townes, Phys. Rev. 95, 282 (1954).
- Gordon et al. (1955) J. P. Gordon, H. J. Zeiger, and C. H. Townes, Phys. Rev. 99, 1264 (1955).
- Bennewitz et al. (1964) H. G. Bennewitz, K. H. Kramer, J. P. Toennies, and W. Paul, Z. Phys. 177, 84 (1964).
- Brooks and Jones (1966) P. R. Brooks and E. M. Jones, J. Chem. Phys. 45, 3449 (1966).
- Beuhler et al. (1966) R. J. Beuhler, R. B. Bernstein, and K. H. Kramer, J. Am. Chem. Soc. 88, 5331 (1966).
- Parker and Bernstein (1989) D. H. Parker and R. B. Bernstein, Annu. Rev. Phys. Chem. 40, 561 (1989).
- Kuipers et al. (1988) E. W. Kuipers, M. G. Tenner, A. Kleyn, and S. Stolte, Nature 334, 420 (1988).
- Rakitzis et al. (2004) T. P. Rakitzis, A. J. van den Brom, and M. H. M. Janssen, Science 303, 1852 (2004).
- Bethlem et al. (1999) H. L. Bethlem, G. Berden, and G. Meijer, Phys. Rev. Lett. 83, 1558 (1999).
- Fulton et al. (2004) R. Fulton, A. I. Bishop, and P. F. Barker, Phys. Rev. Lett. 93, 243004 (2004).
- Vanhaecke et al. (2007) N. Vanhaecke, U. Meier, M. Andrist, B. H. Meier, and F. Merkt, Phys. Rev. A 75, 031402(R) (2007).
- Auerbach et al. (1966) D. Auerbach, E. E. A. Bromberg, and L. Wharton, J. Chem. Phys. 45, 2160 (1966).
- Bethlem et al. (2006) H. L. Bethlem, M. R. Tarbutt, J. Küpper, D. Carty, K. Wohlfart, E. A. Hinds, and G. Meijer, J. Phys. B 39, R263 (2006).
- Tarbutt and Hinds (2008) M. R. Tarbutt and E. A. Hinds, New J. Phys. 10, 073011 (2008).
- Wohlfart et al. (2008a) K. Wohlfart, F. Grätz, F. Filsinger, H. Haak, G. Meijer, and J. Küpper, Phys. Rev. A 77, 031404(R) (2008a).
- Moro et al. (2003) R. Moro, X. Xu, S. Yin, and W. A. de Heer, Science 300, 1265 (2003).
- Broyer et al. (2007) M. Broyer, R. Antoine, I. Compagnon, D. Rayane, and P. Dugourd, Phys. Scr. 76, C135 (2007).
- Holmegaard et al. (2009) L. Holmegaard, J. H. Nielsen, I. Nevo, H. Stapelfeldt, F. Filsinger, J. Küpper, and G. Meijer, Phys. Rev. Lett. 102, 023001 (2009).
- Hillenkamp et al. (2003) M. Hillenkamp, S. Keinan, and U. Even, J. Chem. Phys. 118, 8699 (2003).
- Kumarappan et al. (2006) V. Kumarappan, C. Z. Bisgaard, S. S. Viftrup, L. Holmegaard, and H. Stapelfeldt, J. Chem. Phys. 125, 194309 (2006).
- Buck and Fárník (2006) U. Buck and M. Fárník, Int. Rev. Phys. Chem. 25, 583 (2006).
- Minemoto et al. (2003) S. Minemoto, H. Nanjo, H. Tanji, T. Suzuki, and H. Sakai, J. Chem. Phys. 118, 4052 (2003).
- Friedrich and Herschbach (1995b) B. Friedrich and D. Herschbach, J. Phys. Chem. 99, 15686 (1995b).
- Sakai et al. (1999) H. Sakai, C. P. Safvan, J. J. Larsen, K. M. Hilligsøe, K. Hald, and H. Stapelfeldt, J. Chem. Phys. 110, 10235 (1999).
- Even et al. (2000) U. Even, J. Jortner, D. Noy, N. Lavie, and N. Cossart-Magos, J. Chem. Phys. 112, 8068 (2000).
- Ramsey (1956) N. F. Ramsey, Molecular Beams, The International Series of Monographs on Physics (Oxford University Press, London, GB, 1956).
- Wohlfart et al. (2008b) K. Wohlfart, M. Schnell, J.-U. Grabow, and J. Küpper, J. Mol. Spec. 247, 119 (2008b).
- Wu and Levy (1989) Y. R. Wu and D. H. Levy, J. Chem. Phys. 91, 5278 (1989).
- Berden et al. (1995) G. Berden, W. L. Meerts, and E. Jalviste, J. Chem. Phys. 103, 9596 (1995).
- Dorosh et al. (2007) O. Dorosh, E. Białkowska-Jaworska, Z. Kisiel, and L. Pszczółkowski, J. Mol. Spec. 246, 228 (2007).
- Wohlfart et al. (2008c) K. Wohlfart, F. Filsinger, F. Grätz, J. Küpper, and G. Meijer, Phys. Rev. A 78, 033421 (2008c).
- Kirste et al. (2009) M. Kirste, B. G. Sartakov, M. Schnell, and G. Meijer, Phys. Rev. A 79, 051401(R) (2009).
- Larsen et al. (1999) J. J. Larsen, H. Sakai, C. P. Safvan, I. Wendt-Larsen, and H. Stapelfeldt, J. Chem. Phys. 111, 7774 (1999).
- Gijsbertsen et al. (2007) A. Gijsbertsen, W. Siu, M. F. Kling, P. Johnsson, P. Jansen, S. Stolte, and M. J. J. Vrakking, Phys. Rev. Lett. 99, 213003 (2007).
- Ghafur et al. (2009) O. Ghafur, A. Rouzee, A. Gijsbertsen, W. K. Siu, S. Stolte, and M. J. J. Vrakking, Nature Phys. 5, 289 (2009).
- Ng (2002) C. Ng, Annu. Rev. Phys. Chem. 53, 101 (2002).
- Li et al. (2008) W. Li, X. Zhou, R. Lock, S. Patchkovskii, A. Stolow, H. C. Kapteyn, and M. M. Murnane, Science 322, 1207 (2008).
- Rosca-Pruna and Vrakking (2001) F. Rosca-Pruna and M. J. J. Vrakking, Phys. Rev. Lett. 87, 153902 (2001).
- T. Seideman (2001) T. Seideman, J. Chem. Phys. 115, 5965 (2001).
- M. Machholm (2001) M. Machholm, J. Chem. Phys. 115, 10724 (2001).
- F. Rosca-Pruna and M. J. J. Vrakking (2002) F. Rosca-Pruna and M. J. J. Vrakking, J. Chem. Phys. 116, 6579 (2002).
- Péronne et al. (2004) E. Péronne, M. D. Poulsen, H. Stapelfeldt, C. Z. Bisgaard, E. Hamilton, and T. Seideman, Phys. Rev. A 70, 063410 (2004).
- Muramatsu et al. (2009) M. Muramatsu, M. Hita, S. Minemoto, and H. Sakai, Phys. Rev. A 79, 011403(R) (2009).
- Larsen et al. (2000) J. J. Larsen, K. Hald, N. Bjerre, H. Stapelfeldt, and T. Seideman, Phys. Rev. Lett. 85, 2470 (2000).
- Tanji et al. (2005) H. Tanji, S. Minemoto, and H. Sakai, Phys. Rev. A 72, 063401 (2005).
- Lee et al. (2006) K. F. Lee, D. M. Villeneuve, P. B. Corkum, A. Stolow, and J. G. Underwood, Phys. Rev. Lett. 97, 173001 (2006).
- Viftrup et al. (2007) S. S. Viftrup, V. Kumarappan, S. Trippel, H. Stapelfeldt, E. Hamilton, and T. Seideman, Phys. Rev. Lett. 99, 143602 (2007).
- Rouzee et al. (2008) A. Rouzee, S. Guerin, O. Faucher, and B. Lavorel, Phys. Rev. A 77, 043412 (2008).
- Nevo et al. (2009) I. Nevo, L. Holmegaard, J. H. Nielsen, J. L. Hansen, H. Stapelfeldt, F. Filsinger, G. Meijer, and J. Küpper, Phys. Chem. Chem. Phys. (2009), accepted, preprint available at http://arxiv.org/abs/0906.2971.
- Suenram and Lovas (1980) R. D. Suenram and F. J. Lovas, J. Am. Chem. Soc. 102, 7180 (1980).
- Rizzo et al. (1985) T. R. Rizzo, Y. D. Park, L. Peteanu, and D. H. Levy, J. Chem. Phys. 83, 4819 (1985).
- Filsinger et al. (2009) F. Filsinger, J. Küpper, G. Meijer, J. L. Hansen, J. Maurer, J. H. Nielsen, L. Holmegaard, and H. Stapelfeldt, Angew. Chem. Int. Ed. 48, 6900 (2009).
- Bisgaard et al. (2009) C. Z. Bisgaard, O. J. Clarkin, G. Wu., A. M. D. Lee, O. Geßner, C. C. Hayden, and A. Stolow, Science 323, 1464 (2009).
- Madsen et al. (2009) C. B. Madsen, L. B. Madsen, S. S. Viftrup, M. P. Johansson, T. B. Poulsen, L. Holmegaard, V. Kumarappan, K. Jørgensen, and H. Stapelfeldt, Phys. Rev. Lett. 102, 073007 (2009).
- Watson (1977) J. K. G. Watson, in Vibrational Spectra and Structure, edited by J. R. Durig (Marcel Dekker, 1977), vol. 6, chap. 1.
- Abd El Rahim et al. (2005) M. Abd El Rahim, R. Antoine, M. Broyer, D. Rayane, and P. Dugourd, J. Phys. Chem. A 109, 8507 (2005).
- Watson (1975) J. K. G. Watson, Can. J. Phys 53, 2210 (1975).
- Bunker and Jensen (1998) P. R. Bunker and P. Jensen, Molecular Symmetry and Spectroscopy (NRC Research Press, Ottawa, Ontario, Canada, 1998), 2nd ed.
- Wang (1929) S. C. Wang, Phys. Rev. 34, 243 (1929).
- Küpper and Filsinger (2003-2008) J. Küpper and F. Filsinger, libcoldmol: A particle trajectory calculation framework (2003-2008), URL: http://libcoldmol.cold-molecules.info.