Observational difference between gamma and X-ray properties of optically dark and bright GRBs
Abstract
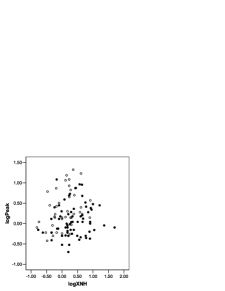
Using the discriminant analysis of the multivariate statistical analysis we compared the distribution of the physical quantities of the optically dark and bright GRBs, detected by the BAT and XRT on board of the Swift Satellite. We found that the GRBs having detected optical transients (OT) have systematically higher peak fluxes and lower HI column densities than those without OT.
Keywords:
-ray sources; -ray bursts:
01.30.Cs, 95.55.Ka, 95.85.Pw, 98.38.Dq, 98.38.Gt, 98.70.Rz1 Introduction
One of the major tasks of the Swift satellite is to detect and follow up the Optical Transients (OTs) accompanying the outburst in the gamma energy range. Although, the burst alert given by the BAT on board of the satellite is followed by the XRT detection in the X-ray regime, except a few cases, a significant fraction of GRBs remain without detected OT. Since the vast majority of the GRBs are detected both by BAT and XRT, it is a reasonable question whether there are measurable differences in the gamma and /or X-ray properties between the bursts observed by the Swift satellite but have or do not have OT.
At its URL location111 http://swift.gsfc.nasa.gov/docs/swift/archive/grb_table Swift listed 276 GRB detections until writing the paper (Oct 26, 2007). Out of these XRT detected 231 and UVOT 72 cases.
In this work we use the and X-ray data measured by BAT and XRT: T90 Duration, Fluence, 1-sec Peak Photon Flux, Early Flux, Initial Temporal Decay Index, Spectral Index and Column Density (NH). We formed two groups from these cases, with and without OT, and compared them by making use the discriminant analysis of the multivariate statistical analysis.
2 Mathematical Summary
Discriminant analysis aims to make difference between groups in the multivariate parameter space, orders membership probabilities to the cases and one may use this scheme for classifying additional ones not having assigned group memberships. We use this technique to look for differences in the distributions of GRBs with or without OT, in the parameter space defined by the BAT and XRT variables mentioned above.
Let us have a set of measured variables on cases which are assigned to one of the classes ( in our case). We look for linear combination of the variables which gives maximal separation between the groups of the cases. There are altogether discriminating variables. In our cases we have only two groups so we have only one such a variable. It means we are looking for the variable
| (1) |
with a suitable chosen coefficients ensuring a maximal separation between the two classes. There are several approaches to solve this problem (for more details see KS:1973 ). These are usually among the major ingredients of the professional statistical software packages. We used SPSS222SPSS is a registered trademark (http://www.spss.com) in our computations.
3 Descriptive Statistics of the Data
We excluded those cases from our analysis when the slewing time was greater than 300 sec. With this choice we excluded the GRBs when the normal slewing of the satellite was blocked by some reason. Table 1 summarizes the means and standard deviations of the variables in the analysis for the whole sample and for the groups, separately.
In the table we listed all cases having measured values in all variables used in the analysis. We marked with bold face the peak flux and Hydrogen column density, where the mean values differ significantly between the groups with and without OT. We give the results of the test of significance in Table 2.
| OT | Variable | Mean | Standard dev. | No of cas. |
|---|---|---|---|---|
| No | logT90 | 1.43 | .67 | 71 |
| logFluence | .98 | .63 | 71 | |
| logPeak | .09 | .42 | 71 | |
| logXflux | 1.18 | 1.31 | 71 | |
| logXdec.ind. | .18 | .37 | 71 | |
| logXsp.ind. | .30 | .15 | 71 | |
| logXNH | .35 | .46 | 71 | |
| Yes | logT90 | 1.43 | .64 | 33 |
| logFluence | 1.12 | .60 | 33 | |
| logPeak | .28 | .45 | 33 | |
| logXflux | 1.26 | 1.13 | 33 | |
| logXdec.ind. | .14 | .33 | 33 | |
| logXsp.ind. | .28 | .13 | 33 | |
| logXNH | .12 | .47 | 33 | |
| Total | logT90 | 1.43 | .66 | 104 |
| logFluence | 1.02 | .62 | 104 | |
| logPeak | .15 | .43 | 104 | |
| logXflux | 1.20 | 1.25 | 104 | |
| logXdec.ind | .17 | .36 | 104 | |
| logXsp.ind. | .30 | .14 | 104 | |
| logXNH | .11 | .46 | 104 |
4 Test of significance
In Table 2 we compared the means of the variables in the analysis within the groups. We marked with bold face the peak flux and Hydrogen column density, where the differences in the group means are significant. is the test variable denoting the ratio of the variances between and within the groups.
| Variable | F value | Significance |
|---|---|---|
| logT90 | .000 | .987 |
| logFluence | 1.057 | .306 |
| logPeak | 4.616 | .034 |
| logXflux | .103 | .749 |
| logXdec.ind. | .248 | .619 |
| logXsp.ind. | .702 | .404 |
| logXNH | 5.499 | .021 |
In our case we have two classes. The analysis calculated one variable to discriminate between our two classes. The level of significance of this separation is given in Table 3.
| Test of Function | Wilks’ | Chi-square | degree of freedom | Significance |
|---|---|---|---|---|
| 1 | .880 | 12.877 | 2 | .002 |
5 Conclusions
We performed discriminant analysis in order to look for physical differences between GRBs with or without OT, detected by the Swift satellite. We used the following variables measured by BAT and XRT: T90 Duration, Fluence, 1-sec Peak Photon Flux, Early Flux, Initial Temporal Decay Index, Spectral Index and Column Density (NH).
The analysis demonstrated a significant difference between the groups defined. The difference is significant at the 99.8% level. The difference is driven by two variables: peak flux of the gamma radiation and the Hydrogen column density. This latter quantity is not directly associated to the burst. It rather relates to the environment.
Our result may indicate that the phenomenon of the OT is connected with the interaction of the burst with its environment.
References
- (1) M.G. Kendall & A. Stuart, The Advanced Theory of Statistics, Charles Griffin & Co. Ltd., London & High Wycombe, 1973