ChandraObservation of Quiescent Low-Mass X-ray Binaries in the Globular Cluster NGC 6304
Abstract
This paper presents the analysis of candidate quiescent low-mass X-ray binaries (qLMXBs) observed during a short Chandra/ACIS observation of the globular cluster (GC) NGC 6304. Two out of the three candidate qLMXBs of this cluster, XMMU 171433292747 and XMMU 171421292917, lie within the field of view. This permits comparison with the discovery observation of these sources. The one in the GC core – XMMU 171433292747 – is spatially resolved into two separate X-ray sources, one of which is consistent with a pure H-atmosphere qLMXB, and the other is an X-ray power-law spectrum source. These two spectral components separately account for those observed from XMMU 171433292747 in its discovery observation. We find that the observed flux and spectral parameters of the H-atmosphere spectral components are consistent with the previous observation, as expected from a qLMXB powered by deep crustal heating. XMMU 171421292917 also has neutron star atmosphere spectral parameters consistent with those in the XMM-Newton observation and the observed flux has decreased by a factor .
Subject headings:
stars: neutron — X-rays: binaries — globular clusters: individual (NGC 6304)1. Introduction
The faint emission of transiently accreting low-mass X-ray binaries in quiescence (qLMXBs) found in globular clusters (GCs) is often used to measure the radii of neutron stars (NSs). Such measurements, free of large uncertainties caused by unknown distances and atmospheric composition, can provide useful constraints on the nuclear dense matter equation of state (EoS) relating pressure and density when matter has a density above , such as can occur in atomic nuclei, and in the interiors of NSs (Lattimer & Prakash, 2004). Obtaining precise constraints on the dense matter EoS is the observational motivation for NS radii measurements, requiring at least a accuracy to be useful (Lattimer & Prakash, 2004).
The expected overabundance of LMXBs in GCs (Hut et al., 1992) has motivated observations with the current generation of X-ray telescopes. It was then empirically shown that the NS binaries population in GC depends on the interaction rate of the cluster (Gendre et al., 2003; Heinke et al., 2003b; Pooley et al., 2003). Several qLMXBs were discovered close to the cores of the GCs (for example, Rutledge et al., 2002a). In most cases, they were spectrally identified based on their spectra consistent with a NS atmosphere at the distance of their host cluster. The known distances to the clusters and the known values of the absorption led to precise NS radii measurements ( uncertainty, Rutledge et al., 2002a; Gendre et al., 2003; Heinke et al., 2003a). However, only a handful of confirmed GC qLMXBs are known, and finding more of those objects necessitates careful X-ray observations of GCs. Finally, the X-ray luminosity qLMXBs is not expected to show variability on years timescales (Brown et al., 1998; Ushomirsky & Rutledge, 2001), but long-term flux variation have been observed before (Rutledge et al., 2002b). A more complete introduction about qLMXBs and an exhaustive list of GC qLMXBs can be found elsewhere (Guillot et al., 2009, G09 hereafter).
Regarding the observations of GCs, the two X-ray telescopes XMM-Newton and Chandra are complementary. On the one hand, the typical luminosity of qLMXBs () and the typical distances to GCs require the effective area of XMM-Newton to collect high signal-to-noise ratio (S/N) data for spectral analyses, within modest integration times. On the other hand, Chandra’s angular resolution permits spatial resolution of adjacent sources in cores of GC, which XMM-Newton is not able to differentiate otherwise.
We present here a comparative analysis of an archived Chandra observation of NGC 6304, with the results of the XMM-Newton data reported earlier this year. The sole focus of this paper is the analysis of the previously reported qLMXBs (G09). Two out of the three identified candidate qLMXBs lie within the field of view of this observation: XMMU 171433292747 and XMMU 171421292917. In Section 2, we describe the observation, data reduction, source detection, and approach for the spectral analysis of these two sources. Section 3 contains the actual analysis, with positional and spectral comparisons. Section 4 includes a discussion and a short conclusion.
2. Data Reduction and Analysis
2.1. Observation and Data Reduction
We analyzed here an archived Chandra observation of NGC 6304 (Table 1). The CIAO V4.1.1 (Fruscione et al., 2006) package is used for the source detection and data analysis. The pre-processed event file (level 2) is analyzed including events in the 0.5–8.0 range. The data are checked for flares and none are found. The low luminosity of X-ray sources in this GC allows us to safely neglect pile-up; the brightest source, accounting for counts in total, corresponds to a pile-up fraction of less than 1%111Chandra Observatory Proposer Guide, chap. 6, v11.0, January 2009.
| Parameters of the Observation | |
|---|---|
| Obs. ID | 8952 |
| Starting time | 2008 Jan. 28 18:10:38 (TT) |
| Exposure time | 5262 |
| Detector | ACIS-S3 (BI) |
| Frame rate | 3.1410 |
The source detection is performed with the wavdetect algorithm, treating each ACIS chip separately, using the following parameters: an exposure threshold expthresh = 0.1 and the wavelet scales scales = “1.0 2.0 4.0 8.0”. Six sources (with significance ) are detected on the ACIS-S3, plus a low-significance () source, located in the core of NGC 6304. Eight other sources () are found on other operative chips (two on ACIS-I3, two on the edges of ACIS-S1, three on ACIS-S2 and one on ACIS-S4). Also, we perform the detection over two narrower energy ranges: 0.5–2 and 2–8. In the 0.5-2 data, we detect in the GC core no additional source with significance greater than . In the 2–8 data, only source C09 is detected in the core with significance.
For comparison, the detection is also performed on the full 0.5–8 using the exposure map (created with mkexpmap following the analysis thread “Single Chip ACIS Exposure Map”). Similar detections are obtained, except for a few minor differences: the two sources located near the edges of ACIS-S1 are not detected, suggesting that they are false detections. The low-significance source (), detected in the core of the GC, on ACIS-S3, is not found with this detection method. Other than these differences, the two detection runs found the same sources. The statistical positional uncertainties obtained with the previous detection run (without the exposure map) are smaller than that obtained when the exposure map is used. In consequence, the results with the smallest statistical uncertainties (detection without the exposure map) are presented and used. Table 2 shows the results of the source detection for the sources of interest of this paper. The uncertainty in the source positions is the quadratic sum of the statistical uncertainty () and the systematic positional uncertainty of for Chandra 222From the Chandra Calibration web page available at http://cxc.arvard.edu/cal/.
2.2. Source Extraction and Spectral Analysis
The focus of this paper is the confirmation of the detection of the qLMXBs in the field of the GC NGC 6304. Therefore, the analysis presented afterward pertain solely to the two discovered qLMXBs (G09) that lie in the field of view of this Chandra observation.
The script psextract, together with the calibration files from CALDB v4.1 (Graessle et al., 2007, containing the latest effective area maps, quantum efficiency maps and gain maps), is used to extract the counts of the X-ray sources, in the energy range 0.5–8.0. In all cases, the extraction region is chosen so that more than 90% of the energy is included (encircled count fraction 333The extraction radii are determined using the webtool available at: http://cxc.harvard.edu/cgi-bin/build_viewer.cgi?psf). For sources at small off-axis angle, i.e., sources in the core of the cluster, the circular extraction region of radius 2.5′′ around a source comprises more than 95% of the source energy444Chandra Observatory Proposer Guide, chap. 6, v11.0, January 2009.
Since this observation was performed with the ACIS-S instrument and a focal plane temperature of -120, the response matrices files (RMF) have to be recalculated, according to the recommendations of the CIAO Science Thread “Creating ACIS RMFs with mkacisrmf”. It is also crucial to recalculate the ancillary response file (ARF) using the new RMFs in order to match the energy grids between the RMF and ARF files.
Due to the low count statistic in this observation, the spectra are left unbinned, and the Cash-statistic (Cash, 1979) permits to find the best-fit parameters, assuming the fitted model is correct, using the software XSPEC v12.3 (Arnaud, 1996). The NS atmosphere model used here is a tabulated model similar to the XSPEC model nsa (Zavlin et al., 1996), but without the hard limits on the projected radius imposed by the nsa model. The results of the spectral fits are listed in Table 3.
3. Comparison with the XMM-Newton Observation
3.1. In the core of NGC 6304 -
XMMU 171433292747
This object was the sole source discovered with XMM-Newton in the core of NGC 6304 (G09), and was classified as a qLMXB based on its X-ray spectrum. It was composed of two components: an H-atmosphere neutron star spectrum at the distance of NGC 6304, and a hard power-law component which dominates the spectrum at high energies. A marginal positional offset between the thermal source (candidate qLMXB) detected on a soft image () and a harder source (power-law component) detected on a hard image () of the XMM-Newton data tentatively suggested that the two spectral components are due to distinct point sources (G09).
It is shown in the following subsections that the XMM-Newton source XMMU 171433292747 is resolved, spatially and spectrally, into two sources detected with Chandra.
3.1.1 Positional analysis
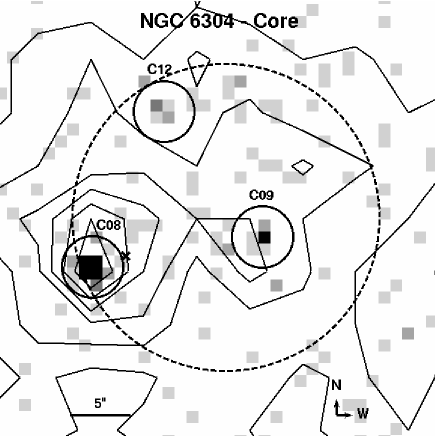
In Figure 1, two sources, CXOU J171432.93292748.0 and CXOU J171431.86292745.5, are detected () within the core radius of NGC 6304, separated by an angular distance of . The brightest one – CXOU J171432.93292748.0, accounting for 74 counts (including about two background counts) – is positionally consistent with the candidate qLMXB XMMU 171433292747, within . The relative offset between the XMM-Newton and Chandra positions of the source is 2.9′′1.6′′; the error on the XMM-Newton astrometry (statistical and systematic errors) accounts for 1.5′′ (). Since XMM-Newton cannot resolve the two sources in the core, the centroid position obtained with wavdetect is in between the two sources detected with Chandra/ACIS (Figure 1).
3.1.2 Spectral characterization and flux calculation of CXOU J171432.93292748.0 and CXOU J171431.86292745.5
As mentioned above, the extracted events are left unbinned and the spectrum is fitted with the assumed model, including a 3% systematic uncertainty, and the confidence regions are derived using the Cash-statistic (Cash, 1979). The galactic absorption (hydrogen column density, ) is kept fixed at the value in the direction of NGC 6304: ( afterward). The derived best-fit parameters and confidence regions (Table 3) are compared to the previously reported values (G09).
The source CXOU J171432.93292748.0 is spectrally soft with all events having energies below 2.5. It is assumed to correspond to the qLMXB XMMU 171433292747, and therefore a NS hydrogen atmosphere model is used for the spectral fitting.
For this X-ray source – the only one in this observation – the number of counts allows for spectral binning ( counts per bins), while having an acceptably approximate Gaussian uncertainty in each bin. The chosen background is a circular region of 1′ around the core, excluding 5′′ () around each detected source. A 5-bin spectra is obtained in the 0.5-8.0 range. The model used is the tabulated model of NS hydrogen atmosphere (Zavlin et al., 1996), together with fixed . The best-fit parameters of this -fit are: and . Although the counting statistic is poor, the best-fit values are in agreement with the previous results, and the model fitted is statistically acceptable (/dof (prob.) = 0.12/3 (0.95)). For completeness, the spectrum is fitted with an absorbed power law, leading to a best-fit photon index with /dof (prob.) = 1.3/3 (0.27), which indicates a soft source, as expected for a typical qLMXB. This provides further support to the argument that CXOU J171432.93292748.0 is the qLMXB detect in XMMU 171433292747. In Table 3, we report best-fit values determined using not the statistic with binned data, but the Cash-statistic using unbinned data, which typically produces smaller error regions. The results of Monte Carlo “goodness-of-fit” simulation are also given in this table.
| Object Name | ID | Counts | XMM Name | XMM ID | ||
|---|---|---|---|---|---|---|
| CXOU J171432.93292748.0 | C08 (core) | 0.080.08 | 24.2 | 72 | XMMU 171433292747 | #04 |
| CXOU J171431.86292745.5 | C09 (core) | 0.170.12 | 7.05 | 16 | XMMU 171433292747 | #04 |
| CXOU J171420.88292916.1 | C07 | 0.190.15 | 6.4 | 16 | XMMU 171421292917 | #05 |
| CXOU J171432.48393735.3 | C12 (core) | 0.270.17 | 2.3 | 5 | XMMU 171433292747 | #04 |
Note. — and are the statistical uncertainties from the source detection, in seconds of arc. Systematic position uncertainties consist of an additional error of 0.6′′ (90% confidence, see Section 2.1). The column “counts” reports the background subtracted number of counts for each source, in the range 0.5–8. Finally, represents the significance of the source detection.
The best-fit H-atmosphere parameters for CXOU J171432.93292748.0 are consistent with typical values for quiescent NSs (G09, Table 4 for exhaustive listing of known GC qLMXBs), and with the best-fit values obtained with XMM-Newton (G09). The unabsorbed flux (0.5–10) is also consistent with the flux of the thermal component of the XMM-Newton observation (as will be demonstrated statistically below), estimated to be 51% of the total flux (G09), the other 49% being the contribution of the power-law component.
The second source in the core, CXOU J171431.86292745.5 (18 counts including about two background counts), appears spectrally harder, as it has only seven counts below 2, two counts in the 2.0–3.0 energy range, and the rest (nine events) above 3. The spectrum is fitted with an absorbed power law, to compare it to the power-law component fitted in the spectrum of XMMU 171433292747. The best-fit photon index is consistent with the hard power-law component for the source XMMU 171433292747. For completeness, the spectrum is fitted with a NS atmosphere model, for which the best-fit projected radius is inconsistent with the typical radii of NSs. The goodness of this fit (99.9% of Monte Carlo simulations from the NS atmosphere model give better statistics than the best fit) suggests that the spectrum is not that of a NS H-atmosphere model. These results provide further support that this source is not the candidate qLMXB, but another source of unknown classification.
As a last check of statistical consistency, a simultaneous fit is performed using the XMM/pn, XMM/MOS1, XMM/MOS2 for XMMU 171433292747 and Chandra/ACIS spectra for both CXOU J171432.93292748.0 and CXOU J171431.86292745.5. While fitting, the temperature, the radius and the photon index parameters of each individual data set are kept tied together and is kept fixed at the value cited above. The results are also shown in Table 3, as a simultaneous fit for XMMU 171433292747. Again, the fit is statistically acceptable, /dof (prob.) = 0.76/42 (0.86), and the obtained best-fit parameters are in agreement with typical values for accreting quiescent NS.
To characterize the variation in flux for the qLMXB, we performed a simultaneous spectral fitting using the EPIC/pn data alone for XMMU 171433292747 and with the ACIS-S data for CXOU J171432.93292748.0 and CXOU J171431.86292745.5; a multiplicative factor for the spectral normalization is used, fixed at 1 for the XMM-Newton/pn spectrum and left as a free parameter for the Chandra/ACIS spectrum. The best-fit factor is (90% confidence), which is marginally consistent with the fluxes being the same.
We therefore conclude that XMMU 171433292747, observed previously in the core of NGC 6304 (G09), is a composite of CXOU J171432.93292748.0 and CXOU J171431.86292745.5, which were not distinguishable at the resolution of XMM-Newton, but which are spatially resolved at the resolution of Chandra.
3.2. Outside the core of NGC 6304 -
XMMU 171421292917
The low signal-to-noise candidate qLMXB XMMU 171421292917 reported in the XMM-Newton analysis (G09) is also detected on the Chandra/ACIS observation as CXOU J171420.88292916.1. An offset of 1.15′′1.6′′ is measured between the Chandra/ACIS and the XMM-Newton observations, consistent within . The Chandra source position is located 0.9′′0.6′′ from the possible Two-Micron All Sky Survey (2MASS) counterpart reported 2MASS 171420952929163 (G09). This offset is consistent () with the two sources (CXOU J171420.88292916.1 and 2MASS 171420952929163) being associated where the uncertainty is due to Chandra’s systematic and statistical uncertainties; the error on the 2MASS position is assumed to be negligible. Also, the probability that another source as bright or brighter lies as close or closer to the X-ray positions is 0.34%, providing further support to the association, with 99.66% confidence.
This X-ray source, CXOU J171420.88292916.1, is located off-axis and requires a 3′′-radius extraction region. The source has 19 counts (including about three background counts) and is also fitted, using Cash-statistic, with a NS atmosphere model, keeping fixed. The best-fit parameters are consistent with the previously published values (Table 3).
A simultaneous fitting is also performed for this candidate qLMXB, using the XMM-Newton and Chandra spectra. The Chandra/ACIS spectrum has only one bin, containing 19 counts. The fit is statistically acceptable (using statistics) and the best-fit parameters are consistent with those published elsewhere (G09).
Using the same method as described in Section 3.1, the simultaneous fitting with a multiplication factor suggests that the flux has changed between the XMM-Newton observation and the Chandra/ACIS observation. Indeed, as the factor mentioned is fixed to 1 for the pn spectrum, the best-fit factor is (90%) for the ACIS spectrum. Higher signal-to-noise data will permit confirmation of the apparent variability in the flux of this candidate qLMXB.
| ID | /d.o.f. (prob.) | |||||
|---|---|---|---|---|---|---|
| (eV) | (km) | |||||
| CXOU J171432.93292748.0 | (0.266) | 127 | 7.5 | 1.14 | Goodness: 35.0% | |
| ” | (0.266) | 3.5 | Goodness: 9.3% | |||
| CXOU J171431.86292745.5 | (0.266) | 0.8 | 0.72 | Goodness: 76.2% | ||
| ” | (0.266) | Goodness: 99.9% | ||||
| CXOU J171420.88292916.1 | (0.266) | 89 | 9.3 | 0.32 | Goodness: 77.2% | |
| CXOU J171432.48393735.3aaThis low-significance source (C12) is given for information purposes due to its proximity to the candidate qLMXB in the core. The flux is estimated using webPIMMS, assuming a power law of photon index . | (0.266) | (2) | 0.15 | webPIMMS | ||
| Spectral results from G09 | ||||||
| XMMU 171433292747 | (0.266) | 122 | 11.6 | 1.2 | 2.3 | 0.85/42 (0.75) |
| XMMU 171421292917 | (0.266) | 70 | 23 | 0.6 | 1.09/16 (0.36) | |
| Simultaneous fitting with XMM/EPIC and Chandra/ACIS spectra | ||||||
| XMMU 171433292747 | (0.266) | 123 | 7.9 | 0.3 | 2.0–3.2 bbEach component of the simultaneous fitting has its own estimated model flux. The range is given here. | 0.76/42 (0.86) |
| XMMU 171421292917 | (0.266) | 65 | 30 | 0.36–0.66 bbEach component of the simultaneous fitting has its own estimated model flux. The range is given here. | 1.11/22 (0.33) | |
Note. — This table presents the spectral results of the applied model: NS atmosphere or power law, for which the parameters are quoted: and or photon index , respectively. The unabsorbed flux is expressed in units of (0.5–10), and the errors are estimated using the XSPEC convolution model cflux. In all cases, the absorption, , is kept fixed at the value . ”Goodness” indicates that the fit was performed with Cash-statistic and the results of Monte Carlo simulations of the goodness of fit are provided. A percentage close to 50% suggests a good fit while extreme values indicate poor fits.
4. Discussion and Conclusions
We have performed the spectral analysis of two candidate qLMXBs in NGC 6304 – XMMU 171433292747 and XMMU 171421292917 – detected on a 5.2 Chandra/ACIS observation. The third reported candidate qLMXB was outside of the field of view of telescope. As suggested previously, the candidate XMMU 171433292747 is resolved into two X-ray sources: CXOU J171432.93292748.0, a bright () thermal source and CXOU J171431.86292745.5, a second fainter harder source of unknown classification. The spectrum of the CXOU J171432.93292748.0 was fitted with a NS atmosphere model at the distance of NGC 6304 and the best-fit parameters are consistent with the parameters obtained from the fit of the XMM-Newton data (G09). The spectrum of CXOU J171431.86292745.5 was fitted with a simple absorbed power-law and the photon index is consistent with the best-fit index of the power-law component from the XMM-Newton fit (G09). The low count statistics did not permit for a thorough verification of the models using the -statistic, but a simultaneous fit of the candidate qLMXB spectrum (XMM-Newton and Chandra) showed that the observed flux and spectral parameters of CXOU J171432.93292748.0 and CXOU J171431.86292745.5 combined are consistent with those of the previously observed XMMU 171433292747.
The photon index of CXOU J171431.86292745.5 is consistent with typical photon indices of cataclysmic variables (CVs; Richman, 1996). A deeper exposure will be required to attempt a more precise spectral fitting, using thermal bremsstrahlung model for example, and confirm the possible CV classification of this faint source.
Another candidate qLMXB, XMMU 171421292917, was also observed in the field of view and was named CXOU J171420.88292916.1. The Cash-statistic fit of the source spectra provided best-fit parameters that were consistent with the values previously reported. The unabsorbed flux (0.5-10 keV) during the more recent Chandra observation, however, was a factor (90% confidence) lower. This is significantly lower than the previously observed flux, and calls into question the classification of this X-ray source as an H-atmosphere qLMXB, since such strong variability is not expected on years timescales, unless a protracted (years) long outburst (e.g., ) ended recently (1 yr) (Rutledge et al., 2002c; Brown & Cumming, 2009); there is no evidence supporting this scenario in the present case.
Finally, the improved Chandra astrometry permitted us to verify the association of the X-ray source with its possible counterpart 2MASS 171420952929163 with a probability of association of 99.66%.
Overall, the Chandra observatory allowed to resolve, both spatially and spectrally, the single source in the core, XMMU 171433292747, into two sources, one of them being the candidate qLMXB. The second observed candidate qLMXB, XMMU 171421292917, showed consistent best-fit H-atmosphere parameters, but also exhibit a significant decrease in its flux, which is not expected for qLMXBs. A longer exposure will permit us to assert with better certitude the spectral classification of the sources in the core of NGC 6304 and the other candidate qLMXB.
References
- Arnaud (1996) Arnaud, K. A. 1996, in Astronomical Society of the Pacific Conference Series, Vol. 101, Astronomical Data Analysis Software and Systems V, ed. G. H. Jacoby & J. Barnes, 17–+
- Brown et al. (1998) Brown, E. F., Bildsten, L., & Rutledge, R. E. 1998, ApJ, 504, L95+
- Brown & Cumming (2009) Brown, E. F. & Cumming, A. 2009, ArXiv e-prints
- Cash (1979) Cash, W. 1979, ApJ, 228, 939
- Fruscione et al. (2006) Fruscione, A. et al. 2006, in Society of Photo-Optical Instrumentation Engineers (SPIE) Conference Series, Vol. 6270, Society of Photo-Optical Instrumentation Engineers (SPIE) Conference Series
- Gendre et al. (2003) Gendre, B., Barret, D., & Webb, N. 2003, A&A, 403, L11
- Graessle et al. (2007) Graessle, D. E., Evans, I. N., Glotfelty, K., He, X. H., Evans, J. D., Rots, A. H., Fabbiano, G., & Brissenden, R. J. 2007, Chandra News, 14, 33
- Guillot et al. (2009) Guillot, S., Rutledge, R. E., Bildsten, L., Brown, E. F., Pavlov, G. G., & Zavlin, V. E. 2009, MNRAS, 392, 665
- Harris (1996) Harris, W. E. 1996, AJ, 112, 1487
- Heinke et al. (2003a) Heinke, C. O., Grindlay, J. E., Edmonds, P. D., Lloyd, D. A., Murray, S. S., Cohn, H. N., & Lugger, P. M. 2003a, ApJ, 598, 516
- Heinke et al. (2003b) Heinke, C. O., Grindlay, J. E., Lugger, P. M., Cohn, H. N., Edmonds, P. D., Lloyd, D. A., & Cool, A. M. 2003b, ApJ, 598, 501
- Hut et al. (1992) Hut, P. et al. 1992, PASP, 104, 981
- Lattimer & Prakash (2004) Lattimer, J. M. & Prakash, M. 2004, Science, 304, 536
- Pooley et al. (2003) Pooley, D. et al. 2003, ApJ, 591, L131
- Richman (1996) Richman, H. R. 1996, ApJ, 462, 404
- Rutledge et al. (2002a) Rutledge, R. E., Bildsten, L., Brown, E. F., Pavlov, G. G., & Zavlin, V. E. 2002a, ApJ, 578, 405
- Rutledge et al. (2002b) — 2002b, ApJ, 577, 346
- Rutledge et al. (2002c) Rutledge, R. E., Bildsten, L., Brown, E. F., Pavlov, G. G., Zavlin, V. E., & Ushomirsky, G. 2002c, ApJ, 580, 413
- Ushomirsky & Rutledge (2001) Ushomirsky, G. & Rutledge, R. E. 2001, MNRAS, 325, 1157
- Zavlin et al. (1996) Zavlin, V. E., Pavlov, G. G., & Shibanov, Y. A. 1996, A&A, 315, 141