Evolution of the Lyman- Halos around High-Redshift Radio Galaxies
Abstract
We have obtained the first constraints on extended Ly emission at in a sample of five radio galaxies. We detect Ly emission from four of the five galaxies. The Ly luminosities range from erg s-1 and are much smaller than those observed for halos around higher redshift radio galaxies. If the radio galaxies are the descendents the radio galaxies, then their Ly luminosities evolve strongly with redshift as . There do not appear to be strong correlations between other parameters, such as radio power, suggesting that this observed evolution is real and not an observational artifact or secondary correlation. We speculate that this evolution of luminous halos may be due to gas depletion (as gas cools, settles, and forms stars) accompanied by an overall rise in the mean gas temperature and a decrease in specifc star-formation rate in and around these massive galaxies.
Subject headings:
galaxies: evolution — galaxies: individual (3C 210, 3C 265, 3C 266, 3C 267, 3C 324)1. Introduction
The bright end of the luminosity function is dominated today by giant elliptical and cD galaxies. The history of these massive galaxies traces the evolution of the highest peaks in the initial density perturbation spectrum, and thus potentially places strong constraints on paradigms of structure formation. The host galaxies of high-redshift radio galaxies (; HzRGs) are likely the progenitors of these modern-day giants: the HzRG –band Hubble diagram is well–fit by the ‘passive’ evolution of a stellar population with a high formation redshift (e.g., McCarthy, 1993; De Breuck et al., 2002), and NICMOS continuum images of 3CR radio galaxies show that the starlight distributions are round and symmetric, mostly with –law light profiles (Zirm et al., 1999, 2003). Furthermore, the inferred stellar masses derived from modelling of the spectral energy distributions (SEDs), including data from the Spitzer Space Telescope, define the upper envelope of the mass function for all high redshift galaxies (Seymour et al., 2007). In addition, age dating studies of a few HzRGs suggests that they formed the bulk of their stars at significantly higher redshifts, , and evolved fairly ‘passively’ thereafter (Stockton, Kellogg, & Ridgway, 1995; Dunlop et al., 1996; Spinrad et al., 1997). Finally, radio galaxies at are generally found in overdense, protocluster, environments (e.g., Venemans et al., 2007; Kodama et al., 2007; Zirm et al., 2008) again consistent with them marking high density peaks in the dark matter field.
Many of the radio galaxies, including those within protocluster regions, are surrounded by giant ( kpc) halos (McCarthy et al., 1990; McCarthy, Spinrad, & van Breugel, 1995; Dey et al., 1997; Villar-Martín et al., 1999; Reuland et al., 2003). These halos have line luminosities of several , and suggest the presence of huge gas reservoirs. Initially these halos were thought to be associated only with, and perhaps powered by, rare, luminous radio galaxies. However, the discovery by Steidel et al. (2000) of two giant “blobs” associated with a galaxy overdensity at and only loosely associated with any galaxies with detectable UV continuum suggest that Ly halos may be relevant to the formation of the most massive galaxies in general. Subsequent deep imaging and spectroscopy of this same protocluster field identified many lower luminosity, radio-quiet, spatially-extended emitters (Matsuda et al., 2004; Saito et al., 2008).
The origins of the emitting gas remain ambiguous. Monolithic cooling of pristine, infalling gas would have an extremely short lifetime ( yrs; e.g., Dey et al. 2005) and could not explain the prevalence of the halo phenomenon. However, if the ionized gas reservoirs were replenished via further infall and/or outflows from the central source the ‘monolithic’ scenario may still be viable. If we assume that the halos are formed by a mixture of inflow and outflow, the morphology and evolution of the emission should provide clues to the nature of that mix and by extension the galaxy formation process. Another possibility is that each Hydrogen atom is ionized more than once on average.
Little is known about how these halos evolve with redshift. As the host galaxy and radio source age spectrally and dynamically, the interaction between the halo and its embedded sources may alter in form. Between and , the host galaxy is largely assembled as a mature giant elliptical, and a hot young stellar population is no more than a minor contributor to the total UV flux (e.g., Zirm, Dickinson, & Dey, 2003). The central ionization source may shift from being dominated by young stars and starburst outflows to being dominated by the interaction with the radio source and photoionization by the central engine. Understanding the connection between young radio galaxies at and the more mature objects at requires similar data at all redshifts, including measurements of their emission line properties. Moreover, studies of the same emission lines at similar sensitivity can distinguish genuine evolutionary trends from the consequences of line choice or instrumental limitations.
| Galaxy | RA | Dec | NUV Prism | NUV Direct | Line Flux | Line Luminosity | |
|---|---|---|---|---|---|---|---|
| (J2000) | (J2000) | Exp. Time (s) | Exp. Time (s) | erg s-1 cm-2 | erg s-1 | ||
| 3C 210 | 1.17 | 08:58:09.9 | 27:50:52 | 2757 | 260 | ||
| 3C 265 | 0.81 | 11:45:29.0 | 31:33:49 | 1330 | 360 | ||
| 3C 266 | 1.28 | 11:45:43.4 | 49:46:08 | 5260 | 360 | ||
| 3C 267 | 1.14 | 11:49:56.5 | 12:47:19 | 2709 | 240 | ||
| 3C 324 | 1.21 | 15:49:48.9 | 21:25:38 | 3474 | 360 |
In this paper, we present Ly measurements of 5 radio galaxies at obtained using the slitless prism mode with STIS on HST. This article is organized as follows: we present the observations and data reduction in the next section (§ 2), the results in Section 3, a discussion of these results in the context of theories of galaxy formation in Section 4 and finally a brief summary of our conclusions in Section 5. Throughout this paper we assume a cosmological model with and and km s-1 Mpc-1.
2. Observations
We used the Space Telescope Imaging Spectrograph (STIS) on-board the Hubble Space Telescope during 20 December 2001 - 12 April 2003 to image 5 high-redshift radio galaxies lying in the range (GO#9166; PI A. Zirm). The target galaxies are selected from the 3CR catalog (Bennett, 1962) and all are known to have strong nebular line emission based on their optical spectra. At the redshift of the target galaxies, the line falls in the near-ultraviolet (NUV) and thus requires space-based observation. Observations were made with the STIS NUV-MAMAs, ultraviolet sensitive array detectors, with the prism, to obtain very low dispersion ( 30Å pixel-1) spectra over the line to produce, effectively, a line image. The extremely dark UV sky background and absence of readout noise in the STIS MAMAs enhance our sensitivity to low surface–brightness emission. Our resultant images have depth comparable to those of objects in a few orbits, with much higher spatial resolution.
The dispersion of the STIS prism mode at redshifted at is pixel-1, sufficiently low that the prism–dispersed will essentially form a monochromatic emission line image, with the galaxy continuum dispersed beneath it. In addition to the slitless prism data we also took direct images using both the NUV-MAMA (which includes ) and the optical CCD to determine the zeropoint for the source spectra. The details of exposure times are listed in Table 1.
We extracted the Lyman- fluxes in a simple manner. Visual inspection of the prism and direct image data show that the 2D spectra are dominated by line emission. The structures observed in the direct image are reproduced when the prism is used rather than being smoothed over larger areas. 3C 265 is the exception where both continuum and the CIV emission line are also visible in the 2D spectrum. However, to model the spectra, even in the case of 3C 265, we have taken a simple power-law continuum with both and (i.e., flat in and respectively). We chose these two extrema based on the empirical range of far-UV slopes observed for both star-forming galaxies (e.g., Meurer, Heckman, & Calzetti, 1999) and AGN (e.g., Vanden Berk et al., 2001; Telfer et al., 2002). We used the tabulated dispersion relation for the prism and the direct NUV image of each galaxy to construct continuum-only models of the prism observations. We thereby assumed that the morphology of the direct image, which includes , is representative of the spatial distribution of continuum flux. These models were scaled and subtracted, to minimize the residuals, to leave only the line emission. We note that the exact details of the continuum-subtraction should not significantly change the results. Lyman- fluxes were then derived by performing photometry in apertures designed to include the residual flux on these continuum-subtracted images and masking the CIV flux in the case of 3C 265. The resulting line fluxes luminosities are listed in Table 1.
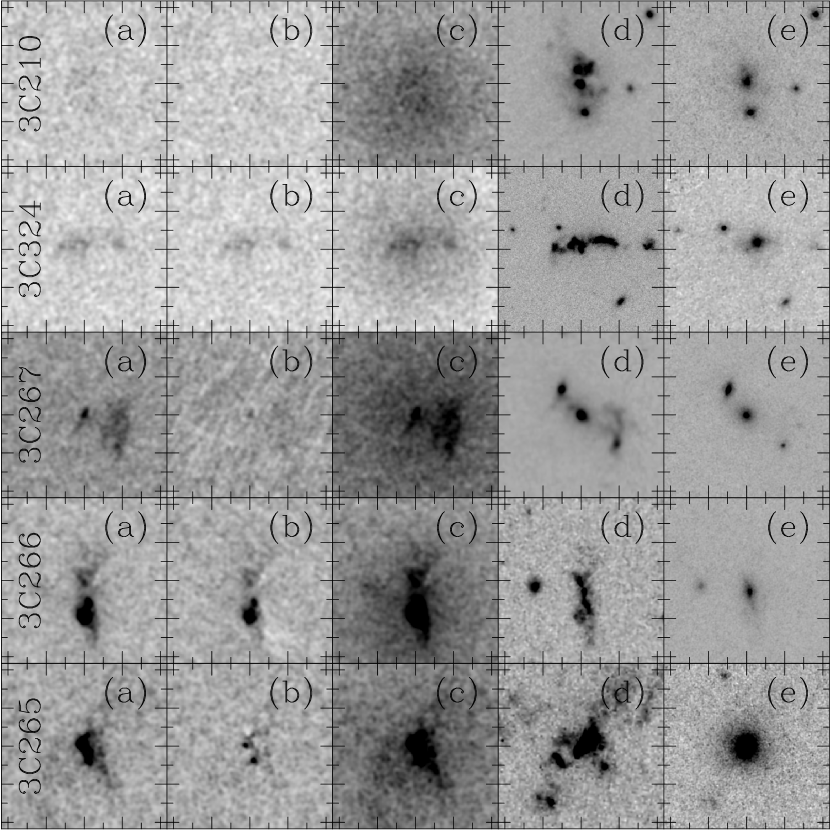
The raw prism data, the continuum subtracted data and the data with a fiducial halo model added are presented in Figure 1. The fiducial model halo has erg s-1 and follows a King model profile with core radius kpc, similar to observations of halos surrounding radio galaxies (e.g., Reuland et al., 2003). The observed optical and near-infrared data are from HST WFPC2 and NICMOS respectively.
3. Results
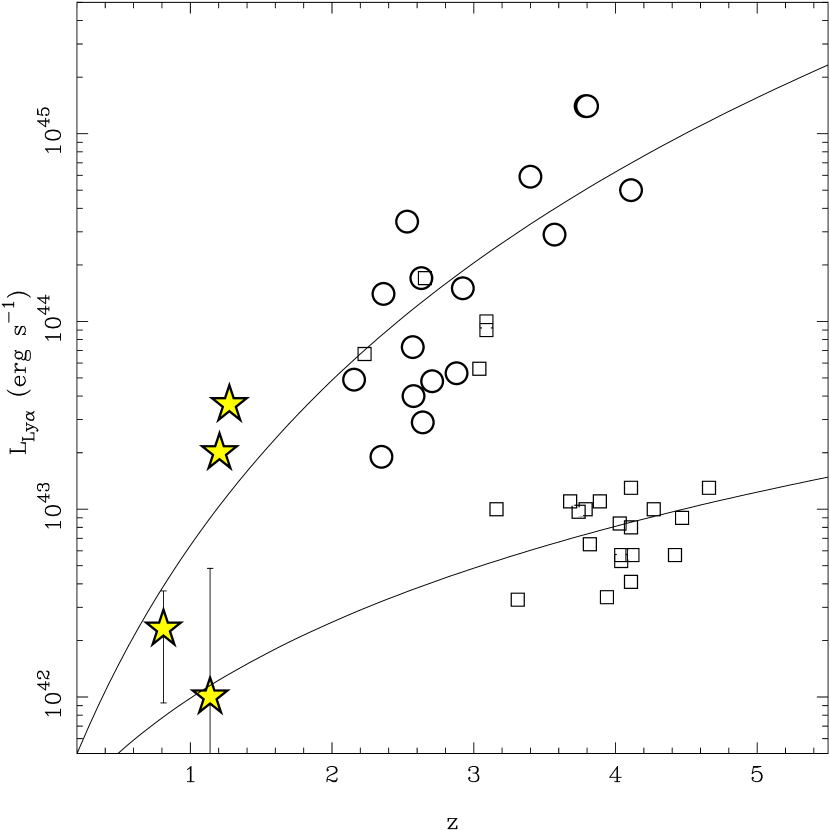
Of the five radio galaxies targeted, four have significant or marginal detections of Lyman- flux. 3C 210 shows no line emission to a limit of erg s-1. Of the four with , two are bright, 3Cs 266 and 324 with and erg s-1 respectively, while 3Cs 267 and 265 are both a factor of ten less luminous (see Table 1). The evolution of the luminosity around powerful radio galaxies with redshift is shown in Figure 2. The stars are the galaxies from the current study while the circles are higher redshift radio galaxies (McCarthy et al., 1990; McCarthy, Spinrad, & van Breugel, 1995; Dey et al., 1997; Reuland et al., 2003; Villar-Martín et al., 2003; Zirm et al., 2005; Venemans et al., 2007; Villar-Martín et al., 2007) and the squares are radio-quiet extended emitters (‘blobs’; Steidel et al., 2000; Matsuda et al., 2004). The solid lines are ‘by eye’ power law evolution models with where and . The radial extent of these halos are about a factor of two smaller than the high-redshift halos. There is no similarly strong redshift correlation with radio power or stellar mass of the radio host for HzRGs in general (see Seymour et al. 2007). In any case, it is clear that the kpc, erg s-1 halos generally seen around powerful radio galaxies at are not present around their counterparts (which are not necessarily their descendents) at .
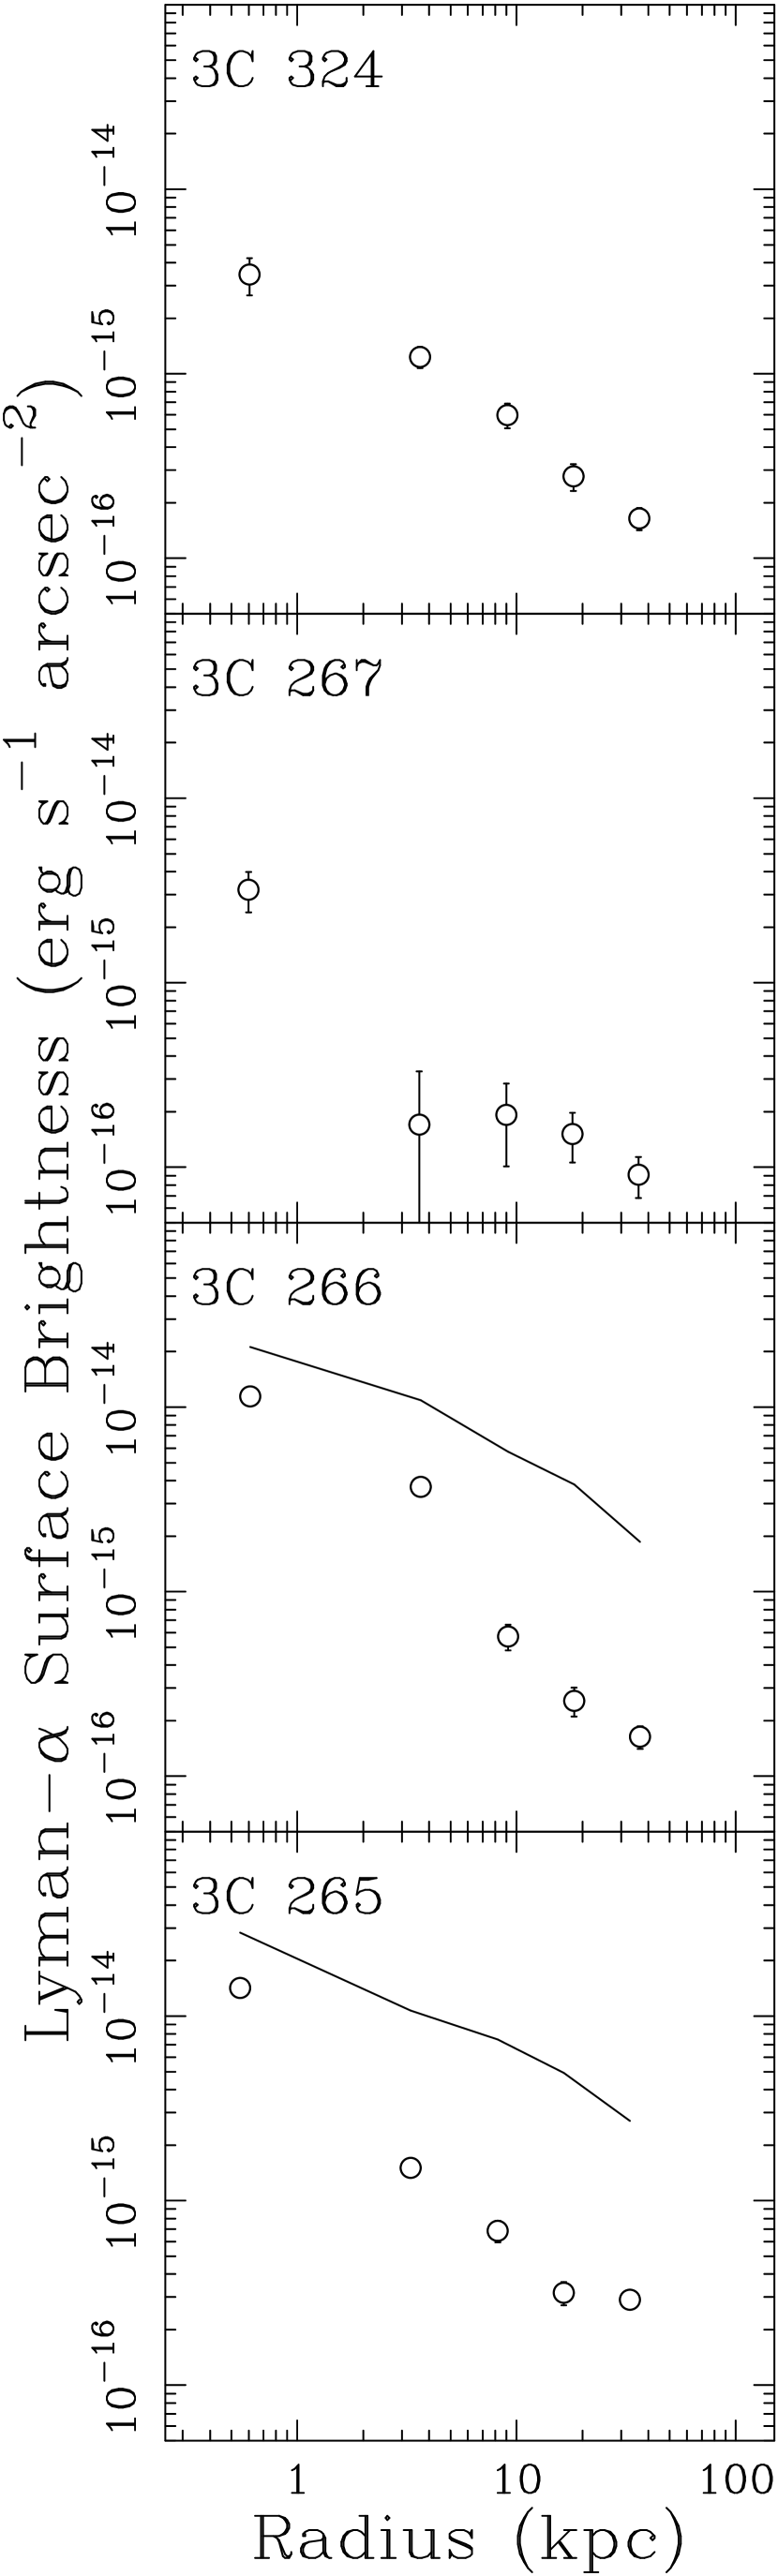
At least two of the radio galaxies (3C 265 and 266) show Ly emission with significant angular extent (Figure 3). For these galaxies, we also plot the fiducial halo model in the same apertures for comparison. In addition to the difference in overall luminosity, the lower redshift halos also appear to have steeper surface-brightness profiles with smaller extent along with some constant surface-brightness emission associated with the UV continuum. The sizes of the detectable line-emitting regions are only tens of kpcs as opposed to the higher-redshift examples with radii close to 100 kpc. More specifically, for the well-detected case of 3C 265, the morphology of the extended line emission seems rather different from the halos seen at high redshift. For the other galaxies, our data are not deep enough to reveal much morphological information. For 3C 265, however, we can see that the extended line emission (panel a in Fig. 1) roughly follows the spatial distribution of the UV continuum (panel d) which is aligned with the double-lobed radio axis, perhaps indicating that this line emission is excited by the AGN. This in contrast to the higher redshift halos which generally show little or no UV continuum associated with the line emission.
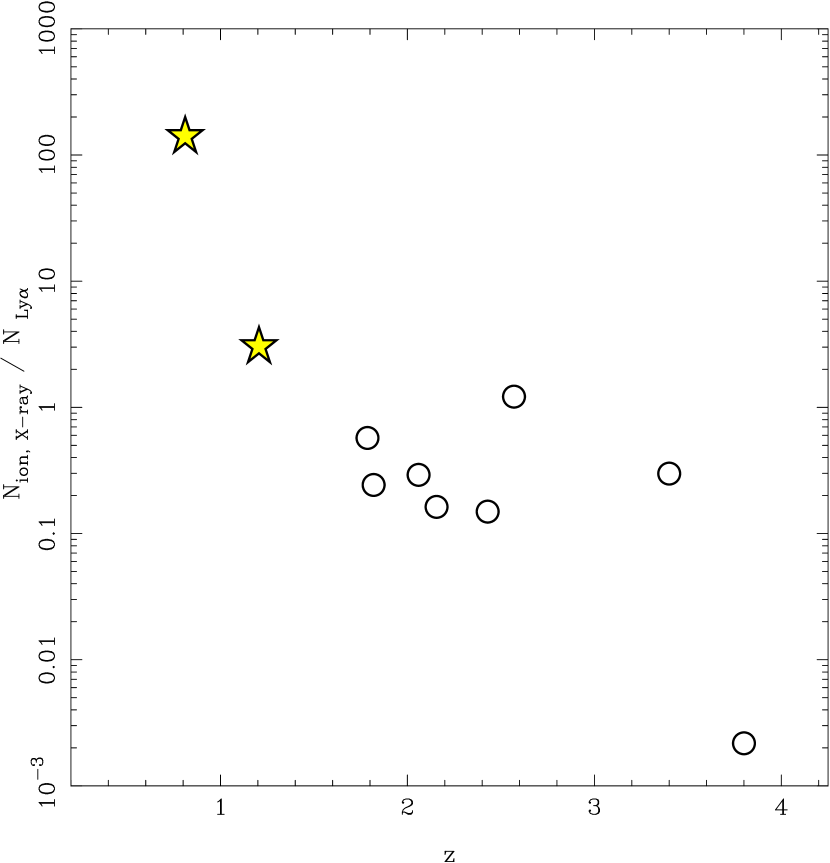
To investigate the energetics of the halos, we have used X-ray core measurements from the literature (Crawford & Fabian, 1996; Hardcastle & Worrall, 1999; Fabian, Crawford, & Iwasawa, 2002; Pentericci et al., 2002; Derry et al., 2003; Fabian et al., 2003; Scharf et al., 2003; Overzier et al., 2005) and Ly- luminosities to make two different estimates of the UV ionizing radiation in the radio galaxy environments. We assume a single ionizing photon results in a single Ly photon. For the X-ray data we assume a single power-law spectrum from the rest-frame X-ray to the UV to estimate the number of ionizing photons due to the AGN. In Figure 4 we show the ratio of the two ionizing luminosities versus redshift. While this plot is a bit sparse and consists of rather heterogeneous datasets, it seems that there may be a trend for the high redshift halos to require a power source beyond the X-ray luminosity while at the X-rays may be sufficient to power the extended line emission. We discuss the implications of this result further in the following section.
4. Discussion
We have presented slitless NUV spectroscopy of five powerful radio galaxies. These spectra show for the first time the considerable redshift evolution of the extended luminosity surrounding powerful radio galaxies. The morphology of the extended line emission also seems to change from a centrally-concentrated halo at high redshift to a more evenly distributed surface-brightness profile at lower redshift associated with the known (extended) UV continuum. The size of the halos are also about a factor of two (at minimum) smaller than the high-redshift examples. These changes together suggest that we may be seeing a change in the dominant process responsible for the line emission as a function of redshift. Furthermore, the lack of similar halos around comparable power radio galaxies, along with the discoveries of radio-quiet halos, implies that halos are not solely a feature of radio galaxies but may be associated more generally with galaxy and structure formation.
By making observations of emission over a range of redshifts we study the evolution of the gaseous environments of massive galaxies where other methods, such as X-ray imaging, are impractical at higher redshifts. The luminosity and structure of the line emitting gas provides clues to the dynamical and excitation states of the gas. We can use simulations to put these observations in context. Dijkstra, Haiman and Spaans (2006a,b) have quantified the relationship between different infall and cooling scenarios and surface brightness using a set of simulations. Their range of initial conditions and assumptions span the gap between two extremes. First, that the cooling timescale is short and tracks the loss of gravitational potential energy as the gas falls into the center after being shock heated at the virial radius (e.g., Haiman, Spaans, & Quataert, 2000). Second, that the gas is accreted cold (i.e., no virial shock heating) and only subsequently its kinetic energy is converted to thermal energy resulting in emission (e.g., Dekel & Birnboim, 2006). These simulations confirm and quantify the intuitive view that the line emission is more centrally-concentrated for the case where heating and cooling only occur once the gas has collapsed to the center and that more extended emission is seen where clumps of gas are assumed to cool as they descend into the gravitational potential. It should be noted, however, that both scenarios produce extended halos of line emission.
In addition to either or both of these infall scenarios the gas may also be ionized by UV-luminous young and forming stars and by the central AGN. For 3C 265, the close correlation between the UV continuum emitting regions and the emission suggests that the ionizing source is low-level star-formation, young stars and photoionization by AGN light in these areas. Our observations indicate that the halo phenomenon as seen at high redshift has changed significantly by . This inference is further supported by our analysis of the energetics of the radio galaxies over the same range of redshift. While at high redshift the virial shocking of infalling gas may dominate the emission it seems that by the X-ray output of the central AGN may be sufficient to ionize the surrounding gas.
Under any scenario, it is clear that the gaseous environments of massive galaxies are subject to several possible changes during the more than three billion years between and . Gas is consumed in star-formation and black hole accretion, it is enriched with metals and deposited back in the IGM via supernovae and AGN-driven outflows and the IGM itself is disrupted and shock-heated via galaxy interactions and mergers. Overall, however, the amount of cool gas surrounding galaxies decreases with cosmic time while elliptical galaxies and galaxy clusters retain vast reservoirs of hot gas. If we associate the high redshift, luminous halos with the initial accretion and starburst, the faint halos at later times suggests that the gas has either been depleted via star formation and accretion or that the cooling time has increased sufficiently to quench infall. Cooling radiation and subsequent star-formation dominates the halo luminosity at high redshift with some additional contribution associated with the AGN. As the gas cools and forms stars the bulk of the line luminosity disappears with only the residual, AGN and star-formation related emission remaining by . This residual emission is over a smaller area (radius kpc) and is associated with the UV continuum emission.
5. Conclusions
We have used STIS NUV–MAMA slitless spectroscopy of five powerful radio galaxies to determine their properties and to specifically look for luminous, extended halos of line emission as are seen around radio galaxies. While we find that at least two of the targets have extended emission line regions it is unclear from these data alone whether this is directly related to the high- halos. The emission line morphologies are rather different and the luminosities are an order-of-magnitude lower than at higher redshift. The physical extent of the halos are smaller by about a factor of two compared to the examples. We have argued that based on the available X-ray data it is likely that the dominant mechanism for producing photons has changed from one related to gas infall and cooling at high redshift to one dominated by photo-ionization by young stars and the AGN by .
Based on these data it is clear that studies of massive galaxies over a range of redshifts will provide clues to the state of the gaseous environment and the history of galaxy feedback in the local IGM. In the scenario of Dekel and Birnboim (Dekel & Birnboim, 2006; Birnboim, Dekel, & Neistein, 2007; Dekel & Birnboim, 2008) there is a transition from a cold accretion regime, in which photons are produced by cooling gas, to a 2-phase medium, where may still be emitted by filamentary ‘cold flows’, and finally to a single hot phase. These transitions occur naturally as a result of the gravitational build-up of structure and the consequent formation of a virial shock. It may therefore be possible to follow this progression via imaging surveys, particularly using high spatial resolution data as we have presented here to study the morphology of the line emission. The state of the emitting gas would provide direct clues to the state of the galaxy formation process and the thermodynamic properties of the gas. This “ calorimeter” could be combined with data from the next generation X-ray and mm/radio telescopes to generate a complete census of the gas in and around massive galaxies from to .
References
- Bennett (1962) Bennett, A. S. 1962, MmRAS, 68, 163
- Birnboim et al. (2007) Birnboim, Y., Dekel, A., & Neistein, E. 2007, MNRAS, 380, 339
- Crawford & Fabian (1996) Crawford, C. S. & Fabian, A. C. 1996, MNRAS, 282, 1483
- De Breuck et al. (2002) De Breuck, C., van Breugel, W., Stanford, S. A., Röttgering, H., Miley, G., & Stern, D. 2002, AJ, 123, 637
- Dekel & Birnboim (2006) Dekel, A. & Birnboim, Y. 2006, MNRAS, 368, 2
- Dekel & Birnboim (2008) Dekel, A. & Birnboim, Y. 2008, MNRAS, 383, 119
- Derry et al. (2003) Derry, P. M., O’Brien, P. T., Reeves, J. N., Ward, M. J., Imanishi, M., & Ueno, S. 2003, MNRAS, 342, L53
- Dey et al. (2005) Dey, A., et al. 2005, ApJ, 629, 654
- Dey et al. (1997) Dey, A., van Breugel, W., Vacca, W. D., & Antonucci, R. 1997, ApJ, 490, 698
- Dijkstra et al. (2006a) Dijkstra, M., Haiman, Z., & Spaans, M. 2006a, ApJ, 649, 14
- Dijkstra et al. (2006b) Dijkstra, M., Haiman, Z., & Spaans, M. 2006b, ApJ, 649, 37
- Dunlop et al. (1996) Dunlop, J., Peacock, J., Spinrad, H., Dey, A., Jimenez, R., Stern, D., & Windhorst, R. 1996, Nature, 381, 581
- Eisenhardt & Dickinson (1992) Eisenhardt, P. & Dickinson, M. 1992, ApJ, 399, 47
- Fabian et al. (2002) Fabian, A. C., Crawford, C. S., & Iwasawa, K. 2002, MNRAS, 331, L57
- Fabian et al. (2003) Fabian, A. C., Sanders, J. S., Crawford, C. S., & Ettori, S. 2003, MNRAS, 341, 729
- Haiman et al. (2000) Haiman, Z., Spaans, M., & Quataert, E. 2000, ApJ, 537, 5
- Hardcastle & Worrall (1999) Hardcastle, M. J. & Worrall, D. M. 1999, MNRAS, 309, 969
- Kodama et al. (2007) Kodama, T., Tanaka, I., Kajisawa, M., Kurk, J., Venemans, B., De Breuck, C., Vernet, J., & Lidman, C. 2007, MNRAS, 377, 1717
- Matsuda et al. (2004) Matsuda, Y., et al. 2004, AJ, 128, 569
- McCarthy (1993) McCarthy, P. J. 1993, ARA&A, 31, 639
- McCarthy et al. (1990) McCarthy, P. J., Spinrad, H., Dickinson, M., van Breugel, W., Liebert, J., Djorgovski, S., & Eisenhardt, P. 1990, ApJ, 365, 487
- McCarthy et al. (1995) McCarthy, P. J., Spinrad, H., & van Breugel, W. 1995, ApJS, 99, 27
- Meurer et al. (1999) Meurer, G. R., Heckman, T. M., & Calzetti, D. 1999, ApJ, 521, 64
- Overzier et al. (2005) Overzier, R. A., Harris, D. E., Carilli, C. L., Pentericci, L., Röttgering, H. J. A., & Miley, G. K. 2005, A&A, 433, 87
- Pentericci et al. (2002) Pentericci, L., Kurk, J. D., Carilli, C. L., Harris, D. E., Miley, G. K., & Röttgering, H. J. A. 2002, A&A, 396, 109
- Reuland et al. (2003) Reuland, M., et al. 2003, August), ApJ, 592, 755–766
- Saito et al. (2008) Saito, T., Shimasaku, K., Okamura, S., Ouchi, M., Akiyama, M., Yoshida, M., & Ueda, Y. 2008, ApJ, 675, 1076
- Scharf et al. (2003) Scharf, C., Smail, I., Ivison, R., Bower, R., van Breugel, W., & Reuland, M. 2003, ApJ, 596, 105
- Seymour et al. (2007) Seymour, N., et al. 2007, ApJS, 171, 353
- Spinrad et al. (1997) Spinrad, H., Dey, A., Stern, D., Dunlop, J., Peacock, J., Jimenez, R., & Windhorst, R. 1997, ApJ, 484, 581
- Steidel et al. (2000) Steidel, C. C., Adelberger, K. L., Shapley, A. E., Pettini, M., Dickinson, M., & Giavalisco, M. 2000, ApJ, 532, 170
- Stockton et al. (1995) Stockton, A., Kellogg, M., & Ridgway, S. E. 1995, ApJ, 443, L69
- Telfer et al. (2002) Telfer, R. C., Zheng, W., Kriss, G. A., & Davidsen, A. F. 2002, ApJ, 565, 773
- van Ojik et al. (1997) van Ojik, R., Roettgering, H. J. A., Miley, G. K., & Hunstead, R. W. 1997, A&A, 317, 358
- Vanden Berk et al. (2001) Vanden Berk, D. E., et al. 2001, AJ, 122, 549
- Venemans et al. (2007) Venemans, B. P., et al. 2007, A&A, 461, 823
- Villar-Martín et al. (1999) Villar-Martín, M., Fosbury, R. A. E., Binette, L., Tadhunter, C. N., & Rocca-Volmerange, B. 1999, A&A, 351, 47
- Villar-Martín et al. (2007) Villar-Martín, M., Sánchez, S. F., Humphrey, A., Dijkstra, M., di Serego Alighieri, S., De Breuck, C., & González Delgado, R. 2007, June), MNRAS, 378, 416–428
- Villar-Martín et al. (2003) Villar-Martín, M., Vernet, J., di Serego Alighieri, S., Fosbury, R., Humphrey, A., & Pentericci, L. 2003, MNRAS, 346, 273
- Zirm et al. (1999) Zirm, A., et al. 1999, in The Hy-Redshift Universe: Galaxy Formation and Evolution at High Redshift, ed. A. J. Bunker & W. J. M. van Breugel, Volume 193 of Astronomical Society of the Pacific Conference Series 114
- Zirm et al. (2003) Zirm, A. W., Dickinson, M., & Dey, A. 2003, ApJ, 585, 90
- Zirm et al. (2005) Zirm, A. W., et al. 2005, ApJ, 630, 68
- Zirm et al. (2008) Zirm, A. W., et al. 2008, ApJ, 680, 224