On the Carriers of the 21 Micron Emission Feature in Post-Asymptotic Giant Branch Stars
Abstract
The mysterious 21 emission feature seen in sixteen C-rich proto-planetary nebulae (PPNe) remains unidentified since its discovery in 1989. Over a dozen of materials are suggested as the carrier candidates. In this work we quantitatively investigate eight inorganic and one organic carrier candidates in terms of elemental abundance constraints, while previous studies mostly focus on their spectral profiles (which could be largely affected by grain size, shape and clustering effects). It is found that: (1) five candidates (TiC nanoclusters, fullerenes coordinated with Ti atoms, SiS2, doped-SiC, and SiO2-coated SiC dust) violate the abundance constraints (i.e. they require too much Ti, S or Si to account for the emission power of the 21 band, (2) three candidates (carbon and silicon mixtures, Fe2O3, and Fe3O4), while satisfying the abundance constraints, exhibit secondary features which are not detected in the 21 sources, and (3) nano FeO, neither exceeding the abundance budget nor producing undetected secondary features, seems to be a viable candidate, supporting the suggestions of Posch et al. (2004).
keywords:
(stars:) circumstellar matter – infrared: stars – stars: AGB and post-AGB – stars: individual (HD 56126)1 Introduction
Since its first detection in 1989 (Kwok et al., 1989), the so-called “21 feature” has been identified in sixteen proto-planetary nebulae (PPNe; Kwok et al. 1999, Hrivnak et al. 2009) [and arguably also in two planetary nebulae (PNe) associated with Wolf-Rayet central stars (Hony et al., 2001) and in two highly evolved carbon stars (Volk et al., 2000)]. This feature has little shape variation among different sources with a peak wavelength at 20.1 and a FWHM of 2.2–2.3. Most of these sources exhibit quite uniform characteristics: they are metal-poor, carbon-rich F and G supergiants with strong infrared (IR) excess and over abundant s-process elements (Zhang et al., 2006).
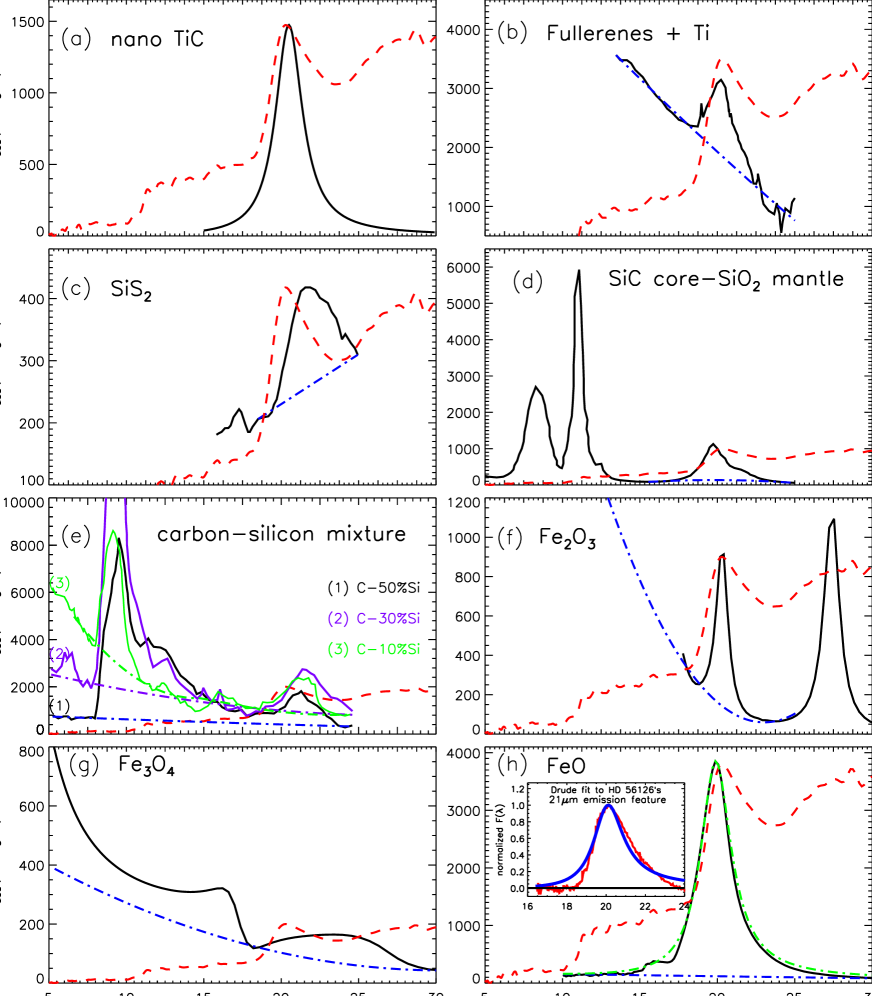
After its discovery, over a dozen of carrier candidates have been proposed (see Fig. 1), with the number of proposed candidate materials comparable to the total number of the 21 feature sources (see Andersen et al. 2005, Zhang et al. 2006). These include both inorganic materials: (a) TiC nanoclusters (Von Helden et al., 2000), (b) SiS2 grains (Goebel, 1993), (c) Doped-SiC dust(Speck & Hofmeister, 2004), (d) carbon and silicon mixtures (Kimura et al., 2005) , (e) SiC core-SiO2 mantle grains (Posch et al., 2004), (f) FeO (Posch et al., 2004), (g) Fe2O3, and (h) Fe3O4 (Cox, 1990); and organic materials: (i) large-cage carbon particles (fullerenes) coordinated with Ti atoms (Kimura et al., 2005), (j) urea or thiourea (Sourisseau et al., 1992), (k) polycylic aromatic hydrocarbon (PAH), and (h) hydrogenated amorphous carbon (HAC) (Buss et al., 1993; Justtanont et al., 1996).
However, the carrier of this feature remains unidentified (see Posch et al. 2004 for an excellent overview). It is considered as one of the most interesting unresolved mysteries in astrochemistry (Kwok et al., 2002). Previous studies mostly rely on a comparison of the spectral profile of a candidate material with the observed 21 emission feature. In this respect, astronomers often consider spherical dust using Mie theory. However, the spectral profile is expected to vary with grain shape, size, and the presence of voids (e.g. see Huffman 1989; Li et al. 2008; Voshchinnikov & Henning 2008). Although models based on spherical dust may not fit the observed 21 emission feature, one can not rule out the possibility that a reasonably good fit may be obtained by fine-tuning dust shape and size distributions. Indeed, some studies have demonstrated that the spectral fit is improved with a continuous distribution of ellipsoids (CDE; see e.g. Posch et al. 2004) for the dust shape. We should note that even the failure of CDE models can not readily rule out the considered candidate material since the spectral profile could be further affected by many other factors (e.g., clustering of individual grains, see Rouleau & Martin 1991).
In this work we attempt to constrain the nature of the 21 feature carrier by performing a systematic study of the validity of the above-listed candidate carriers. In view of the fact that a spectral profile “mismatch” could probably be improved by considering dust shape and size distributions, clustering of individual grains, and the presence of voids, unlike previous studies, we do not completely rely on whether the interested candidate material produces a band profile closely matching the observed one. Instead, we take an alternative approach which at least complements previous approaches (which are mainly based on spectral profile matching): we focus on the elemental abundance required to account for the total power emitted in the 21 feature. This approach is less affected by the (unknown) dust clustering and shape distribution and is therefore more robust.
This paper is organized as follows: we first present in §2 the general constraints on the validity of a proposed carrier. We then apply these constraints to the above-listed candidate materials (§4). For this purpose, we choose the prototypical 21 feature source HD 56126 as a comparison basis. The main results are summarized in §5.
2 General Constraints: Band Strength and Abundance Budget
For a candidate carrier to be a viable explanation of the 21 feature, in addition to the close match with the 21 feature observed in PPNe, it must satisfy the abundance constraint, i.e., the candidate material must be abundant enough to account for the total power emitted in the 21 feature. Further, it should of course not produce any secondary features which are not observed in the 21 sources.
The 21 feature is one of the strongest IR dust features in C-rich evolved objects. The strongest 21 source (HD 56126) emits 8% of its total IR power in this feature, while the 21 feature in other sources amounts to 1–7% of their total IR power (Hrivnak et al., 2000). That the 21 feature emits such a large energy would put stringent constraint on the abundance of the carrier, particularly, on the abundance of the relatively rare element in the suggested carrier material (e.g. Ti in TiC).
Let be the total power emitted in the 21 band, which is an observational parameter. It is related to the total mass of the carrier dust through
| (1) |
where the integration is over the 21 band (but with the continuum underneath the 21 feature subtracted), is the mass absorption coefficient (also known as “opacity”) of the dust, is the Planck function of a black body with temperature at wavelength , and is the dust temperature.
If the carrier material contains element X, the abundance of element X (relative to H) in the dust can be written as
| (2) |
where is the total hydrogen mass of the circumstellar envelope of the object, is the mass of a hydrogen atom, is the molecular weight of the dust grain, and is the number of atoms per molecule for element X. With a good knowledge of the dust temperature and the mass absorption coefficient in the 21 wavelength range of the carrier, one can therefore estimate the abundance of a typical element locked up in dust required to emit the observed power in the 21 band
| (3) |
It can be seen that for a given , the required abundance is inversely proportional to the integral of absorption coefficient and the dust radiation intensity over the 21 band range.
We approximate the mass absorption coefficient profile with a Drude function
| (4) |
where and are respectively the peak wavelength and FWHM of the profile;111The Drude profile, closely resembling a Lorentz profile and having more extended wings than a Gaussian profile, is expected for classical damped harmonic oscillators (Li, 2008). With = 20.1 and = 2.2, the Drude profile fits well the observed 21 emission feature except the blue-wing (which is a bit more extended than that observed), while the Gaussian profile is a bit too narrow in the red-wing. To be more physical, we should fit the observed 21 emission feature with , a sum of products of a Drude mass absorption profile and Planck functions of a range of temperatures (since the carrier of the 21 feature is expected to have a range of thermal equilibrium temperatures in the 21-feature-emitting shell). Indeed, we find that with = 20.1, = 1.85, and , the product of a Drude profile and a single-temperature blackbody closely fits the observed 21 emission feature (see the inserted panel in Fig. 1h). In this work, we take = 20.1 and = 2.2 in order to maximize the energy output in the 21 feature so as to minimize the dust abundance requirement. and is the mass absorption coefficient integrated over the 21 band. The adoption of a Drude function and the values of and which match the observed feature profile mostly is the best condition for the absorption coefficient. The abundance under such condition is the minimum. By substituting Eq. (4) into Eq. (3), the lower limit of becomes
| (5) |
Note that the integration is continuum-subtracted. Since the Planck function is a monotonically increasing function of , the minimum abundance of element X, , becomes a decreasing function of and . For a fixed , given a reasonable dust temperature range (usually 100–200K for the circumstellar envelope of post-AGB stars) and from laboratory data, we can estimate the range of . For a viable candidate, the required minimum abundance must not exceed what is available.
If is measured in the laboratory, can be obtained from the direct integration of the measured profile of . In a few cases, is not directly measured, we obtain from the absorption cross section or the absorption efficiency calculated through Mie theory
| (6) | |||||
where and are respectively the mass and radius of the dust grain (we assume that the dust is spherical), and is the mass density of the dust.
3 The Tester: HD 56126
A successful candidate carrier should be able to explain the observed 21 feature in all sources. A failure in a single source would be sufficient to rule out the candidate. To examine whether the carriers can account for the observed feature strength, we choose HD 56126, a prototypical 21 feature source, as the tester.
HD 56126 (IRAS 07134+1005) is selected for the following reasons: (1) It is the strongest 21 feature emitter and its emission flux was accurately measured; (2) It is one of the best studied 21 feature sources and its basic parameters are accurately determined. Hony et al. (2003) built a detailed dust radiative transfer model for the circumstellar envelope and derived the composition and mass of the dust shell of HD 56126. Van Winckel & Reyniers (2000) performed a homogeneous photospheric abundance analysis of HD 56126 (as well as several other 21 feature sources). We summarize in Table 1 the key relevant stellar and circumstellar parameters which will be used in later analysis. The parameter is not very certain in the range 0.16–0.44 . We generously take the high end () for our analysis. Since the required minimum abundance is inversely proportional to (see eq. 5), if a model based on the high end already exceeds the elemental budget it should certainly be rejected.
By assuming that the X atoms available in the circumstellar envelopes around the 21 feature sources (i.e. ) are all depleted in the dust species proposed as a carrier candidate, we obtain the maximum dust mass (relative to H) of the dust species containing the key element X from Eq. 2
| (7) |
This is the upper limit on the amount of dust containing element X available to account for the 21 feature. For a given dust temperature , from Eq. 5 we obtain the lower limit on the amount of dust (relative to H) required to account for the 21 feature
| (8) | |||||
Apparently, for a valid carrier candidate, the minimum required mass should not exceed the maximum available mass .
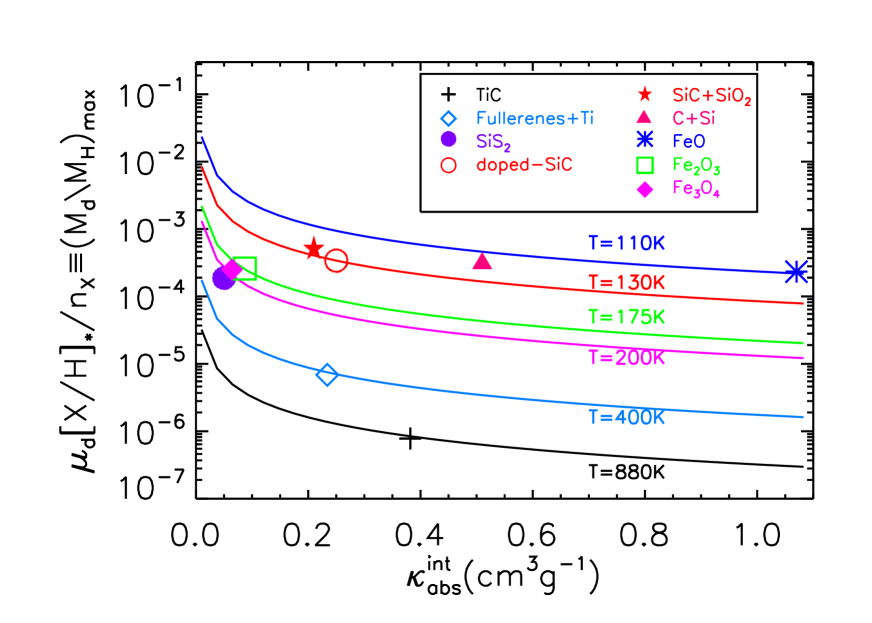
In Fig. 2 we plot against for the proposed carrier candidates. We also plot as a function of for a range of temperatures . Note that the temperature at which is the lowest temperature the dust should have. For example, at TiC nanoclusters have . In order for not exceeding , TiC dust must have , otherwise there is simply not enough dust material.
4 Assessing Individual Carrier Candidates
We assess proposed individual carrier candidates by examining (1) whether they are capable of emitting the observed large amount of energy in the 21 band without requiring more dust material than available, and (2) whether the candidate carrier produces (undetected) secondary features. In view of the crucial role of elemental abundances in this assessment, we divide the carrier candidates into four groups: titanium-bearing, sulfur-bearing, silicon-bearing and iron-bearing grains.
The 3.3, 7.7 and 11.3 PAH features and the much more prominent 30 feature which is generally attributed to MgS dust (Goebel & Moseley, 1985; Hony et al., 2002) are seen in fourteen of the sixteen known 21 feature sources (Kwok et al. 1999, Hrivnak et al. 2009). Except these features, the 21 sources do not universally show any additional dust features. However, in addition to the 21 feature, some of the proposed carrier candidates exhibit strong spectral features at other wavelengths as well which are not detected at all or very weak in the 21 sources.
In view of the wide detection of the PAH features (and some flat plateau attributed to HAC) and the 30 feature in the 21 sources, Buss et al. (1993) suggested that the 21 feature might originate from some organic molecules like PAHs, while Goebel (1993) argued that sulfide could be the carrier candidate. But the proposition of a carrier candidate based on its matching to these accompanying features is potentially problematic since they vary from source to source, while the profile of the 21 feature is rather universal (i.e. with the same peak wavelength, a very similar FWHM and asymmetrical shape with a long red tail) indicating that the carrier of this feature should be the same in different sources. We also note that observationally, there does not appear to show any correlation between the strength of the 21 feature with that of the 30 feature (Jiang et al., 2009).
For a given proposed carrier, the predicted intensity ratios of the associated features to the primary 21 feature must either be compatible with that observed (in case of detection) or not exceed the upper limit (in case of non-detection). SiC dust with carbon impurities, once considered as a promising candidate due to its abundant occurrence (Speck & Hofmeister, 2004), was challenged based on the much higher model-predicted intensity ratio of the 11.3 feature to the 21 feature than observed (Jiang et al., 2005).
4.1 Titanium-Bearing Grains
Titanium is a relatively rare element in the solar system ([Ti/H]⊙ 9.77, Grevesse 1989), and the Ti abundance in the metal-poor star HD 56126 is even lower: [Ti/H]1.310-8 (Van Winckel & Reyniers, 2000). Although some Ti-bearing grains (e.g. TiC nanoclusters and fullerenes coordinated with Ti atoms) have a 21 feature with a close similarity to the 21 feature observed in PPNe, the deficiency of titanium would be a potential problem.
4.1.1 Titanium Carbide
Von Helden et al. (2000) argued that the 21 feature may arise from titanium carbide nanoclusters (made of 27 to 125 atoms). The laboratory-measured spectral profiles of TiC nanoclusters match almost perfectly with the intrinsic profile of the observed 21 feature, better than any other candidate materials, although bulk TiC dust does not display a strong 21 band (see Henning & Mutschke 2001; Kimura & Kaito 2003b). The TiC hypothesis gains its strength from the identification of presolar TiC grains (with radii 100Å) in primitive meteorites as nanometer-sized inclusions embedded in micrometer-sized presolar graphite grains (Bernatowicz et al., 1996). However, since Ti is a rare element, the abundance test would be a neck to the TiC hypothesis. Indeed, three different groups have already challenged the TiC hypothesis from the Ti abundance point of view (Hony et al., 2003; Chigai et al., 2003; Li, 2003). They all pointed out that there may not be enough titanium to account for the observed strength of this feature. Here we add another piece of evidence against the TiC hypothesis by confronting it with the band strength constraint discussed in §2. Unlike previous studies, in this approach we do not need to know the ultraviolet/optical absorption properties of TiC. The experimental IR absorption spectrum of TiC nanoclusters was measured (Von Helden et al., 2000) and fitted with a Lorentz oscillator model (Chigai et al., 2003). The observational emission spectrum of HD 56126 and the experimental Lorentz profile of the 21 band are shown in Fig. 1a.
The integrated mass absorption coefficient of nano TiC is for the 21 band, as derived from the experimental spectrum of Von Helden et al. (2000). The emission temperature associated with the 21 carrier is not well constrained.
Exposed to the stellar radiation, TiC nanocrystals, because of their small heat capacities, will not attain an equilibrium temperature; instead, they will be transiently heated by single photons (see Draine & Li 2001). The stellar atmospheric spectrum of HD 56126 peaks at , i.e., a typical stellar photon has an energy of . With a Debye temperature of (Pierson, 1996), when heated by a 3 photon, for a TiC nano cluster as small as Ti14C13 (consisting of atoms) the peak temperature is only .
We calculate from Eq. (5) the minimum abundance requirement of Ti14C13 dust to be at . Since the titanium abundance in HD 56126 is measured to be (see Table 1), the minimum abundance requirement (at ) exceeds the available abundance by a factor of 15.
For a given exciting photon energy (say, ), the peak temperature decreases with the nanocluster size: for Ti32C32 (consisting of atoms) and for Ti72C53 (consisting of atoms). Therefore, larger TiC nanoclusters would require even more Ti atoms to account for the observed 21 intensity.
In fact, based on the available Ti abundance in HD 56126, nano TiC grains have to reach a temperature at least as high as 880 K to achieve the observed emission strength [i.e. ; see Fig. 2], while the peak temperature is only 268 K even for a small cluster consisting of only 27 atoms. Apparently, the TiC hypothesis requires too much Ti to be viable, even under the most optimal condition that all Ti atoms are locked in TiC nanocrystals.
4.1.2 Fullerenes Coordinated with Ti Atoms
Kimura et al. (2005) found that the laboratory spectra of large-cage carbon particles (fullerenes) coordinated with Ti atoms have a characteristic feature at 20.3 closely resembling the 21 feature of post-AGB stars (see Fig. 1b). They attributed the origin of the 21 feature to the vibrational interaction between Ti atoms and fullerene cages. In order to obtain the integrated mass absorption coefficient only over the 21 band, the continuum absorption needs to be subtracted. Based on the continuum spectrum between 15–18.5 and 22–24, we use a two order polynomial to fit the continuum underneath the 21 feature. In the following sections, unless otherwise stated, the continuum absorption is determined in the same way. The resulting continuum-subtracted, integrated mass absorption coefficient for the 21 is .
Similar to TiC nanoclusters, fullerenes will also subject to stochastic heating in the circumstellar envelope around HD 56126. With a Debye temperature of ,222See http://www.sesres.com/PhysicalProperties.asp. when heated by a typical photon of 3 in HD 56126, even C60 is only heated to a peak temperature of .333For larger fullerenes, we expect a lower peak temperature and therefore require a higher minimum abundance , indicating a more severe Ti abundance budget shortage.
With and , from Eq. (5) we estimate the minimum abundance requirement of fullerenes with Ti atoms to be , exceeding the available Ti abundance by a factor of 618. In order not to violate the abundance constraint (i.e. or ), the dust temperature should be higher than 400 K (see Fig. 2), while the peak temperature of the C60 + Ti dust is only 89 K. Therefore, large fullerenes coordinated with Ti atoms are unlikely the carrier of the 21 feature seen in PPNe.
4.2 Sulfur-Bearing Grains: Silicon Disulfide
The formation of sulfide is very likely to occur in carbon-rich circumstellar environments. As early as thirty years ago, Lattimer et al. (1978) predicted the possible presence of various sulfur-bearing materials in carbon-rich systems. For several kinds of predicted sulfides, including MgS, FeS, SiS2 and CaS, the absorption spectra and coefficients have been measured in laboratory (Nuth et al., 1985). The prominent 30 dust feature seen in AGB, post-AGB and PNe, amounting to more than 20% of the total IR flux, is attributed to MgS (Goebel & Moseley, 1985; Hony et al., 2002). Since most of the 21 sources also exhibit a strong feature at 30, it is not unreasonable to postulate that some sulfur-bearing grains may also contribute to the 21 feature. Indeed, the laboratory spectrum of SiS2 displays a prominent feature at 22 (Nuth et al., 1985). Goebel (1993) further suggested SiS2 solids as the material responsible for the 21 feature.
Based on the laboratory spectra of Goebel (1993) and Nuth et al. (1985), we obtain for the 21 band of SiS2 after subtracting the continuum (see Fig. 1). In addition to the 21 band, the laboratory absorption spectrum of SiS2 also exhibits a secondary feature at 17 that is never observed in the 21 sources (Kraus et al., 1997). In order to sufficiently suppress the 17 feature so that it remains un-noticeable, the dust temperature needs to be 100 K. For we estimate the minimum abundance requirement of SiS2 to be , exceeding the available S abundance by a factor of 24. As shown in Fig. 2, in order for the SiS2 model to satisfy the abundance constraint (i.e. or ), SiS2 dust needs to be hotter than 200 K.
Posch et al. (2004) also recognized that very low dust temperatures (significantly lower than 100 K) would be required to make the secondary feature at 17 negligible in strength compared to the 21 SiS2 feature. Although it is not possible to calculate the equilibrium temperature of SiS2 due to the lack of knowledge of its visual and near-IR optical constants, Posch et al. (2004) argued that “it is hardly conceivable that SiS2 is so transparent in the visual range as to remain much colder than 100 K”. In our approach we actually do not need to know the exact temperature of SiS2: (1) if – although the 17 feature will be suppressed, one requires too much S; (2) if – although there will not be a S budget problem, the 17 feature will be prominent. Therefore, our approach readily ruled out SiS2.
Moreover, it is worth noting that sulphur may not be completely locked in SiS2. The prominent 30 feature, if indeed arising from MgS, would consume a significant portion of the sulphur available in the circumstellar envelopes around the 21 sources. According to Zhukovska & Gail (2008), MgS has priority in the cooling sequence of sulphur-bearing solid compound.
4.3 Silicon-Bearing Grains
With four valence electrons, Si easily reacts with other atoms such as C, O, Fe and Mg to form various types of silicates. In the O-rich dust shells of evolved stars (from AGB stars to PNe), both amorphous and crystalline silicates are detected through their numerous emission bands. Over 4000 sources are detected to have the most common silicate features at 9.7 and 18. While in the C-rich dust shells like those of the 21 sources, relatively simple Si-bearing compounds are formed (e.g. SiC, SiO2, and SiS2). The broad 11.3 feature seen in five of the sixteen 21 sources (Kwok et al., 1999) is identified to arise from the Si–C stretching mode of SiC. Being chemically active and abundant in circumstellar envelopes, several Si-bearing dust species have been proposed to be the carrier of the 21 feature.
Silicon is an abundant element in the universe (its solar abundance is , Grevesse 1989), about one order of magnitude higher than sulphur. Unfortunately, the Si abundance has not been measured for our tester HD 56126. We take the following approach to roughly estimate of HD 56126: (1) We compile the abundance data of all 21 sources and find that five 21 sources – IRAS 04296, IRAS 22223, IRAS 23304, (Van Winckel & Reyniers 2000), and IRAS 05113, IRAS 22272 (Reddy et al. 2002) – have known Si abundance. (2) We calculate the abundance ratios of Si to Ca and of Si to S for all five sources and find that these ratios do not vary much.444This may not be unexpected since S, Si, and Ca all are elements. Let and . For IRAS 04296, IRAS 22223, IRAS 23304, IRAS 05113, and IRAS 22272, the Si to Ca abundance ratios are respectively 1.80, 1.57, 1.69, 1.45, and 1.49, with a mean ratio of 1.55 (and a standard deviation of ). The Si to S abundance ratios vary a bit more compared to ; they are respectively 0.70, 0.59, 0.57, 0.22, and 0.28 for IRAS 04296, IRAS 22223, IRAS 23304, IRAS 05113, and IRAS 22272, with a mean ratio of 0.42 (and a standard deviation of ).
(3) By assuming that the Si to Ca and Si to S abundance ratios of HD 56125 are similar to that of the other five 21 sources, we estimate for HD 56126 from and (Van Winckel & Reyniers 2000), or from and . (4) We finally take the Si abundance of HD 56126 to be the average of that estimated from Ca and S, .
4.3.1 Doped-SiC
Silicon carbide (SiC) grains with impurities were suggested to be the carrier of the 21 feature, based on laboratory data that doped SiC grains exhibit a resonance at 21 (Speck & Hofmeister, 2004). This proposal gains strength from the fact that SiC is a common dust species in carbon-rich circumstellar envelopes. The presence of circumstellar SiC grains was first revealed by Gilra (1972). Nowadays, SiC is believed to be the contributor of the well-known IR dust feature at 11.3 observed in more than 700 carbon stars (Kwok et al., 1997). Since five of the sixteen 21 sources (i.e. about 40%) exhibit the 11.3 feature, it is not unreasonable to consider both features coming from the same carrier. In particular, the distributions of the dust emitting at 21 and 11.3 are co-spatial in two 21 sources (HD 56126 and IRAS Z02229+6208; Kwok et al. 2002), which also supports the SiC hypothesis as the 21 carrier.
However, the 21 feature is secondary and much weaker than the primary 11.3 feature in the experimental spectrum of SiC (Speck & Hofmeister, 2004). Jiang et al. (2005) assumed a single Lorentz oscillator model for the 21 feature with treated as a free parameter (where is the absorption efficiency at wavelength and is the dust size). They found that the predicted 11.3 feature is still much stronger than observed even with = . It is unlikely to expect the strength of the 21 feature, a secondary feature of SiC caused by impurities, would be much stronger than that of the primary 11.3 feature for which (Jiang et al., 2005). Therefore, doped-SiC cannot produce the 21 feature without producing too strong a 11.3 feature to be consistent with observations.
Jiang et al. (2005) calculated the equilibrium temperatures and of doped-SiC of different grain sizes and a range of values. For -SiC, the equilibrium temperature is in a narrow range (60–80 K), insensitive to the assumed values (see Fig. 2 of Jiang et al. 2005). We see that even with = (which implies ), the required Si abundance is at least (for ) and (for ), way too much compared with estimated for HD 56126.
Unlike -SiC, the equilibrium temperatures of -SiC are sensitive to and become much higher for smaller (see Fig. 3 of Jiang et al. 2005). We will consider cases with both large and small . For (i.e. ), submicron-sized -SiC dust has an equilibrium temperature 100 K (see Fig. 3 of Jiang et al. 2005), suggesting that one requires at least . For (i.e. ), with a typical equilibrium temperature 60 K (see Fig. 3 of Jiang et al. 2005), the minimum required Si abundance is . Therefore, for both -SiC and -SiC, one needs way too much Si, exceeding the Si abundance available in HD 56126 (8.50) by a factor of two magnitudes. So it is secure to conclude that doped-SiC can not be the carrier of the 21 feature.
4.3.2 SiC Core-SiO2 Mantle Grains
Clément et al. (2003) carried out laboratory experiments and found that pure SiC nano-particles can be quite easily oxidized at their surfaces to form SiO2-coated SiC grains. The oxidization can even reach a considerable volume fraction of the particles. The laboratory spectra of the partially oxidized SiC grains show an absorption feature at 21–22. Posch et al. (2004) suggested that dust composed of a SiC core and a SiO2 mantle may be the carrier of the 21 feature.
From the values of Posch et al. (2004), we obtain . The equilibrium temperatures of submicron-sized SiC core-SiO2 mantle grains is 104–126 in the 21 emitting region of HD 56126 (Posch et al., 2004). The minimum requirement of Si is 1.0010-5–3.2210-5, which is slightly above the available Si abundance of 8.50.
However, these core-mantle grains have two prominent features (see Fig. 1d) at 8.3 (arising from the SiO2 mantle) and 11.3 (arising from the SiC core). The 8.3 feature is never seen in the 21 sources except three 21 sources appear to have a plateau at 8 with an average FWHM of 4 which is more likely from HAC or the C–C stretching mode of PAHs (Kwok et al., 2001). As far as the 11.3 feature is concerned, we compare the flux ratio of the 11.3 band to the 21 band observed in HD 56126 [](Hony et al., 2003) with that predicted from the SiC core-SiO2 mantle model. It is found that the dust should be colder than 70 in order not to produce too strong a 11.3 feature. However, the equilibrium temperature of submicron-sized SiC core-SiO2 mantle grains is 104–126 in the 21 emitting region of HD 56126 (Posch et al., 2004). Moreover, if the dust temperature is as low as 70 K,
the minimum Si abundance requirement would be 8.0510-4, exceeding the Si abundance available in HD 56126 () by a factor of 100.
In addition, the opacity profile of these grains has a shoulder in the red-wing of the 21 band which is not observed in the 21 sources. Therefore, both the secondary features and the 21 profile are discrepant with observations, suggesting that SiC core-SiO2 mantle grains are not a valid carrier candidate.
4.3.3 Solid-Solution Phase of Carbon and Silicon with a Diamond Structure
Kimura et al. (2005) measured the IR absorption spectra of silicon-containing carbon films prepared by ion sputtering of carbon and silicon carbide mixture pellets. The carbon-silicon mixture film, composed of a solid-solution phase of carbon and silicon with a diamond structure, show significant absorption features at 9.5 and 21 (see Fig. 1e). Thus, Kimura et al. (2005) suggested that the 21 feature observed in PPNe may arise from the solid-solution phase of carbon and silicon with a diamond structure.
However, the 9.5 feature is far stronger than the 21 feature in the carbon-silicon mixture film, but it is never seen in the 21 sources. In order to suppress the 9.5 feature to such a level that the total flux emitted in the 9.5 band is less than, say 10% of that in the 21 feature, the critical dust temperature, depending on the silicon percentage, needs to be 102 K for C–30% Si film or 120 K for C–10% Si film.
Unfortunately, there lacks a full knowledge of the optical properties of such carbon-silicon mixtures to determine their equilibrium temperatures. We adopt the dielectric functions of diamonds which may be a reasonable approximation of the carbon-silicon mixtures with a diamond structure (Kimura & Kaito, 2003a). We find the temperature of submicron-sized diamonds in the 21-emitting region of HD 56126 is 148–182.555The Si abundance is less of an issue. From the absorption profiles of Kimura et al. (2005), we obtain for C–50% Si film, for C–30% Si film, and for C–10% Si film. If the dust temperature is respectively higher than 130 K, 110 K, and 100 K for C–50% Si film, C–30% Si film, and C–10% Si film, the minimum required Si abundance would not exceed that available in HD 56126. Therefore, the carbon-silicon mixtures, if they are indeed responsible for the 21 feature, would produce too strong a 9.5 emission feature to be consistent with that observed in the 21 feature sources.
4.4 Iron-Bearing Grains
4.4.1 Fe2O3 and Fe3O4
Iron oxides were first suggested as the carrier of the 21 feature by Cox (1990). Cox (1990) reported the detection of a 21 emission feature in the IRAS LRS spectra of ten HII regions and associated it with the 21 band seen in PPNe. From the strength and the “universality” of this feature in HII regions, iron oxides -Fe2O3 (maghemite) and Fe3O4 (magnetite) were assigned to this band. However, Oudmaijer & de Winter (1995) later re-analyzed the IRAS LRS spectra of these sources and concluded that the claimed 21 band was just an artifact. This was confirmed in late 1990s when some of these HII regions were observed with ISO which show no footprints of a broad 21 or 20 band (Posch et al., 2004). In fact, the laboratory absorption spectra of iron oxides of Cox (1990) were quite different from the intrinsic profile of the 21 feature of PPNe which had not been well identified until Volk et al. (1999). But of course the spectral profile match might be improved if one considers dust shape and clustering effects. Therefore iron oxides are not readily ruled out just based on the imperfect spectral match.
Despite that the 21 feature found in HII regions turns out to be an artifact, iron oxides composed of cosmically abundant elements and exhibiting a strong feature around 20 deserve a detailed study as being the carrier of the 21 feature seen in PPNe. In addition to -Fe2O3, other forms of Fe2O3 exhibit a feature around 21 as well. Koike et al. (1981) indicated hematite (-Fe2O3) has several peaks at 9.2, 18, 21 and 30 in its absorption spectrum. Similarly, the absorption spectrum of Fe3O4 shows two features at 17 and 25.
Cox (1990) only presented the normalized absorption profiles of two iron oxides (-Fe2O3 and Fe3O4), which cannot be used to calculate . Based on the unpublished optical constants of Fe2O3 and Fe3O4 from the Jena group666http://www.astro.uni-jena.de/Laboratory/OCDB/oxsul.html#B1, and are calculated from Mie theory and assuming a spherical radius of 0.1. We obtain for Fe2O3 and for Fe3O4. As shown in Fig. 1f and Fig. 1g, Fe2O3 displays two strong bands at 20.5 and 27.5, while Fe3O4 exhibits two broad features at 16.5 and 24. Apparently, Fe3O4 does not fit the 21 feature seen in PPNe – the model feature peak is neither strong nor at the right wavelength (see Fig. 1g). For Fe2O3, even with temperature fine-tuning, it is very hard to suppress the 27.5 feature which is not seen in the 21 sources.
Moreover, Fe2O3 and Fe3O4 may not be able to survive in such a reducing environment like C–rich circumstellar envelopes of the 21 sources (Posch et al., 2004). Therefore, Fe2O3 and Fe3O4 are unlikely responsible for the 21 feature seen in PPNe.
4.4.2 FeO
Posch et al. (2004) pointed out that iron monoxide (FeO; wüstite) can survive in the C-rich reducing environment and proposed that nano-sized FeO dust may be the carrier of the 21 feature seen in PPNe. FeO will be reduced to metal iron by UV photons in PNe, while it is less likely for oxygen to stick to iron to form FeO in AGB stars whose circumstellar dust is much hotter than in PPNe. Since FeO can be either oxygenated to higher oxides of iron or reduced to iron atoms, it can survive only in a very strict physical and chemical environment, which is consistent with the observational fact that the 21 band is rarely seen and detected only in PPNe that live for a short transitory period.
We adopt the dielectric functions of pure FeO measured by Henning & Mutschke (1997) at temperatures = 10, 100, 200 and 300 to calculate the absorption spectrum of FeO dust. It is found that FWHM of the 21 band of FeO decreases from 3.6 at room temperature to 2.4 at = 100, while the band peak shifts from 19.9 to 20.1. At = 100, both FWHM and of FeO agree well with the observed 21 profile.
Adopting the dielectric functions of FeO measured at and assuming spherical dust of radii nm as suggested by Posch et al. (2004), we calculate for FeO (Fig. 1h shows the calculated profile which is closely reproduced by a Drude function with = 20.1 and = 2.4). Nano-sized FeO grains will be stochastically heated by single stellar photons (see Draine & Li 2001). With a Debye temperature of (Radwanski & Ropka, 2008), the peak temperature of a 1 nm FeO dust is when heated by a typical photon of 3 eV in HD 56126. At the minimum abundance requirement is . This is smaller than the stellar abundance (see Fig. 2). Note that HD 56126 is the most iron-poor object among the sixteen 21 sources. Therefore, the FeO hypothesis will generally satisfy the abundance requirement.
FeO has no noticeable secondary features in the IR, except a small shoulder in the blue wing of the 21 band which is not seen in the 21 sources.
Stochastically-heated FeO nano dust is expected to have a distribution of temperatures (). Although the optical properties of FeO change strongly with temperature, at they are much less sensitive to temperature (see Henning & Mutschke 1997). It is therefore reasonable to expect that FeO nano dust with a distribution of temperatures at also fits the observed 21 profile since the experimental spectrum of FeO obtained at provides the best match.
Finally, one may ask how FeO is formed in the C-rich shells around the 21 sources where it is generally believed that all O atoms are trapped in CO; or in other words, are there enough O atoms left to form FeO? Our answer is “yes”. The C and O abundances (relative to H) of HD 56126 are respectively and (Van Winckel & Reyniers, 2000). A substantial fraction of the C atoms is required to be tied in the carbonaceous dust components (amorphous carbon [a-C] and HAC) to account for the bulk of the IR emission of HD 56126 (see Hony et al. 2003). Taking and for the mass of amorphous carbon and HAC in the dust shell around HD 56126 (Hony et al., 2003), we estimate the amounts of C atoms locked in amorphous carbon and HAC to be and , respectively.777Here we adopt , the high end of the H mass of the HD 56126 shell. If we adopt the low end of , the required C depletion in dust needs to be increased by a factor of 2.8. This implies that there will be fewer C atoms in the gas phase to form CO and therefore more O atoms will be available to form FeO. We take the molecular weight of HAC to be (with , Hony et al. 2003). Therefore, there will be at most C atoms in the gas phase to react with O. Assuming all gas-phase C atoms are tied with O atoms to form CO, there will be O atoms left for other O-containing molecules and dust species.888Duley (1980) showed that the oxidation of metallic iron is a very efficient process provided that enough O2 molecules are present. FeO is a preferential product of low-temperature oxidation (e.g. see Roberts 1961, Fehlner & Mott 1970, while Fe2O3 and Fe3O4 are more likely formed at higher temperatures (e.g. see Gail & Sedlmayr 1998). Posch et al. (2004) argued that the low-temperature oxidation of very small iron grains – grains composed of atoms with a size of nm could result in pure FeO dust (instead of a large metallic iron core and a tiny FeO mantle). Even assuming all Fe atoms are locked up in FeO dust, FeO only needs O atoms.
5 Summary
We have quantitatively examined eight inorganic carrier candidates and one organic candidate for the 21 emission band detected in sixteen PPNe, by confronting the abundance and accompanying IR emission features required or predicted by each model with that observed. We take HD 56126, the strongest 21 feature source, as a testing case. The principal results of this paper are the following (see Table 2 for a summary):
-
1.
Among the nine carrier candidates, five (TiC nanoclusters, fullerenes coordinated with Ti atoms, SiS2, doped-SiC, and SiO2-mantled SiC dust) are readily ruled out because they fall short of either titanium, sulphur, or silicon. Even under the most optimal condition, the minimum Ti, S or Si abundance required to account for the observed 21 feature strength still substantially exceeds the available amount in the 21 sources.
-
2.
Three candidates (carbon-silicon mixtures, Fe3O4 and Fe2O3) are ruled out because they produce strong secondary features (in addition to the 21 feature) which are not seen in the 21 feature sources.
-
3.
FeO nano dust, closely matching the observed 21 emission feature neither exceeds the Fe abundance budget nor produces undetected secondary features. There are also plenty of O atoms in the dust shell around HD 56126 to form FeO, although it is a C-rich environment. Therefore, nano-sized FeO seems to be a viable candidate.
By taking an alternative approach based on abundance constraints complementary to that based on spectral profile matching, our results are consistent with that of Posch et al. (2004) except (1) we have also ruled out two newly-suggested candidates (i.e. fullerenes coordinated with Ti atoms, carbon-silicon mixtures); (2) SiC core-SiO2 mantle dust is more firmly ruled out as a valid candidate; and (3) we provide further support to the FeO hypothesis of Posch et al. (2004). Our approach does not rely on detailed spectral profile fitting which could be largely affected by dust size, shape and clustering effects.
We have not applied the above tests to the organic candidates (i.e. urea or thiourea, PAHs, and HAC) for three reasons: (1) the optical properties of urea or thiourea are not known; (2) although ten of the sixteen 21 sources show PAH emission features at the so-called 3.3, 6.2, 7.7, 8.2, and 11.3 “unidentified IR (UIR)” bands, PAHs are unlikely a viable candidate since their 21 band strength is much weaker than that of the “UIR” bands; and (3) HAC is an ill-characterized material; its optical properties are sensitive to the H/C and sp2/sp3 ratios (see Furton et al. 1999; Jones et al. 1990); its 21 band strength (especially relative to its vibrational bands at 6–8) is not well determined. To us, PAH clusters probably deserve a detailed investigation.
6 ACKNOWLEDGMENTS
We thank the anonymous referee for his/her very useful suggestions. We thank A. K. Speck for helpful discussions. B.W.J. and K.Z. are supported in part by China’s grants 2007CB815406, NSFC 10473003 and NCET-05-0144. A.L. is supported in part by Spitzer Theory Programs, the Spitzer Cycle 3 GO program P30403 and NSF grant AST 07-07866.
References
- Andersen et al. (2005) Andersen A. C., Posch T., Mutschke H., 2005, in Wilson A., ed., ESA Special Publication Vol. 577, Pitfalls in the identification of the 21 micron feature. pp 447–448
- Bernatowicz et al. (1996) Bernatowicz T., Cowsik R., Gibbons Patrick C.and Lodders K., Fegley Bruce J., Amari S., Lewis R. S., 1996, ApJ, 472, 760
- Buss et al. (1993) Buss Jr. R. H., Tielens A. G. G. M., Cohen M., Werner M. W., Bregman J. D., Witteborn F. C., 1993, ApJ, 415, 250
- Chigai et al. (2003) Chigai T., Yamamoto T., Kaito C., Kimura Y., 2003, ApJ, 587, 771
- Clément et al. (2003) Clément D., Mutschke H., Klein R., Henning T., 2003, ApJ, 594, 642
- Cox (1990) Cox P., 1990, A&A, 236, L29
- Draine & Li (2001) Draine B. T., Li A., 2001, ApJ, 551, 807
- Duley (1980) Duley W. W., 1980, ApJ, 240, 950
- Fehlner & Mott (1970) Fehlner F. P., Mott N. F., 1970, Oxidation of Metal, 2, 59
- Furton et al. (1999) Furton D. G., Laiho J. W., Witt A. N., 1999, ApJ, 526, 752
- Gail & Sedlmayr (1998) Gail H.-P., Sedlmayr E., 1998, in Chemistry and Physics of Molecules and Grains in Space. Faraday Discussions No. 109 Inorganic dust formation in astrophysical environments. p. 303
- Gilra (1972) Gilra D. P., 1972, PhD thesis, University of Wiconsin-Madison
- Goebel (1993) Goebel J. H., 1993, A&A, 278, 226
- Goebel & Moseley (1985) Goebel J. H., Moseley S. H., 1985, ApJ, 290, L35
- Grevesse (1989) Grevesse N., 1989, in AIP Conference Proceedings Vol. 183: Cosmic abundances of matter The abundances of matter in the sun. pp 9–16
- Henning & Mutschke (1997) Henning T., Mutschke H., 1997, A&A, 327, 743
- Henning & Mutschke (2001) Henning T., Mutschke H., 2001, Spectrochimica Acta, 57, 815
- Hony et al. (2003) Hony S., Tielens A. G. G. M., Waters L. B. F. M., de Koter A., 2003, A&A, 402, 211
- Hony et al. (2001) Hony S., Waters L. B. F. M., Tielens A. G. G. M., 2001, A&A, 378, L41
- Hony et al. (2002) Hony S., Waters L. B. F. M., Tielens A. G. G. M., 2002, A&A, 390, 533
- Hrivnak et al. (2000) Hrivnak B. J., Volk K., Kwok S., 2000, ApJ, 535, 275
- Hrivnak et al. (2009) Hrivnak B. J., Volk K., Kwok S., 2009, ArXiv e-prints (astro-ph/0902.0077)
- Huffman (1989) Huffman D., 1989, in Allamandola L. J., Tielens A. G. G. M., eds, Interstellar Dust Vol. 135 of IAU Symposium, Pitfalls in Calculating Scattering by Small Particles. p. 329
- Jiang et al. (2005) Jiang B. W., Zhang K., Li A., 2005, ApJL, 630, L77
- Jiang et al. (2009) Jiang B. W., Zhang K., Li A., 2009, Earth, Planets, and Space, in press (astro-ph/0812.2015)
- Jones et al. (1990) Jones A. P., Duley W. W., Williams D. A., 1990, QJRAS, 31, 567
- Justtanont et al. (1996) Justtanont K., Barlow M. J., Skinner C. J., Roche P. F., Aitken D. K., Smith C. H., 1996, A&A, 309, 612
- Kimura et al. (2005) Kimura Y., Ishikawa M., Kurumada M., Tanigaki T., Suzuki H., Kaito C., 2005, Journal of Crystal Growth, 275, 977
- Kimura & Kaito (2003a) Kimura Y., Kaito C., 2003a, Journal of Crystal Growth, 255, 282
- Kimura & Kaito (2003b) Kimura Y., Kaito C., 2003b, MNRAS, 343, 385
- Kimura et al. (2005) Kimura Y., Nuth III J. A., Ferguson F. T., 2005, ApJL, 632, L159
- Koike et al. (1981) Koike C., Hasegawa H., Asada N., Hattori T., 1981, ApSS., 79, 77
- Kraus et al. (1997) Kraus G. F., Nuth III J. A., Nelson R. N., 1997, A&A, 328, 419
- Kwok et al. (2001) Kwok S., Volk K., Bernath P., 2001, ApJL, 554, L87
- Kwok et al. (1997) Kwok S., Volk K., Bidelman W. P., 1997, ApJS., 112, 557
- Kwok et al. (1999) Kwok S., Volk K., Hrivnak B. J., 1999, in Le Bertre T., Lebre A., Waelkens C., eds, IAU Symp. 191: Asymptotic Giant Branch Stars On the Origin of the 21 Micron Feature in Post-AGB Stars. p. 297
- Kwok et al. (2002) Kwok S., Volk K., Hrivnak B. J., 2002, ApJ, 573, 720
- Kwok et al. (1989) Kwok S., Volk K. M., Hrivnak B. J., 1989, ApJ, 345, L51
- Lattimer et al. (1978) Lattimer J. M., Schramm D. N., Grossman L., 1978, ApJ, 219, 230
- Li (2003) Li A., 2003, ApJL, 599, L45
- Li (2008) Li A., 2008, in Mann I., Nakamura A., Mukai T., eds, Small Bodies in Planetary Sciences (Lecture Notes in Physics vol. 758) Optical Properties of Dust. pp 167–188
- Li et al. (2008) Li M. P., Shi Q. J., Li A., 2008, MNRAS, 391, L49
- Nuth et al. (1985) Nuth J. A., Moseley S. H., Silverberg R. F., Goebel J. H., Moore W. J., 1985, ApJL, 290, L41
- Oudmaijer & de Winter (1995) Oudmaijer R. D., de Winter D., 1995, A&A, 295, L43
- Pierson (1996) Pierson H. O., 1996, Handbook of Refractory Carbides and Nitrides: Properties, Characteristics, Processing and Applications. Noyes Publications, Westwood, NJ
- Posch et al. (2004) Posch T., Mutschke H., Andersen A., 2004, ApJ, 616, 1167
- Radwanski & Ropka (2008) Radwanski R. J., Ropka Z., 2008, Physica B Condensed Matter, 403, 1453
- Reddy et al. (2002) Reddy B. E., Lambert D. L., Gonzalez G., Yong D., 2002, ApJ, 564, 482
- Roberts (1961) Roberts W. M., 1961, Trans. Faraday Soc., 57, 99
- Rouleau & Martin (1991) Rouleau F., Martin P. G., 1991, JRASC, 85, 201
- Sourisseau et al. (1992) Sourisseau C., Coddens G., Papoular R., 1992, A&A, 254, L1
- Speck & Hofmeister (2004) Speck A. K., Hofmeister A. M., 2004, ApJ, 600, 986
- Van Winckel & Reyniers (2000) Van Winckel H., Reyniers M., 2000, A&A, 354, 135
- Volk et al. (1999) Volk K., Kwok S., Hrivnak B. J., 1999, ApJL, 516, L99
- Volk et al. (2000) Volk K., Xiong G.-Z., Kwok S., 2000, ApJ, 530, 408
- Von Helden et al. (2000) Von Helden G., Tielens A. G. G. M., van Heijnsbergen D., Duncan M. A., Hony S., Waters L. B. F. M., Meijer G., 2000, Science, 288, 313
- Voshchinnikov & Henning (2008) Voshchinnikov N. V., Henning T., 2008, A&A, 483, L9
- Zhang et al. (2006) Zhang K., Jiang B. W., Li A. G., 2006, Progress in Astronomy (Chinese) 24, 43
- Zhukovska & Gail (2008) Zhukovska S., Gail H.-P., 2008, A&A, 486, 229
| Central Star11footnotemark: 1 | |||||
| /kpc | /K | ||||
| 2.4 | 7250 | 49.2 | 6054 | ||
| Dust Shell11footnotemark: 1 | |||||
| /cm | /cm | /22footnotemark: 2 | |||
| 4.51016 | 9.31016 | 0.16–0.44 | |||
| Abundance of Relevant Elements (X/H, ppm)33footnotemark: 3 | |||||
| Ti | S | Fe | C | O | |
| 0.013 | 4.07 | 3.24 | 447 | 468 | |
| Total Emitted Power in the 21 Band ()11footnotemark: 1 | |||||
| 1.0 | |||||
| Candidate | Element | [X/H]min | [X/H]⋆ | Associated | Pass () or | |
|---|---|---|---|---|---|---|
| Material | X | () | (ppm) | (ppm) | Features | Fail () |
| nano TiC | Ti | 0.38 | 0.197 () | 0.013 | … | |
| fullerenes + Ti | Ti | 0.23 | 8.04 () | 0.013 | … | |
| SiS2 | S | 0.05 | 95.9 () | 4.07 | 16.8 | |
| doped-SiC | Si | 0.25 | 876 () | 8.50 | 11.3 | |
| SiC + SiO2 | Si | 0.21 | 805 () | 8.50 | 8.3, 11.3 | |
| Si + C mixture | Si | … | … | … | 9.5 | |
| Fe2O3 | Fe | 0.09 | 3.05 () | 3.24 | 9.2, 18, 27.5 | |
| Fe3O4 | Fe | 0.06 | 2.92 () | 3.24 | 16.5, 24 | |
| FeO | Fe | 1.07 | 0.576 () | 3.24 | … |