A Spatially Resolved Inner Hole in the Disk around GM Aurigae
Abstract
We present 03 resolution observations of the disk around GM Aurigae with the Submillimeter Array (SMA) at a wavelength of 860 m and with the Plateau de Bure Interferometer at a wavelength of 1.3 mm. These observations probe the distribution of disk material on spatial scales commensurate with the size of the inner hole predicted by models of the spectral energy distribution. The data clearly indicate a sharp decrease in millimeter optical depth at the disk center, consistent with a deficit of material at distances less than 20 AU from the star. We refine the accretion disk model of Calvet et al. (2005) based on the unresolved spectral energy distribution (SED) and demonstrate that it reproduces well the spatially resolved millimeter continuum data at both available wavelengths. We also present complementary SMA observations of CO =32 and =21 emission from the disk at 2″ resolution. The observed CO morphology is consistent with the continuum model prediction, with two significant deviations: (1) the emission displays a larger CO =32/=21 line ratio than predicted, which may indicate additional heating of gas in the upper disk layers; and (2) the position angle of the kinematic rotation pattern differs by from that measured at smaller scales from the dust continuum, which may indicate the presence of a warp. We note that photoevaporation, grain growth, and binarity are unlikely mechanisms for inducing the observed sharp decrease in opacity or surface density at the disk center. The inner hole plausibly results from the dynamical influence of a planet on the disk material. Warping induced by a planet could also potentially explain the difference in position angle between the continuum and CO data sets.
Subject headings:
circumstellar matter — planetary systems: protoplanetary disks — stars: individual (GM Aurigae)1. Introduction
Understanding of the planet formation process is intimately tied to knowledge of the structure and evolution of protoplanetary disks. Of particular importance is how and when in the lifetime of the disk its constituent material is cleared, which provides clues to how and when planets may be assembled. While observations suggest that the inner and outer dust disk disperse nearly simultaneously (e.g. Skrutskie et al., 1990; Wolk & Walter, 1996; Andrews & Williams, 2005), it is not clear which physical mechanism(s) drives this process, or the details of how it progresses. Possible dispersal mechanisms, of which several may come into play over the lifetime of a disk, include a drop in dust opacity due to grain growth (e.g. Strom et al., 1989; Dullemond & Dominik, 2005), photoevaporation of material by energetic stellar radiation (e.g. Clarke et al., 2001), photophoretic effects of gas on dust grains (Krauss & Wurm, 2005), inside-out evacuation via the magnetorotational instability (Chiang & Murray-Clay, 2007), and the dynamical interaction of giant planets with natal disk material (e.g. Lin & Papaloizou, 1986; Bryden et al., 1999). Observing the distribution of gas and dust in disks allows us to evaluate the roles of these disk clearing mechanisms.
One particular class of systems, those with “transitional” disks (e.g. Strom et al., 1989; Skrutskie et al., 1990), have become central to our understanding of disk clearing. These disks exhibit a spectral energy distribution (SED) morphology with a deficit in the near- to mid-infrared excess over the photosphere consistent with a depletion of warm dust near the star. The advent of the Spitzer Space Telescope has allowed detailed measurement of mid-infrared spectra with unprecedented quality and quantity. Combined with simultaneous advances in disk modeling that can now reproduce in detail the SED features (e.g. D’Alessio et al., 1999, 2001; Dullemond et al., 2002; D’Alessio et al., 2006), these observations have revolutionized the study of disk structure. However, such studies rely entirely on SED deficits whose interpretations are not unique, since effects of geometry and opacity can mimic the signature of disk clearing (Boss & Yorke, 1996; Chiang & Goldreich, 1999).
Spatially resolved observations are crucial for confirming the structures inferred from disk SEDs. High resolution imaging at millimeter wavelengths is especially important because dust opacities are low, and the disk mass distribution can be determined in a straightforward way for an assumed opacity. Millimeter observations also avoid many of the complications present at shorter wavelengths, including large optical depths, spectral features, and contrast with the central star. Several recent millimeter studies have resolved inner emission cavities for disks with infrared SED deficits through direct imaging observations, e.g. TW Hya (Calvet et al., 2002; Hughes et al., 2007), LkH 330 (Brown et al., 2007, 2008), and LkCa 15 (Piétu et al., 2007; Espaillat et al., 2008). These observations unambiguously associate infrared SED deficits with a sharp drop in millimeter optical depth in the disk center. More information is needed to determine whether the low optical depth is a result of decreased surface density or opacity.
GM Aurigae is a prototypical example of a star host to a “transitional” disk. The 1-5 Myr old T Tauri star (Simon & Prato, 1995; Gullbring et al., 1998) of spectral type K5 is located at a distance of 140 pc in the Taurus-Auriga molecular complex (Bertout & Genova, 2006), and its brightness and relative isolation from intervening cloud material have enabled a suite of observational studies of its disk properties. The presence of circumstellar dust emitting at millimeter wavelengths was first inferred by Weintraub et al. (1989), and the disk structure was subsequently resolved in the 13CO =2–1 transition by Koerner et al. (1993). Their arcsecond-resolution mapping of the gas disk revealed gaseous material in rotation about the central star. Assuming a Keplerian rotation pattern allowed a determination of the dynamical mass for the central star of 0.8 M☉. Further modeling of the structure and dynamics of the disk was carried out by Dutrey et al. (1998), using higher-resolution 12CO =2–1 observations. Scattered light images revealed a dust disk inclined by 50-56° extending to radii AU from the star (Stapelfeldt & The WFPC2 Science Team, 1997; Schneider et al., 2003).
Efforts to model the SED of GM Aurigae have long indicated the presence of an inner hole, and estimates of its size have grown over the years as the quality of data and models have improved. In the early 1990s, the low 12 m flux led to AU estimates of the inner disk radius (Marsh & Mahoney, 1992; Koerner et al., 1993). That value was later increased to 4.8 AU by Chiang & Goldreich (1999) in the context of hydrostatic radiative equilibrium models, and a putative planet at a distance of 2.5 AU from the star was shown to be capable of clearing an inner hole of this extent using simulations of the relevant hydrodynamics (Rice et al., 2003). With the aid of a ground-based mid-IR spectrum, Bergin et al. (2004) increased the gap size estimate to 6.5 AU, and subsequently Calvet et al. (2005) inferred an inner hole radius of 24 AU using a Spitzer IRS spectrum in combination with sophisticated disk structure models. Recently, Dutrey et al. (2008) have argued for a 194 AU inner hole in the gas distribution, using combined observations of several different molecular line tracers. Like the SED-based measurements, their method is indirect: they use a model of the disk in Keplerian rotation to associate a lack of high-velocity molecular gas with a deficit of material in the inner disk.
We present interferometric observations at 860 m from the Submillimeter Array111The Submillimeter Array is a joint project between the Smithsonian Astrophysical Observatory and the Academica Sinica Institute of Astronomy and Astrophysics and is funded by the Smithsonian Institution and the Academica Sinica. and 1.3 mm from the Plateau de Bure Interferometer222Based on observations carried out with the IRAM Plateau de Bure Interferometer. IRAM is supported by INSU/CNRS (France), MPG (Germany) and IGN (Spain). that probe disk material on scales commensurate with the 24 AU inner disk radius inferred from the SED. These data allow us to directly resolve the inner hole in the GM Aur disk for the first time. We describe the observations in §2 and present the dual-wavelength continuum data in §3.1. We also present observations of the molecular gas disk in the CO =3–2 and =2–1 lines that allow us to study disk kinematics in §3.2. We use these data to investigate disk structure in the context of the SED-based models of Calvet et al. (2005), described in §4. Implications for the disk structure and evolutionary status are discussed in §5.
2. Observations and Data Reduction
The GM Aur disk was observed with the 8-element (each with a 6 m diameter) Submillimeter Array (SMA; Ho et al., 2004) in the very extended (68-509 m baselines) and compact (16-70 m baselines) configurations on 2005 November 5 and 26, respectively. Observing conditions on both nights were excellent, with 1 mm of precipitable water vapor and good phase stability. Double sideband receivers were tuned to a central frequency of 349.935 GHz (857 m), with each 2 GHz-wide sideband centered 5 GHz from that value. The SMA correlator was configured to observe the CO =32 (345.796 GHz) and HCN =43 (354.505 GHz) transitions with a velocity resolution of 0.18 km s-1. No HCN was detected, with a 3 upper limit of 0.9 Jy beam-1 in the 2219 synthesized beam. The observing sequence alternated between GM Aur and the two gain calibrators 3C 84 and 3C 111. The data were edited and calibrated using the MIR software package.333See http://cfa-www.harvard.edu/$∼$cqi/mircook.html. The passband response was calibrated using observations of Saturn (compact configuration) or the bright quasars 3C 273 and 3C 454.3 (very extended configuration). The amplitude scale was determined by bootstrapping observations of Uranus and these bright quasars, and is expected to be accurate at the 10% level. Antenna-based gain calibration was conducted using 3C 111, while the 3C 84 observations were used to check on the quality of the phase transfer. We infer that the “seeing” induced on the very extended observations by phase noise and small baseline errors is small, 01. Wideband continuum channels from both sidebands and configurations were combined. The derived 870 m flux of GM Aur is mJy.
Additional SMA observations in the extended (28-226 m) and sub-compact (6-69 m baselines) configurations were conducted on 2006 December 10 and 2007 September 14, respectively, with a central frequency of 224.702 GHz (1335 m). While the sub-compact observations were conducted in typical weather conditions for this band (2.5 mm of water vapor), the extended data were obtained in better conditions similar to those for the higher frequency observations described above. The correlator was configured to simultaneously cover the =21 transitions of CO (230.538 GHz), 13CO (220.399 GHz), and C18O (219.560 GHz) with a velocity resolution of 0.28 km s-1. The calibrations were performed as above.
GM Aurigae was also observed with the 6-element (each with a 15 m diameter) Plateau de Bure Interferometer (PdBI) in the A configuration (up to 750 m baselines) on 2006 January 15. Observing conditions were excellent, with atmospheric phase noise generating a seeing disk of 0.2″. The PdBI dual-receiver system was set to observe the 110.201 GHz (2.7 mm) and 230.538 GHz (1.3 mm) continuum simultaneously. As with the SMA data, observations alternated between GM Aur and two gain calibrators, 3C 111 and J0528+134. The data were edited and calibrated using the GILDAS package (Pety, 2005). The passband responses and amplitude scales were calibrated with observations of 3C 454.3 and MWC 349, respectively. The derived 1.3 and 2.7 mm fluxes of GM Aur are and mJy.
The standard tasks of Fourier inverting the visibilities, deconvolution with the CLEAN algorithm, and restoration with a synthesized beam were conducted with the MIRIAD software package. A high spatial resolution image of the 860 m continuum emission from the SMA data was created with a Briggs robust = 1.0 weighting scheme for the visibilities, excluding projected baselines k, resulting in a synthesized beam FWHM of at a position angle of 34°. A similar image of the 1.3 mm continuum emission with a synthesized beam FWHM of at a position angle of 35° was generated from the PdBI data using natural weighting (robust = 2.0). Table 1 summarizes the line and continuum observational parameters.
| Continuum | |||||
| Parameter | 12CO =3–2 | 12CO =2–1 | 860 m | 1.3 mm | 2.7 mm |
| Rest Frequency (GHz) | 345.796 | 230.538 | 349.935 | 230.538 | 110.201 |
| Channel Width | 0.18 km s-1 | 0.28 km s-1 | GHz | MHz | 548 MHz |
| Beam Size (FWHM) | 2219 | 2114 | 030024 | 043030 | 093060 |
| PA | 14° | 56° | 34° | 35° | 31° |
| RMS noise (mJy beam-1) | 310 | 90 | 3.5 | 0.75 | 0.25 |
| Peak Flux Density (mJy beam-1) | |||||
| Integrated Continuum Flux (mJy) | – | – | |||
| Integrated Line Intensity (Jy km s-1) | 29 | 37 | – | – | – |
3. Results
3.1. Millimeter Continuum Emission
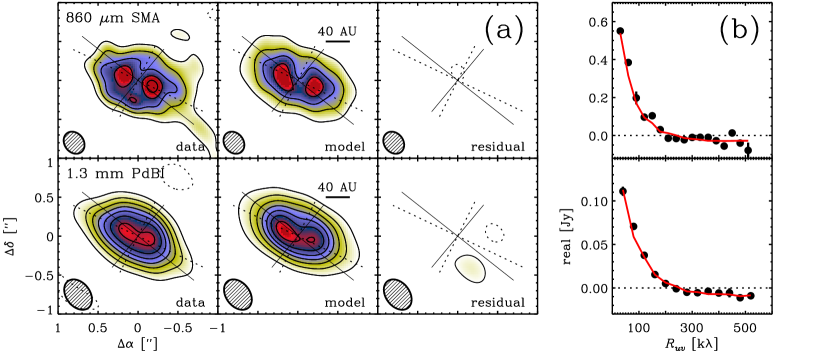
Figure 1 shows the results of the SMA and PdBI continuum observations in both the image and Fourier domains. The presence of an inner hole in the GM Aur disk, as predicted by models of the SED, is clearly indicated both by the double-peaked emission structure in the image and by the null in the visibility data. The double-peaked emission structure points to a deficit of flux near the disk center; the null in the visibility function, or the location at which the real part of the visibilities change sign, similarly reflects a decrease in flux at small angular scales. The resolution of the 2.7 mm data from the PdBI was insufficient to provide about the inner hole.
The maps in the left panel of Fig. 1 show a double-peaked brightness distribution at both wavelengths, with peak flux densities of mJy beam-1 at 860 m and mJy beam-1 at 1.3 mm. For all but the most edge-on viewing geometries (e.g. Wolf et al., 2008), a continuous density distribution extending in to the dust destruction radius (0.05-0.1 AU; Isella et al., 2006) would be expected to result in a centrally-peaked brightness distribution. In the case of GM Aurigae, the double-peaked emission structure is a geometric effect due to the truncation of disk material at a much larger radius, viewed at an intermediate inclination of 50-56∘ (Dutrey et al., 1998, 2008): the region of highest density is near the inner disk edge, with a large column density of optically thin material in this ring effectively generating limb brightening at the inner edge of the outer disk, at two points along the disk major axis.
The size of the inner hole can be roughly estimated by the separation of the emission peaks, although the peak separation will also depend on the brightness of the directly-illuminated inner edge of the outer disk relative to the extended disk component (Hughes et al., 2007). The separation of the peaks in the 860 m image is , corresponding to a physical diameter of AU (radius AU) at a distance of 140 pc. A position angle of 66∘ is estimated by the orientation of a line that bisects the two peaks, although a more robust value of is derived in §4.1 below. Since the peaks are not distinctly separated in the 1.3 mm image, the same estimate cannot be made, but the position angle is clearly consistent with that derived from the 860 m visibilities and indicated by the perpendicular dashed lines in Fig. 1.
The presence of an inner hole is also evident from the visibilities displayed in the right panel of Fig. 1. The real part of the complex visibilities have been averaged in concentric annuli of deprojected distance from the disk center. For details of the deprojection process, see Lay et al. (1997). As discussed in the appendix of Hughes et al. (2007), the presence of a null in the visibility function indicates a sharp decrease in flux at a radius corresponding roughly to the angular scale of the null position. The precise position of the null depends primarily on the angular size of the inner hole, but also on the radial gradients of the surface density and temperature distribution and the relative brightness of the directly illuminated wall at the inner edge of the outer disk. In a standard power-law parameterization, the disk temperature and surface density vary inversely with radius as and . Neglecting the emission from the wall and assuming standard values of and , expected for a typical viscous disk with constant (Hartmann et al., 1998) and consistent with previous studies of the GM Aur disk (Dutrey et al., 1998; Andrews & Williams, 2007; Hughes et al., 2008), we may obtain a rough estimate of the size of the inner hole using the observed null position and Eq. A9 from Hughes et al. (2007): . A polynomial curve fit to the visibilities yields a null position of 190 k at 860 m and 224 k at 1.3 mm, which correspond to inner hole radii of 31 and 26 AU, respectively. However, these estimates are uncertain to within 30%, as the data are consistent with a broad range of null positions. We therefore turn to a more sophisticated modeling procedure described in §4.1 below.
3.2. CO Channel and Moment Maps
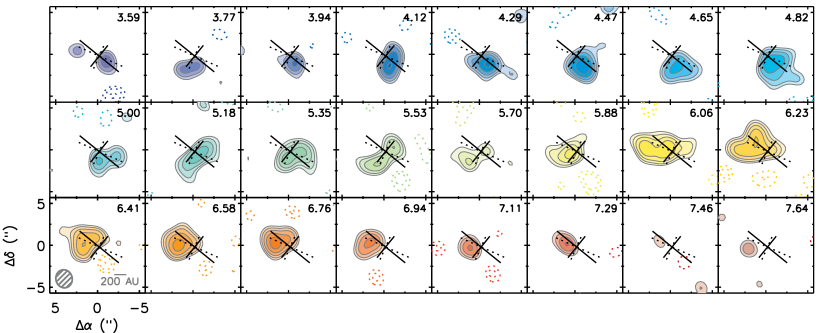
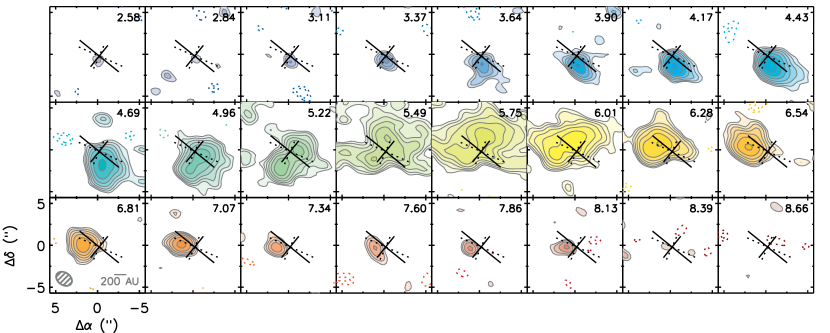
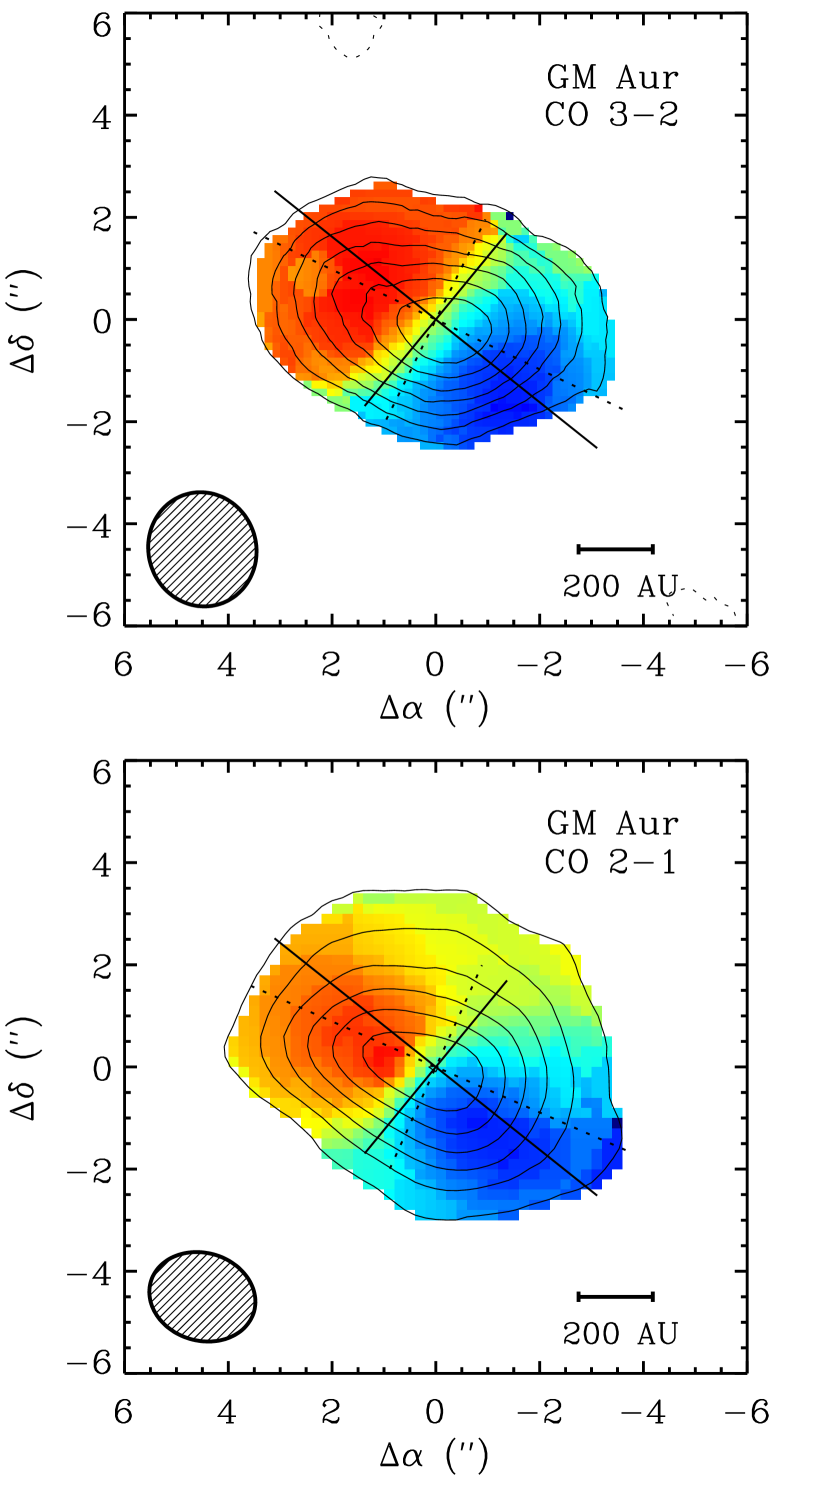
Figures 2–4 display the new SMA observations of CO emission from the GM Aur disk. Figures 2 and 3 show channel maps with contours starting at twice the rms noise level and increasing by factors of , while Figure 4 displays the zeroeth (contours) and first (color) moments of the data: these are the velocity-integrated intensity and intensity-weighted velocities, respectively. The peak flux density is Jy beam-1 in the CO =3–2 line and Jy beam-1 in the CO =2–1 line, with integrated fluxes of 9.4 Jy km s-1 and 21.2 Jy km s-1, respectively (although emission from extended ambient cloud material is likely to increase the CO =2–1 integrated flux over that originating from the disk alone). The channel and moment maps are broadly consistent with the expected kinematic pattern for material in Keplerian rotation about the central star, substantially inclined to our line of sight (as in Dutrey et al., 1998; Simon et al., 2000).
The short-baseline spatial frequencies in the plane provided by the subcompact configuration of the SMA during our observations of the =21 transition are sensitive to emission on the largest spatial scales. These short antenna spacings reveal the severity of the cloud contamination to an extent not possible with previous data. The contamination is evident as an extended halo around the disk emission in the central channels of the =21 channel maps near LSR velocities of 5-6 km s-1 (Fig. 3). It is also evident in the moment map (Fig. 4) as an elongation of emission near the systemic velocity (green-yellow) to the northwest along the disk minor axis. This contamination indicates that caution must be exercised when deriving kinematic information from the CO lines, particularly the central channels. Spatial filtering by the interferometer does not ameliorate cloud contamination in an abundant, easily-excited, high-optical depth tracer like CO=2–1. The =32 line appears less contaminated than =21 (Figs. 2 and 4), although similarly short antenna spacings (8-43 m) are not present in this data set. Nevertheless, we expect less cloud contamination in the =32 transition, since the temperature of the cloud will be lower than that of the disk and will therefore populate the upper rotational levels of the CO molecule less efficiently. The cloud contamination prevents detection of self-absorption in the central channels of the CO =2–1 channel maps along the near (northwest) edge of the disk (as determined by scattered light observations; see Schneider et al., 2003). Dutrey et al. (1998) report self-absorption along the southeast edge, but our observations suggest that this brightness asymmetry may be due to cloud contamination. It is also possible that the contamination is due to a residual envelope, although we are unable to determine the large-scale structure of the extended line emission with our interferometric data.
In all figures, the disk orientation based on the position angle of 64° derived from the continuum emission (Fig. 1 and §4.1) is plotted over the CO emission as a set of crossed dashed lines, with the relative extent of the major and minor axes (based on the inclination angle of 55°) indicated by the length of the perpendicular lines. The position angle of 51° derived by Dutrey et al. (1998) from fitting the CO =21 emission, consistent with our own =32 and =21 observations, is illustrated by the solid line. Note that the position angle of the CO emission differs slightly from the position angle of the continuum emission, by (see §4.1). The trend is clear for both transitions, but more obvious in the less-contaminated =32 transition. Note that the position angle for the CO emission is derived entirely from the rotation pattern (evident in the isovelocity contours) and not from the geometry of the integrated CO emission: the integrated emission appears to match the position angle from the continuum emission reasonably well. We do not observe the isophote twisting in integrated CO emission seen by Dutrey et al. (1998). The cloud contamination and differences in antenna spacings may play a role.
4. Disk Structure Models
4.1. Updated SED Model
Here we revisit the broadband SED modeling of GM Aur presented by Calvet et al. (2005). Taking into consideration new observational constraints at sub-millimeter and millimeter wavelengths, we use the irradiated accretion disk models of D’Alessio et al. (2005, 2006) to re-derive the properties of the outer disk of GM Aur and its inner, truncated edge or “wall.” Our grain-size distribution follows a power-law of , where is the grain radius. We assume ISM-sized grains in the upper layers of the disk and accordingly adopt =0.005 m and =0.25 m (Draine & Lee, 1984). Closer to the disk midplane grains have a maximum size of 1 mm. Input parameters for the outer disk include the stellar properties, the mass accretion rate, the viscosity parameter (), and the settling parameter () which measures the dust-to-gas mass ratio in the upper layers of the disk relative to the standard dust-to-gas mass ratio. Following Calvet et al. (2005), we adopt the same extinction, distance, inclination, dust grain opacities, and stellar properties (i.e. luminosity, radius, and temperature; see Table 2). We use a mass accretion rate of 7.210-9 yr-1 which was derived using HST STIS spectra by Ingleby & Calvet (2009), in contrast to the value of M☉ yr-1 derived from veiling measurements in Calvet et al. (2005). We assume an outer disk radius of 300 AU, which matches the observed extent of scattered light from the dust disk (Schneider et al., 2003) and previous fits to the continuum emission (Hughes et al., 2008), as well as the short-baseline data presented here.
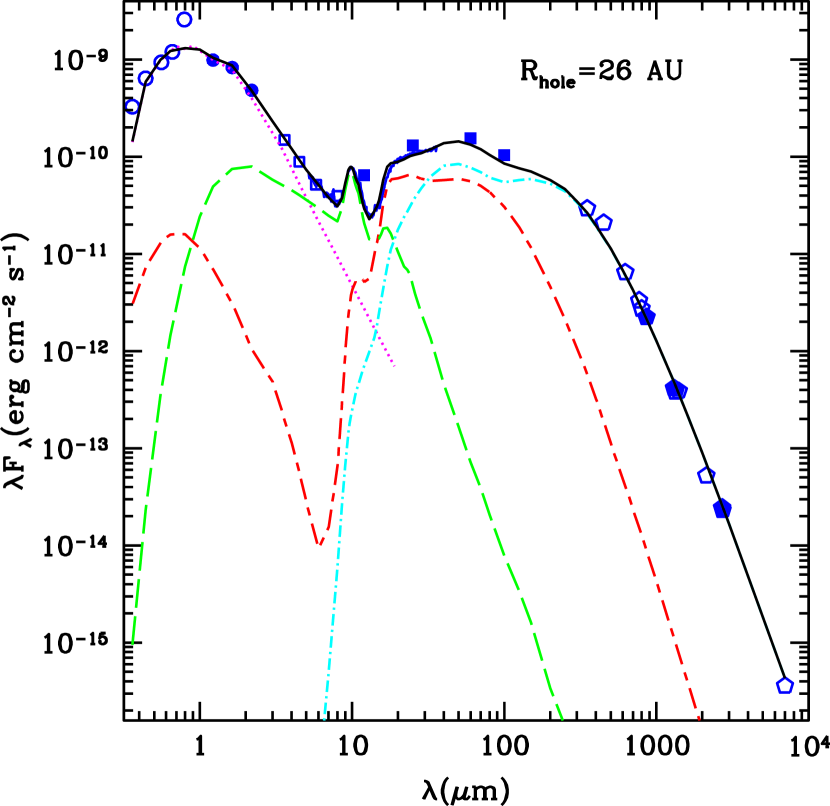
In order to reproduce the outer disk component of the SED, we vary and (Figure 5). As described in (Calvet et al., 2005), effectively determines the mass surface density distribution and therefore the disk mass, which is best reflected by the longest-wavelength SED points. The value of has the greatest effect on the slope of the SED beyond 100 m. With the new millimeter data we find =0.5, indicating less settling than reported previously. We also find =0.002 and a more massive outer disk of 0.16 . This mass is significantly larger than an estimate based on the 860 m and 1.3 mm flux measurements using opacities from Beckwith et al. (1990), which yields 0.04 M☉, and is only marginally Toomre stable at 300 AU (Q1.1). The outer disk model uses an opacity of 0.1 cm2 g-1 at 1 mm (D’Alessio et al., 2001) which is about four times lower than that derived from the Beckwith et al. (1990) opacities, accounting for the discrepancy in mass. Within the inner disk hole, there are 1.110-11 of optically thin small dust grains, which account for the 10 m emission and the near-IR excess. The mass in solids could be much larger than this mass if pebbles, rocks, or even planetesimals have grown in the inner disk, since they would have a negligible opacity in the near-IR. We note that Calvet et al. (2005) reports the mass of the dust as 710-10 ; this is actually the mass of the gas within the hole, assuming the standard dust to gas mass ratio. The gas mass could be significantly larger, depending on the total amount of solids and the actual ratio, but these are poorly constrained by existing data.
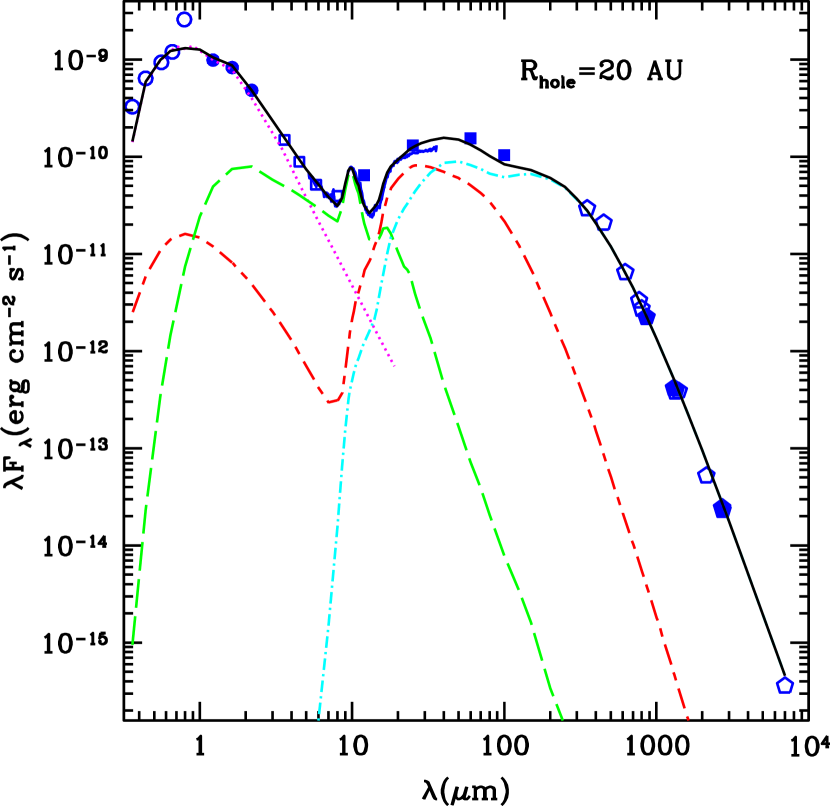
We vary the temperature of the wall to best reproduce the data. The radius of the wall is set by the temperature and dust composition, and the wall’s height is set by the disk scale height. We assume that the wall is axisymmetric and composed of relatively small grains, as well as vertically flat in order to reproduce the rapid rise of the mid-IR excess at wavelengths beyond 10 m. We adopt the dust composition used in D’Alessio et al. (2005) and Calvet et al. (2005). The maximum grain size is adjusted from ISM sizes to reproduce the shape of the IRS spectrum as necessary. At short wavelengths, larger grains have smaller opacities than ISM-sized grains. Therefore, at a given temperature large grains will be at smaller radii than ISM-sized grains as per Eqn. 12 of D’Alessio et al. (2005). The derived size of the inner hole varies somewhat depending on whether the SED or the resolved millimeter visibilities are included. Fitting only the broadband SED and neglecting the resolved millimeter-wavelength data, the wall is located at 26 AU and has a temperature of 130K and a height of 2 AU with maximum grain size =0.25 m (Fig. 5, left panel). The radius of the wall differs by 2 AU from Calvet et al. (2005), since here we take assuming magnetospheric accretion while Calvet et al. (2005) uses as per the boundary layer model. We also adopt a different mass accretion rate.
In order to compare the SED model with the resolved continuum data, it is necessary to fix the disk geometry. As listed in Table 2, we adopt an inclination of 55∘, in order to maintain consistency with Calvet et al. (2005). However, the position angle is poorly reproduced by the value of that is the weighted average of fits to the CO emission (Dutrey et al., 1998, 2008, see Fig. 1). To derive a more appropriate position angle, we generate a sky-projected image from the disk model and use the MIRIAD task uvmodel to sample the image at the same spatial frequencies as the data. We compare these model visibilities with the observed 860 m visibilities (which have the finest resolution). We repeat this process for a range of position angles and calculate a value comparing each set of model visibilities with the data. Using this method, we fit a position angle of , which differs by from the position angle of the CO disk derived by Dutrey et al. (1998, 2008).
When considering the resolved millimeter-wavelength visibilities, a disk with a 20 AU hole reproduces the emission much better (Fig. 5, right panel, and Fig. 1, center panels). Using the same comparison of visibilities as described in the previous paragraph, the 20 AU model represents a 3 improvement over the 26 AU model, which significantly underpredicts the amount of flux produced close to the star. This 20 AU hole has a wall with a temperature of 120 K, a height of 1.4 AU, and maximum grain size =5 m. For neither the 20 AU nor the 26 AU model does the wall contribute significant continuum emission at the wavelengths and spatial scales probed by our data. The main discrepancy between the fits to the SED and the millimeter visibilities occurs between wavelengths of 20–40 m where the 20 AU hole model overpredicts the flux. However, the SED morphology in this region is likely sensitive to the properties of the wall at the inner disk edge, which are not well known and are not constrained by our data. It is also possible that the composition of the grains, particularly whether the silicate and graphite form composite grains or are separated, can affect the temperature and therefore the mid-IR morphology of the wall component of the SED (D’Alessio et al., 2009, in prep). Since our focus is on the interferometric millimeter-wavelength data, we adopt the model with a 20 AU inner hole for the remainder of the analysis. Figure 1 compares this model with the data in the image plane (center panel) and in the visibility domain (red line in the right panel). The agreement is excellent, and the residuals are less than 3 within the 2″ box shown.
The flux density of the eastern peak of the 860 m image is 50 mJy beam-1, while that of the western peak is 59 mJy beam-1. The corresponding peaks in the model images are 49 and 50 mJy beam-1, respectively. Given the rms noise of 3.5 mJy beam-1, these values are consistent with no flux difference and hence axially symmetric emission from the inner disk edge. The positional accuracy of the data and knowledge of the stellar proper motion are insufficient to determine whether or not the emission peaks are equally offset from the star. This result may be contrasted with the strong asymmetries observed by Brown et al. (2008) in their observations of the inner hole in LkH 330, although these data are missing short antenna spacings present in the GM Aur data that may dilute asymmetries. However, as in the case of LkH 330, we find that the GM Aur continuum presents a sharp contrast in brightness between the inner and outer disk, reflected by the null in the visibility function and the strong agreement between the data and the model containing an inner hole. The M☉ of dust within the central hole in the model implies a reduction in the mass surface density of small grains of at least 6 orders of magnitude at 1 AU relative to a continuous model of the dust disk, indicating that the data are consistent with an inner disk region that is essentially completely evacuated of small grains.
| Star1 | |
|---|---|
| ……………… | 1.1 |
| ……………… | 1.5 |
| ……………… | 4730 |
| ……………… | 7.9 10-9 |
| Distance (pc)……………… | 140 |
| ……………… | 1.2 |
| Inclination (deg)……………… | 55 |
| Optically Thick Wall2 | |
| ……………… | 20 (26) |
| (m)1……………… | 0.005 |
| (m)3……………… | 5 (0.25) |
| 3……………… | 120 (130) |
| ……………… | 1.4 (2) |
| Optically Thick Outer Disk | |
| 1……………… | 300 |
| 3……………… | 0.5 |
| 3……………… | 0.002 |
| ……………… | 0.16 |
4.2. Comparison with CO Observations
In order to compare the gas and dust properties of the GM Aur disk, we used the SED-based model described above to generate predicted CO =32 and =21 emission. We assume that gas and dust are well mixed, with a uniform gas-to-dust mass ratio of 100 (neglecting the complication of dust settling) and a constant CO abundance relative to H2 of 10-6, which is required to reproduce the peak CO =21 flux. We also add microturbulence with a FWHM of 0.17 km s-1 throughout the outer disk, as derived by Dutrey et al. (1998). This is comparable to the 0.18 km s-1 spectral resolution of the data and does not affect our determination of the disk geometry. Due to the position angle differences evident between the continuum emission in Fig. 1 and the central channels in Fig. 2, we also adjust the position angle to 51° (as in Dutrey et al., 1998). Finally, we note that with an outer radius of 300 AU, the continuum model severely underpredicts the CO emission at large radii, as expected for a model with a sharp cutoff at its outer edge (Hughes et al., 2008). We therefore extrapolate the model to 525 AU to match the spatial extent of the CO emission (Dutrey et al., 1998). While this larger CO model no longer matches perfectly the continuum emission for the shortest baselines, based on the prediction assuming a constant gas-to-dust mass ratio, it retains the kinematic and thermal structure of the small-scale continuum model. In order to consistently solve for the level populations and generate sky-projected images in the CO lines, we use the Monte Carlo radiative transfer code RATRAN (Hogerheijde & van der Tak, 2000). We then use the MIRIAD task uvmodel to sample the model image at identical spatial frequencies to those present in our interferometric CO data set.
Figure 6 compares the predicted CO emission from the extended SED model (right) with the observed emission from the GM Aur disk (left) for the =21 (top) and =32 transitions. It is clear that the velocity pattern in the disk is consistent with Keplerian rotation (as previously noted by Koerner et al., 1993; Dutrey et al., 1998), and that the SED-based model is capable of reproducing the basic morphology of the CO emission.
The primary difference between data and model is the CO =3–2/=2–1 line ratio: the disk structure model that reproduces the peak flux density of the =21 transition underpredicts the peak =32 flux by 30%. This difference may be attributed to a 10 K difference in temperature between the gas and dust in the upper layers of the GM Aur disk that are probed by these optically thick CO lines. While the vertical temperature gradient of the dust in the model is fixed by the SED, a relative increase in gas temperature would populate the upper rotational transition of the molecule more efficiently and produce more =32 emission relative to =21. The temperature and the CO abundance are also somewhat interdependent, since the CO abundance sets the vertical location, and therefore the temperature, of the =1 surface from which most of the line emission originates. An increase in temperature would therefore also vary the anomalously low CO/H2 ratio necessary to reproduce the =21 flux. Such line ratio differences have been previously observed in the disk around TW Hya (Qi et al., 2004, 2006), and may be due to additional heating of gas in the upper disk by such processes as x-ray and UV irradiation, dissociative or mechanical heating (e.g. Glassgold et al., 2004; Kamp & Dullemond, 2004; Nomura et al., 2007)
Nevertheless, while the flux levels vary between the data and model prediction, the similarity in morphology makes it clear that the overall disk structure is consistent between the molecular gas traced by CO and the model based on dust traced by continuum emission and the SED. The only other significant difference between the two is in the position angle of the emission, which differs by 11°. The implications of this result are discussed in §5.2 below.

5. Discussion
5.1. Inner Disk Clearing
The resolved millimeter continuum observations of the GM Aur system are consistent with the prediction from the SED model. Models of the observed 860 m and 1.3 mm maps in conjunction with the SED and Spitzer IRS spectrum, give a value of 20 AU for the extent of this inner cleared region. The inference of an inner hole of this size from the SED and resolved millimeter visibilities is consistent with recent millimeter-wave observations of rotational transitions of CO isotopologues from the GM Aur disk that provide spectroscopic evidence for a diminished density of cold CO within 20 AU (Dutrey et al., 2008). However, other observations indicate that this region cannot be entirely devoid of gas. Salyk et al. (2007) detect CO rovibrational emission originating from hot gas at radii near AU, from which they infer a total gas mass in the inner disk of . Measurements of the H linewidth imply an accretion rate of yr-1 (White & Ghez, 2001; Ingleby & Calvet, 2009); accretion at this rate requires a steady supply of gas from the inner disk. The SED model also requires lunar masses of dust in the inner disk, to account for the 10 m silicate feature and slight near- to mid-IR excess (Calvet et al., 2005).
A wide variety of mechanisms has been invoked to explain the low optical depth of the central regions of transition disks (see e.g. Najita et al., 2007, and references therein), each with different implications for planet formation and the process of evolution between the primordial and debris disk stages. The available measurements of properties of the inner hole in the GM Aur disk allow us to evaluate the plausibility of each mechanism as the driver of disk clearing in this system.
Grain Growth – The agglomeration of dust into larger particles should proceed faster in central regions where relative velocities of particles are faster and surface densities are higher. This would produce a drop in opacities associated only with the inefficiency of emission of large grains at the observed wavelengths (e.g. Strom et al., 1989; Dullemond & Dominik, 2005). However, this process is inconsistent with the clearing of CO from the central region observed by Dutrey et al. (2008), as grain growth should proceed without diminishing the gas density. Grain growth is also somewhat inconsistent with the steep submillimeter slope observed by Rodmann et al. (2006) for the GM Aur system. The value inferred for the millimeter wavelength slope of 3.2 is the steepest in their sample of ten T Tauri stars, and is typical of a grain population that has undergone little growth, with grain size mm. Furthermore, the original SED model and the submillimeter visibilities both independently indicate a sharp decrease in surface density or opacity near 24 AU, while grain growth and dust settling are predicted to be a continuous process and so should display a more gradual transition between the inner and outer disk (Weidenschilling et al., 1997; Dullemond & Dominik, 2005).
Photoevaporation – Another proposed process to generate inside-out clearing of protoplanetary disks is photoevaporation via the “UV switch” mechanism (Clarke et al., 2001). In this scenario, high-energy photons from the star heat the upper disk layers, allowing material to escape the system at a rate that gradually diminishes the disk mass, while most of the disk mass drains onto the star via viscous accretion (e.g. Hartmann et al., 1998). Once the photoevaporation rate matches the accretion rate near 1 AU and prevents resupply of material from the outer disk, the inner disk will decouple and drain onto the star within a viscous timescale, leaving an evacuated central region surrounded by a low-mass outer disk that will then rapidly disperse. As noted by Alexander & Armitage (2007), the properties of the GM Aur system are inconsistent with a photoevaporative scenario because the large mass of the outer disk should still be sufficient to provide a substantial accretion rate to counteract the photoevaporative wind. Furthermore, the measured accretion rate is high enough that within the framework of the photoevaporation scenario, it would only be observed during the brief period of time when the inner disk was draining onto the star. Photoevaporation may yet play a role in clearing the outer disk of its remaining gas and dust, but it cannot explain the current lack of inner disk material.
Inside-Out MRI Clearing – The magnetorotational instability operating on the inner disk edge may also drive accretion and central clearing, although it should be noted that this is purely an evacuation mechanism: it can only take hold after the generation of a gap by some other means. Nevertheless, given the creation of a gap, MRI clearing is predicted to operate in systems like GM Aur whose outer disks are still too massive for photoevaporation to dominate (Chiang & Murray-Clay, 2007). The observed depletion of CO interior to 20 AU radius (Dutrey et al., 2008) is consistent with this theory, which predicts a total gas mass depletion of order 1000 interior to the rim radius relative to the extrapolated value from the outer disk power law fit, normalizing to the total disk mass of 0.16. This theory is consistent with the substantial accretion rate of the GM Aur system, yielding a value of of 0.005, only slightly greater than the derived value of 0.002 from the model. Salyk et al. (2007) estimate a gas-to-dust ratio of in the inner disk, roughly 10 times greater than that of the outer disk, which is consistent with the prediction of the inside-out MRI evaporation scenario that flux from the star should promote blowout of small dust grains by radiation pressure, substantially clearing the inner disk of dust even as the gas continues to accrete onto the star. However, it is difficult to reconcile this with the substantial population of m-size grains that must be present in the inner disk to account for the 10 m silicate feature in the IRS spectrum. It is also important to consider the source of the requisite initial gap in the disk.
Binarity – The dynamical influence of an unseen stellar or substellar companion would also cause clearing of the inner disk. A notable example is the recent result by Ireland & Kraus (2008) demonstrating that the inner hole in the transition disk around CoKu Tau/4 is caused by a previously unobserved companion. There are relatively few constraints on the multiplicity of GM Aur at the AU separations relevant for the inner hole. Radial velocity studies with km s-1 precision do not note variability (Bouvier et al., 1986; Hartmann et al., 1986), ruling out a close massive companion. As Dutrey et al. (2008) discuss, the stellar temperature and dynamical mass from the disk rotation combined with the H-band flux place an upper limit of 0.3 M☉ on the mass of a companion. Interferometric aperture-masking observations with NIRC2 that take advantage of adaptive optics on the Keck II telescope place an upper limit of 40 times the mass of Jupiter on companions with separations between 1.5 and 35 AU from the primary (A. Kraus and M. Ireland, private communication). The presence of hot CO in the central 1 AU of the system (Salyk et al., 2007) and the high accretion rate, undiminished relative to the Taurus median, also argue against the presence of a massive close companion. A stellar companion is therefore an unlikely origin for the central clearing in the GM Aur system.
Planet-Disk Interaction – Perhaps the most compelling mechanism for producing a transition disk is the dynamic clearing of material by a giant planet a few times the mass of Jupiter. The opening of gaps and holes in circumstellar disks has long been predicted as a consequence of giant planet formation (e.g. Lin & Papaloizou, 1986; Bryden et al., 1999). Some simulations have shown that inner holes may in fact be a more common outcome than gaps as angular momentum transfer mediated by spiral density waves can clear the inner disk faster than the viscous timescale (Varnière et al., 2006; Lubow & D’Angelo, 2006). The planet-induced clearing scenario was considered in detail for GM Aur by Rice et al. (2003) and found to be globally consistent with the observed properties of the system (although their estimate of the inner hole radius is based on pre-Spitzer SED information). This mechanism naturally explains the diminished but persistent accretion rates and presence of small dust grains through two predictions of models of planet-disk interaction: (1) filtration of dust grains according to size is expected at the inner disk edge, leading to a dominant population of small grains in the inner disk (Rice et al., 2006); and (2) a sustained reduction in accretion rate to of that through the outer disk is predicted as the giant planet begins to intercept most of the accreting material (Lubow & D’Angelo, 2006). These effects combined may also explain the enhanced gas-to-dust ratio in the inner disk. A planet-induced gap could also serve as a catalyst for inside-out MRI clearing Chiang & Murray-Clay (2007).
Given the observed 20 AU inner disk radius and the scenario of clearing via dynamical interaction with a giant planet, it is possible to make a simple estimate of the distance of the planet from the star. The width of a gap opened by a planet is approximately Roche radii (Artymowicz, 1987), and simulations show that the minimum mass necessary to open a gap is of order 1 Jupiter mass (e.g. Lin & Papaloizou, 1993; Edgar et al., 2007). If the outer edge of the planet-induced gap coincides with the 20 AU inner disk radius (with the portion of the disk interior to the planet cleared via spiral density waves or the MRI), then a companion between 1 and 40 times the mass of Jupiter would be located between 11 and 16 AU from the star. The influence of a planet carving out an inner cavity in the dust distribution is therefore a plausible scenario, bolstered by recent results demonstrating that a planet is responsible for dynamical sculpting of dust in the much older Fomalhaut system (Kalas et al., 2008).
5.2. Evidence for a Warp?
While the model comparison in §4 above shows that CO emission from the disk is globally consistent with Keplerian rotation, the 11° difference in position angle between the continuum data and the two CO data sets is significant at the level, and may indicate some kinematic deviation from pure Keplerian rotation in a single plane. Changes in position angle with physical scale are commonly interpreted as warps in the context of studies of galaxy dynamics (e.g. Rogstad et al., 1974); it may be that the change in position angle in the GM Aur disk indicates a kinematic warp.
The possibility of a warp or other deviation from Keplerian rotation was discussed by Dutrey et al. (1998), although their discussion was based on possible isophote twisting observed in integrated CO =21 contours. We observe no such isophote twisting in the integrated CO =2–1 or =3–2 emission presented here (Fig. 4), although this determination may be influenced by the differing baseline lengths and beam shapes in the respective interferometric data sets. Instead, we observe deviations from the expected position angle only in the rotation pattern of the resolved CO emission, which is reflected in the isovelocity contours of Fig. 4. This position angle change does not appear to be related to the cloud contamination, as it is more clear in the less-contaminated CO =32 data set. In order to test whether the position angle of the true brightness distribution might have been altered by incomplete sampling of the data in the Fourier domain, we generated a model of the disk at a position angle of 64°, consistent with that measured independently for the two continuum data sets. We then fit the position angle by minimization as in §4.1 above. With this method, after sampling with the response at the spatial frequencies in the CO =3–2 data set, we recover the position angle to within less than a degree of the input model. This is to be expected, since the fitting procedure takes into account the interferometer response when fitting for the position angle. The position angle change is therefore robust independent of beam convolution effects.
In order to cause a change in position angle on physical scales between those probed by the continuum ( AU) and the CO ( AU), a warp would have to occur at a size scale of order 100 AU. The most natural explanations for the presence of a warp in a gas-rich circumstellar disk include flybys and perturbations by a planet or substellar companion. A simple estimate of the timescale of flyby interactions is , where is the number density of stars, is the approach distance, and is the velocity dispersion. Assuming typical values for Taurus, including a stellar density of 10 pc-3 (e.g. Gomez et al., 1993) and velocity dispersion of 0.2 km s-1 (Kraus & Hillenbrand, 2008), the timescale for interactions at distances of 1000 AU, sufficient to cause significant perturbations at Oort Cloud radii (Scholl et al., 1982), is of order 1 Gyr. Since the results of a one-time perturbation would likely damp in a few orbital periods (103 yr at a distance of 100 AU), such an interaction is statistically unlikely. However, it should be noted that a recent interaction might have been capable of producing an extended feature like the “blue ribbon” observed in scattered light by Schneider et al. (2003).
The influence of a massive planet or substellar companion has been investigated as the origin of warps observed in gas-depleted debris disks, including Pic (Mouillet et al., 1997) and HD 100546 (Quillen, 2006). However, there is a dearth of theoretical investigation into the plausibility of warps caused by planetary systems in gas-rich disks more closely analogous to the GM Aur system. Since the warp in the GM Aur disk must occur between the Hill sphere of the putative planet and the 200 AU resolution of the CO line observations, it is plausible that the warp could be due to the gravitational influence of the same body responsible for evacuating the inner disk. A theoretical inquiry into this possibility would be useful, but is beyond the scope of this paper.
6. Conclusions
Spatially resolved observations in millimeter continuum emission, obtained using the SMA at 860 m and PdBI at 1.3 mm, reveal a sharp decrease in optical depth near the center of the GM Aur disk. Simple estimates of the extent of this region, based on the separation of peaks in the continuum images and the position of the null in the visibility functions in Fig. 1, are consistent with the inner hole radius of 24 AU derived by Calvet et al. (2005) using disk structure models to fit the SED. No significant azimuthal asymmetry is detected in the continuum emission.
Refined versions of the SED-based model of Calvet et al. (2005) show that the data are very well reproduced by a disk model with an inner hole of radius 20 AU. This model overpredicts the broadband SED flux in the 20–40 m wavelength regime, but this region of the spectrum likely depends on the properties of the wall at the inner disk edge, which are poorly constrained by available data.
CO emission in the =32 and =21 transitions confirms the presence of a disk with kinematics consistent with Keplerian rotation about the central star, but at a position angle offset from the continuum by 11°. The morphology of the CO emission is broadly consistent with the SED model, but with a larger CO =3–2/=2–1 line ratio than predicted for the SED model. This is a likely indication of additional gas heating relative to dust in the upper disk atmosphere.
Given the observed properties of the GM Aur system, photoevaporation, grain growth, and binarity are unlikely physical mechanisms for inducing a sharp decrease in opacity or surface density at the disk center. The inner hole plausibly results from the dynamical influence of a planet on the disk material, with the inner disk possibly cleared by spiral density waves or the MRI. While a recent flyby is statistically unlikely, warping induced by a planet could also explain the difference in position angle between the continuum and CO data sets.
References
- Alexander & Armitage (2007) Alexander, R. D. & Armitage, P. J. 2007, MNRAS, 375, 500
- Andrews & Williams (2005) Andrews, S. M. & Williams, J. P. 2005, ApJ, 631, 1134
- Andrews & Williams (2007) —. 2007, ApJ, 659, 705
- Artymowicz (1987) Artymowicz, P. 1987, Icarus, 70, 303
- Beckwith & Sargent (1991) Beckwith, S. V. W. & Sargent, A. I. 1991, ApJ, 381, 250
- Beckwith et al. (1990) Beckwith, S. V. W., Sargent, A. I., Chini, R. S., & Guesten, R. 1990, AJ, 99, 924
- Bergin et al. (2004) Bergin, E., et al. 2004, ApJ, 614, L133
- Bertout & Genova (2006) Bertout, C. & Genova, F. 2006, A&A, 460, 499
- Boss & Yorke (1996) Boss, A. P. & Yorke, H. W. 1996, ApJ, 469, 366
- Bouvier et al. (1986) Bouvier, J., Bertout, C., Benz, W., & Mayor, M. 1986, A&A, 165, 110
- Brown et al. (2007) Brown, J. M., et al. 2007, ApJ, 664, L107
- Brown et al. (2008) Brown, J. M., Blake, G. A., Qi, C., Dullemond, C. P., & Wilner, D. J. 2008, ApJ, 675, L109
- Bryden et al. (1999) Bryden, G., Chen, X., Lin, D. N. C., Nelson, R. P., & Papaloizou, J. C. B. 1999, ApJ, 514, 344
- Calvet et al. (2002) Calvet, N., D’Alessio, P., Hartmann, L., Wilner, D., Walsh, A., & Sitko, M. 2002, ApJ, 568, 1008
- Calvet et al. (2005) Calvet, N., et al. 2005, ApJ, 630, L185
- Chiang & Murray-Clay (2007) Chiang, E. & Murray-Clay, R. 2007, Nature Physics, 3, 604
- Chiang & Goldreich (1999) Chiang, E. I. & Goldreich, P. 1999, ApJ, 519, 279
- Clarke et al. (2001) Clarke, C. J., Gendrin, A., & Sotomayor, M. 2001, MNRAS, 328, 485
- D’Alessio et al. (2001) D’Alessio, P., Calvet, N., & Hartmann, L. 2001, ApJ, 553, 321
- D’Alessio et al. (2006) D’Alessio, P., Calvet, N., Hartmann, L., Franco-Hernández, R., & Servín, H. 2006, ApJ, 638, 314
- D’Alessio et al. (1999) D’Alessio, P., Calvet, N., Hartmann, L., Lizano, S., & Cantó, J. 1999, ApJ, 527, 893
- D’Alessio et al. (2005) D’Alessio, P., et al. 2005, ApJ, 621, 461
- D’Alessio et al. (2009, in prep) D’Alessio, P. et al. 2009, in prep
- Draine & Lee (1984) Draine, B. T. & Lee, H. M. 1984, ApJ, 285, 89
- Dullemond & Dominik (2005) Dullemond, C. P. & Dominik, C. 2005, A&A, 434, 971
- Dullemond et al. (2002) Dullemond, C. P., van Zadelhoff, G. J., & Natta, A. 2002, A&A, 389, 464
- Dutrey et al. (2008) Dutrey, A., et al. 2008, A&A, 490, L15
- Dutrey et al. (1998) Dutrey, A., Guilloteau, S., Prato, L., Simon, M., Duvert, G., Schuster, K., & Menard, F. 1998, A&A, 338, L63
- Edgar et al. (2007) Edgar, R. G., Quillen, A. C., & Park, J. 2007, MNRAS, 381, 1280
- Espaillat et al. (2008) Espaillat, C., Calvet, N., Luhman, K. L., Muzerolle, J., & D’Alessio, P. 2008, ApJ, 682, L125
- Fleming et al. (2000) Fleming, T. P., Stone, J. M., & Hawley, J. F. 2000, ApJ, 530, 464
- Glassgold et al. (2004) Glassgold, A. E., Najita, J., & Igea, J. 2004, ApJ, 615, 972
- Gomez et al. (1993) Gomez, M., Hartmann, L., Kenyon, S. J., & Hewett, R. 1993, AJ, 105, 1927
- Gullbring et al. (1998) Gullbring, E., Hartmann, L., Briceno, C., & Calvet, N. 1998, ApJ, 492, 323
- Hartmann et al. (1998) Hartmann, L., Calvet, N., Gullbring, E., & D’Alessio, P. 1998, ApJ, 495, 385
- Hartmann et al. (1986) Hartmann, L., Hewett, R., Stahler, S., & Mathieu, R. D. 1986, ApJ, 309, 275
- Hartmann et al. (2005) Hartmann, L., Megeath, S. T., Allen, L., Luhman, K., Calvet, N., D’Alessio, P., Franco-Hernandez, R., & Fazio, G. 2005, ApJ, 629, 881
- Ho et al. (2004) Ho, P. T. P., Moran, J. M., & Lo, K. Y. 2004, ApJ, 616, L1
- Hogerheijde & van der Tak (2000) Hogerheijde, M. R. & van der Tak, F. F. S. 2000, A&A, 362, 697
- Hughes et al. (2007) Hughes, A. M., Wilner, D. J., Calvet, N., D’Alessio, P., Claussen, M. J., & Hogerheijde, M. R. 2007, ApJ, 664, 536
- Hughes et al. (2008) Hughes, A. M., Wilner, D. J., Qi, C., & Hogerheijde, M. R. 2008, ApJ, 678, 1119
- Ingleby & Calvet (2009) Ingleby, L. & Calvet, N. 2009, ApJ, submitted
- Ireland & Kraus (2008) Ireland, M. J. & Kraus, A. L. 2008, ApJ, 678, L59
- Isella et al. (2006) Isella, A., Testi, L., Natta, A. 2006, A&A, 451, 951
- Kalas et al. (2008) Kalas, P., et al. 2008, ArXiv e-prints
- Kamp & Dullemond (2004) Kamp, I. & Dullemond, C. P. 2004, ApJ, 615, 991
- Kenyon & Hartmann (1995) Kenyon, S. J. & Hartmann, L. 1995, ApJS, 101, 117
- Kitamura et al. (2002) Kitamura, Y., Momose, M., Yokogawa, S., Kawabe, R., Tamura, M., & Ida, S. 2002, ApJ, 581, 357
- Koerner et al. (1993) Koerner, D. W., Sargent, A. I., & Beckwith, S. V. W. 1993, Icarus, 106, 2
- Kraus & Hillenbrand (2008) Kraus, A. L. & Hillenbrand, L. A. 2008, ApJ, 686, L111
- Krauss & Wurm (2005) Krauss, O. & Wurm, G. 2005, ApJ, 630, 1088
- Lay et al. (1997) Lay, O. P., Carlstrom, J. E., & Hills, R. E. 1997, ApJ, 489, 917
- Lin & Papaloizou (1986) Lin, D. N. C. & Papaloizou, J. 1986, ApJ, 309, 846
- Lin & Papaloizou (1993) Lin, D. N. C. & Papaloizou, J. C. B. 1993, in Protostars and Planets III, ed. E. H. Levy & J. I. Lunine, 749–835
- Looney et al. (2000) Looney, L. W., Mundy, L. G., & Welch, W. J. 2000, ApJ, 529, 477
- Lubow & D’Angelo (2006) Lubow, S. H. & D’Angelo, G. 2006, ApJ, 641, 526
- Marsh & Mahoney (1992) Marsh, K. A. & Mahoney, M. J. 1992, ApJ, 395, L115
- Mouillet et al. (1997) Mouillet, D., Larwood, J. D., Papaloizou, J. C. B., & Lagrange, A. M. 1997, MNRAS, 292, 896
- Najita et al. (2007) Najita, J. R., Strom, S. E., & Muzerolle, J. 2007, MNRAS, 378, 369
- Nomura et al. (2007) Nomura, H., Aikawa, Y., Tsujimoto, M., Nakagawa, Y., & Millar, T. J. 2007, ApJ, 661, 334
- Pety (2005) Pety, J. 2005, in SF2A-2005: Semaine de l’Astrophysique Francaise, ed. F. Casoli, T. Contini, J. M. Hameury, & L. Pagani, 721–+
- Piétu et al. (2007) Piétu, V., Dutrey, A., & Guilloteau, S. 2007, A&A, 467, 163
- Qi et al. (2004) Qi, C., et al. 2004, ApJ, 616, L11
- Qi et al. (2006) Qi, C., Wilner, D. J., Calvet, N., Bourke, T. L., Blake, G. A., Hogerheijde, M. R., Ho, P. T. P., & Bergin, E. 2006, ApJ, 636, L157
- Quillen (2006) Quillen, A. C. 2006, ApJ, 640, 1078
- Rice et al. (2006) Rice, W. K. M., Armitage, P. J., Wood, K., & Lodato, G. 2006, MNRAS, 373, 1619
- Rice et al. (2003) Rice, W. K. M., Wood, K., Armitage, P. J., Whitney, B. A., & Bjorkman, J. E. 2003, MNRAS, 342, 79
- Rodmann et al. (2006) Rodmann, J., Henning, T., Chandler, C. J., Mundy, L. G., & Wilner, D. J. 2006, A&A, 446, 211
- Rogstad et al. (1974) Rogstad, D. H., Lockhart, I. A., & Wright, M. C. H. 1974, ApJ, 193, 309
- Salyk et al. (2007) Salyk, C., Blake, G. A., Boogert, A. C. A., & Brown, J. M. 2007, ApJ, 655, L105
- Schneider et al. (2003) Schneider, G., Wood, K., Silverstone, M. D., Hines, D. C., Koerner, D. W., Whitney, B. A., Bjorkman, J. E., & Lowrance, P. J. 2003, AJ, 125, 1467
- Scholl et al. (1982) Scholl, H., Cazenave, A., & Brahic, A. 1982, A&A, 112, 157
- Simon et al. (2000) Simon, M., Dutrey, A., & Guilloteau, S. 2000, ApJ, 545, 1034
- Simon & Prato (1995) Simon, M. & Prato, L. 1995, ApJ, 450, 824
- Skrutskie et al. (1990) Skrutskie, M. F., Dutkevitch, D., Strom, S. E., Edwards, S., Strom, K. M., & Shure, M. A. 1990, AJ, 99, 1187
- Stapelfeldt & The WFPC2 Science Team (1997) Stapelfeldt, K. & The WFPC2 Science Team. 1997, in Science with the VLT Interferometer, ed. F. Paresce, 395–+
- Strom et al. (1989) Strom, K. M., Strom, S. E., Edwards, S., Cabrit, S., & Skrutskie, M. F. 1989, AJ, 97, 1451
- Varnière et al. (2006) Varnière, P., Blackman, E. G., Frank, A., & Quillen, A. C. 2006, ApJ, 640, 1110
- Weaver & Jones (1992) Weaver, W. B. & Jones, G. 1992, ApJS, 78, 239
- Weidenschilling et al. (1997) Weidenschilling, S. J., Spaute, D., Davis, D. R., Marzari, F., & Ohtsuki, K. 1997, Icarus, 128, 429
- Weintraub et al. (1989) Weintraub, D. A., Sandell, G., & Duncan, W. D. 1989, ApJ, 340, L69
- White & Ghez (2001) White, R. J. & Ghez, A. M. 2001, ApJ, 556, 265
- Wolf et al. (2008) Wolf, S., Schegerer, A., Beuther, H., Padgett, D. L., & Stapelfeldt, K. R. 2008, ApJ, 674, L101
- Wolk & Walter (1996) Wolk, S. J. & Walter, F. M. 1996, AJ, 111, 2066