FIASCO - A new Spectrograph at the University Observatory Jena††thanks: Based on observations obtained with telescopes of the University Observatory Jena, which is operated by the Astrophysical Institute of the Friedrich-Schiller-University.
Abstract
A new spectrograph (FIASCO) is in operation at the 0.9 m telescope of the University Observatory Jena. This article describes the characterization of the instrument and reports its first astronomical observations, among those Li (6708Å) detection in the atmosphere of young stars, and the simultaneous photometric and spectroscopic monitoring of variable stars.
markus@astro.uni-jena.de
1 Introduction
The University Observatory Jena is located close to the small village Großschwabhausen, west of the city of Jena. The Friedrich Schiller University operates there a 0.9 m reflector telescope which is installed at a fork mount (see e.g. Pfau 1984). The telescope can be used either as a Schmidt-Camera, or as Nasmyth telescope. In the Schmidt-mode () the telescope aperture is limited to the aperture of the installed Schmidt-plate m. In the Nasmyth-mode the full telescope aperture m is used at .
At the end of May 2008 a new fiber spectrograph with an external calibration unit saw its first light at the University Observatory Jena. The spectrograph FIASCO (Fiber Amateur Spectrograh Casually Organized) was developed and built by the Club of Amateurs in Optical Spectroscopy (CAOS, see e.g. [Avila et al. 1999]) working at the European Southern Observatory and the Max Planck Institute of Extraterrestrial Physics in Garching close to Munich.
In this paper, first we describe the main characteristics of the new spectrograph. In the second section the internal layout, and all external components of FIASCO are described. We present the spectroscopic properties of the spectrograph as used at University Observatory Jena, as well as the characterization of its CCD detector. Finally, in the third section we present first results obtained during test observations with the instrument after its first light end of May 2008.
2 FIASCO Characterization
2.1 The Spectrograph and its Calibration Unit
The spectrograph is installed in a room directly below the mount of the 0.9 m telescope and is operated from the control room of the University Observatory. A 3d model of the spectrograph internal layout is shown in Fig. 1, with all its optical components.
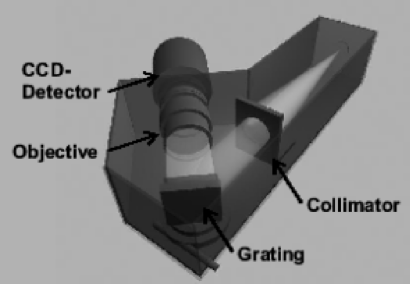
The spectrograph is coupled to the 0.9 m telescope by an optical fibre. The fibre beam is collimated by a 50 mm diameter doublet acting as collimator (), and the dispersion is achieved with a reflective diffraction grating with 1300 lines/mm. Finally, a 200 mm focal distance photographic objective open to re-image the spectrum on the CCD detector, which is a SITe TK1024 CCD sensor with 10241024 pixel, each a square with an edge length of 24 m. The detector is Peltier cooled, and cooling temperatures 40 K below ambient air temperature can be reached.
The optical fibre which connects the spectrograph with the 0.9 m telescope has a diameter of 70 m, and a length of 15 m. One end of the fibre is directly connected to the spectrograph while the other end is coupled to the Nasmyth telescope beam through a mini-lens. This lens projects the pupil of the telescope on the fibre in such a way to reduce the telescope beam into a one in the fibre. This optical coupling reduces significantly the so-called focal ratio degradation by the fibre. In order to put the image of the star in front of the lensed fibre, a thin 100 mm diameter nickel reflective plate with a 200 hole in the center is placed in front of the lens. The plate is inclined to send the telescope beam to a fiber-viewing camera. Figure 2 shows the fiber coupler, holding the fibre, mini-lens, nickel plate and the fiber-viewing camera. Between the fiber coupler and the Nasmyth interface flange, a calibration unit is installed. The unit includes spectral calibration and flatfielding lamps. This calibration unit was build at the Astrophysical Institute of University Jena, and can be operated from the telescope control room.
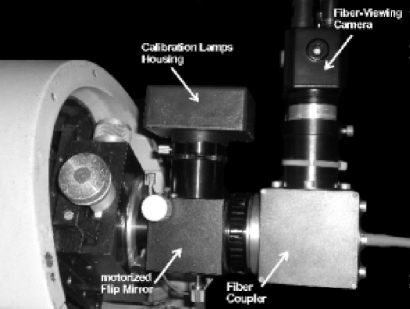
The fiber-viewing camera is a sensitive video camera, which is equipped with an interline transfer CCD sensor with 752582 pixel (8.6 m8.3 m). The camera redout electronics offers periodically frame adding from 1 up to 256 frames each with 1/25 s of integration time, i.e. integration times of 1/25 s up to 10.24 s. With the periodical data readout stars as faint as mag can be detected with the fibre-viewing camera. In addition for telescope acquisition of fainter sources also endless frame adding within freely adjustable time intervals is possible. The signal of the fibre viewing camera is displayed on a monitor in the telescope control room and shows the Nasmyth focus of the 0.9 m telescope with the fibre entrance. This allows an observer, during telescope acquisition, to place a target precisely on the fibre entrance so that all light, collected by the 0.9 m telescope, can reach the spectrograph.
The calibration unit is composed of an electrically controlled flip-mirror and the calibration lamps housing. For calibration the flip-mirror can be moved in the light pass of the telescope. The mirror then reflects the light of the calibration lamps directly on the fibre entrance. A Ne arc lamp is used for wavelength calibration and a tungsten lamp for flatfielding, respectively. The brightness of both lamps was adjusted so that calibration spectra with sufficiently high signal-to-noise () can be achieved already in 10 s of integration time.
In order to achieve a precise focusing of the 0.9 m telescope a new focus electronic was developed and built at University of Jena, which is also operated from the telescope control room. Precise focusing is of great importance in order to minimize light losses due to unfocused and therefore broadened telescope PSF. The used 70 m fibre covers a circular area on the sky with a diameter of 2.7 arcsec, which is sufficiently large to grab all light collected by the 0.9 m telescope under typical seeing conditions at University Observatory Jena.
2.2 The FIASCO CCD Detector
As described above, the CCD sensor installed in FIASCO is Peltier cooled and the detector cooling temperature is monitored and regulated by a cooling electronic to stabilize the detector dark current. For a chosen detector temperature the detector cool down and the temperature stabilization are completed after 10 minutes. The dark current of the CCD detector, as measured for a range of cooling temperatures, is illustrated in Fig. 3 and listed in Table 1.

-20 ∘C the FIASCO detector exhibits a low dark current of less than 100 count/min.
| T | dark current | T | dark current |
|---|---|---|---|
| C] | [count/min] | C] | [count/min] |
As expected, the dark current is an exponential function of the used detector cooling temperature and rapidly increases with temperature. We obtain as fit to the measured dark current values at different cooling temperature: . While the dark current is high for detector cooling temperatures over -10 ∘C, where it reaches already several hundreds of count/min, it remains below 100 count/min for cooling temperatures below -20 ∘C. Hence, always cooling temperatures as low as possible but in particular below this critical temperature value should be chosen. The integrated Peltier cooling reaches this temperature range even in warm summer nights.
The detector linearity was measured with flatfield spectra, obtained with the installed calibration unit. The dependency of the detected signal of the flatfield spectra on the integration time is shown in Fig. 4.


The measured signal on the detector increases highly linear from the level of the detector bias around 11000 count up to 50000 count. The linearity level, i.e. the deviation in percent from perfect linearity, is less than 1 % in this range of signal (see Fig. 5). In contrast, for signals higher than 50000 count the detector rapidly looses its linearity. Hence, the detector signal should always be limited below the critical value of 50000 count.
2.3 Spectroscopic properties of FIASCO
The spectrograph can be used over a wide spectral range limited by the size of the CCD detector. By rotating the installed reflective grating large shifts in the spectral range can be achieved. Although most observations are centered around the H-line at 6563 Å.
The CCD detector is well aligned with the dispersion direction of the grating. The measured deviation of the spectrum on the detector perpendicular to the dispersion direction is less than 1 pixel, i.e. 24 m, over the whole detector length (1024 Pixel or 24.6 mm). In Fig. 6 we show the wavelength calibration of a typical spectrum obtained with the Ne arc lamp of the calibration unit.

The dispersion is highly linear over the whole chosen spectral range. We obtain 0.91370.0005 Å per pixel as dispersion over the whole covered wavelength range, which spans from 6127 Å up to 7061 Å, i.e. Å.
By measuring the full width half maximum of all Ne lines in the wavelength calibration spectrum we could determine the spectral resolution over the covered spectral range. The measured spectral resolution for a range of wavelength is illustrated in Fig. 7. The spectral resolution decrease from about 1.8 Å at 6127 Å to 1.2 Å for wavelength longer than 6500 Å.

This yields resolving powers of the spectrograph which increase from about 3500 at the blue end of the covered spectral range up to 6000 at its red end, as it is illustrated in Fig 8.

3 First results with FIASCO at the 0.9 m telescope
During first light spectroscopy with FIASCO together with its calibration unit at the 0.9 m telescope end of may 2008 several stars with different spectral types and magnitudes were observed to test the performance of the spectrograph during night time operation. Furthermore, the quality of calibration data, taken with the calibration unit in the light pass, and their use for data reduction was investigated.
The telescope acquisition of a target on the fibre entrance, the optimized telescope focusing, as well as the spectroscopy of targets with FIASCO were all fully successful. The obtained arc and flatfield spectra allowed an optimal calibration of the spectra.
In the following subsections we present first results, which were obtained with FIASCO while testing the spectrograph during night time operation. All spectra were wavelength calibrated and flatfielded with calibration spectra, taken with the calibration unit either before or after the spectroscopy of the different targets. For flux calibration, spectra of standard stars with known spectral types were always taken at the same airmasses as the observed targets.
3.1 FIASCO Detection Limit
In order to derive the detection limit of the spectrograph at the 0.9 m telescope several spectra of G2V stars were obtained during different observing nights but always under photometric conditions. The maximal achieved signal-to-noise ratio of each spectrum was measured which finally yielded the detection limit. For 600 s of integration time a signal-to-noise ratio of can be expected for FIASCO spectra of solar like stars with a magnitude of mag.
3.2 Lithium detection
On September 13th 2008 we took two spectra with 600 s integration time of the young flare star HN Peg ( mag). The average of both spectra is shown in Fig. 9. The continuum of the average spectrum is normalized and a normalized solar spectrum is shown for comparison. Beside the strong H absorption line at 6563 Å several faint atomic absorption features are detected in the spectrum of HN Peg, which are also found in the solar comparison spectra. The atmosphere of HN Peg still contains Lithium, whose absorption feature is clearly detected at 6708 Å in our spectrum. In contrast Lithium is not found in the solar spectrum, as it is expected for a several Gyr old main sequence star.
3.3 Simultaneous Photometry and Spectroscopy
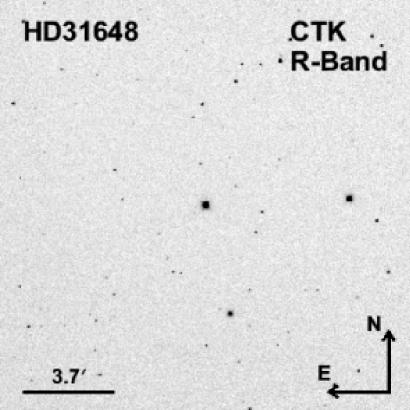
In order to test the simultaneous photometric and spectroscopic monitoring of a star with the telescopes of the University Observatory Jena on October 13th 2008 we observed the Herbig Ae star HD 31648 ( mag) over a span of time of 104 min. The star was imaged with the camera CTK (see [Mugrauer 2009] for details) and 178 images each with an integration time of 4 s could be taken in R-band. The dark current and bias level of all CTK images were removed by the subtraction of dark frames taken with the same integration time. We used the median of 5 dark frames to remove cosmics detected in the individual dark frames. The dark and bias subtracted CTK images were then flatfielded with sky flats taken in twilight. A detail of one of these CTK images is shown in Fig. 10.
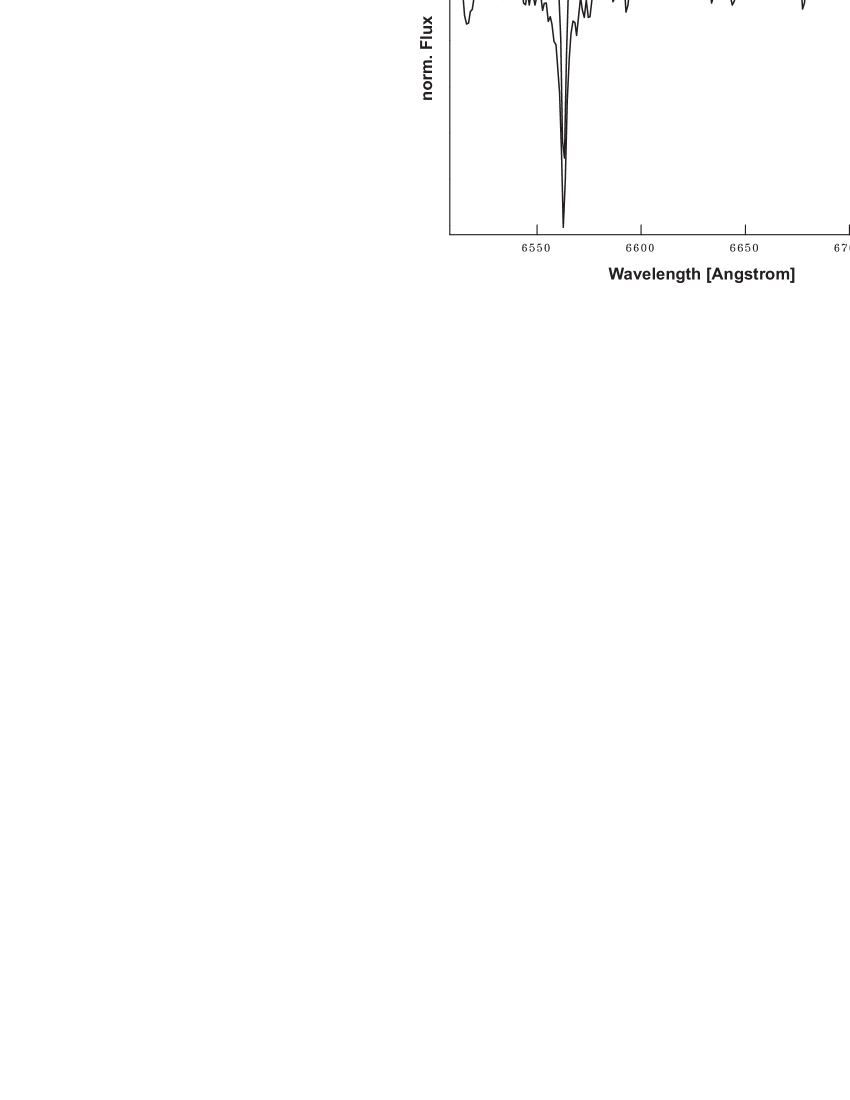
Simultaneously to the CTK imaging 8 spectra of the star could be taken with FIASCO each with an integration time of 600 s. The individual spectra were normalized to unity at a wavelength of 6600 Å. The CTK relative photometry, as well as the simultaneously taken spectra of the star are shown in Fig. 11. The photometry of HD 31648 does not show a significant photometric variability within the monitored span of time. The scatter of the CTK R-band photometry of HD 31648 is only mag. Fig. 11 shows a display of the taken spectra for a spectral range centered around H from 6540 Å to 6580 Å. The individual spectra are overplotted. The P-Cyg profile of the H-line of HD 31648 is clearly detected in all spectra with a slight variation during the monitored span of time.

3.4 Planet spectroscopy with FIASCO
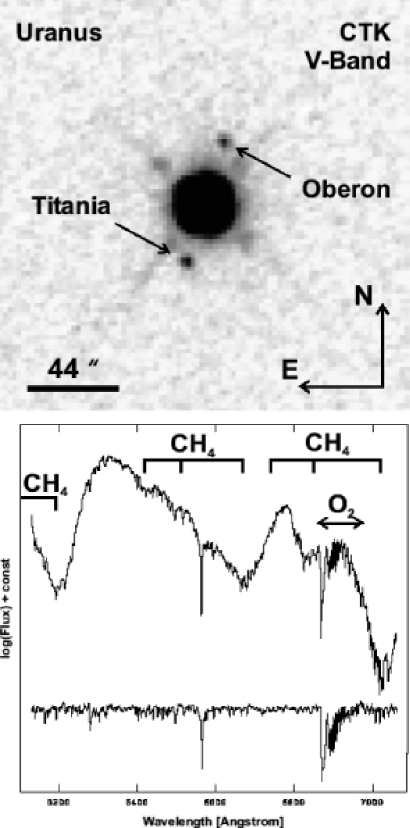
In September 2008 we took spectra of the outer gas giant planets Uranus and Neptune, which were also imaged with the CTK in V-band. On Sep 4th 2008 12 images of Uranus ( mag) each with an integration time of 5 s were averaged to the image shown in Fig. 12. The two Uranus moons Titania and Oberon are detected in the CTK images close to the planet. All CTK images were reduced in the same way as described in the previous subsection.
In addition to our CTK imaging we obtained two spectra with FIASCO each with an integration time of 600 s whose average is shown in Fig. 12. Beside the atomic absorption lines of the reflected sun light (see normalized solar spectrum for comparison) the Uranus spectrum also shows the broaden absorption features of Methane, a significant component of the planet atmosphere.
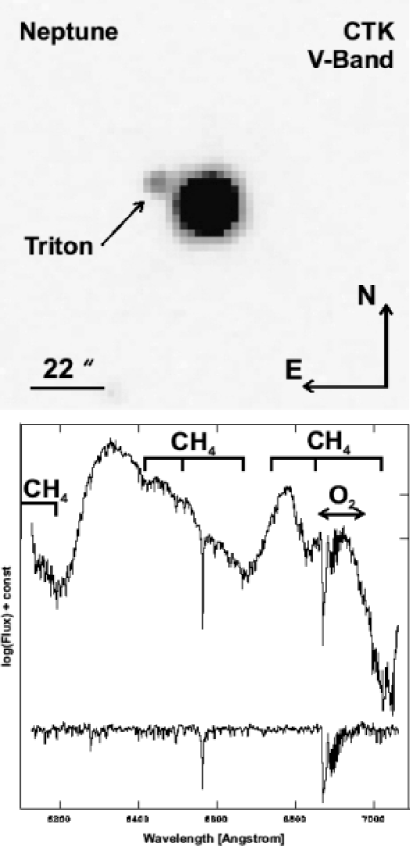
In the same night we also observed Neptune ( mag) with the CTK in V-band and 5 images each with an integration time of 20 s were taken. All CTK images are averaged to the image which is shown in Fig. 13. This CTK image also shows the Neptune moon Triton, which is detected close to the planet. The CTK images were reduced in the same way as described in the previous subsection.
The spectroscopy of Neptune was not possible in the same night because the planet was already to close to the horizon. However, on Sep 18th 2008 we could obtain first spectra of Neptune. We took three spectra each with an integration time of 600 s which were then averaged to the spectrum shown in Fig. 13. As the Uranus spectrum also the Neptune spectrum shows all absorption lines of the reflected sun light but its continuum is strongly affected by the broad absorption features of Methane.
3.5 Spectroscopy of faint point like objects
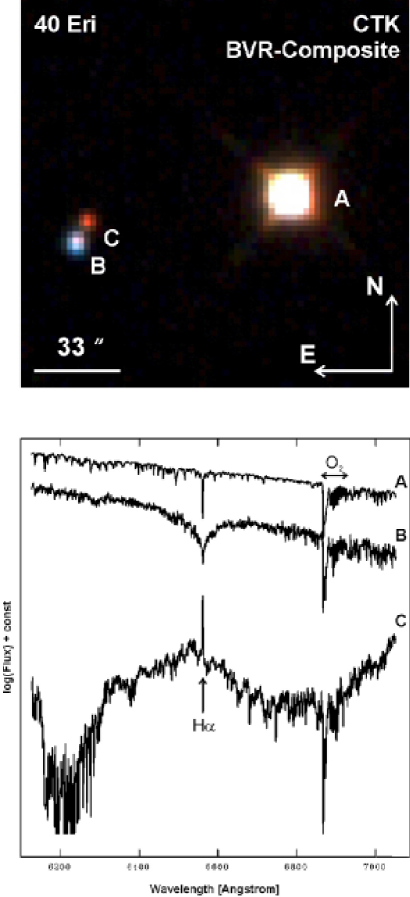
In the first weeks of operation spectra of point like sources brighter than mag were taken with FIASCO which were easily visible with the fibre viewing camera. In order to test the performance of this camera also with fainter targets we observed the triple star system 40 Eri ABC. This system is a hierarchical triple star composed of a K dwarf primary ( mag) and a close pair of a white ( mag) and a M dwarf ( mag). On October 11th 2008 we observed the system with the CTK and obtained a BVR-composite image which is shown in Fig. 14. The integration time in V, and R is only 1 s while it is 5 s in B-band. The separation between 40 Eri A and B is about 79 arcsec while 40 Eri B and C are separated by only 7 arcsec, as measured in our CTK images. All CTK images are reduced in the same way as it was already described in the previous subsections. The different effective temperatures of the three components in the 40 Eri system are already revealed by their photometry. The orange shining primary 40 Eri A is an K1 main sequence star, while the faint and blue B component is a DA white dwarf. This component has a close red shining stellar companion 40 Eri C which is an M4 to 5 dwarf.
We obtained spectra of all components of the 40 Eri system which are shown in Fig. 14. Telescope acquisition, in particular on the faint B and C components was possible using the fibre viewing camera in its periodical frame read out mode with integration times of several seconds. Although the separation between both components is only 7 arcsec, i.e. only slightly larger than twice the fibre diameter (2.7 arcsec) separate spectroscopy of both components was doable. For each component always 3 spectra were taken with individual integration times of 300 s in the case of 40 Eri A, and 600 s for B and C, respectively. The different shapes of the H-line in the spectra of the three stars is clearly detected. While 40 Eri A shows a narrow H-line the one in the spectrum of 40 Eri B is strongly broadened due to its high surface gravity, typical for a white dwarf. In contrast 40 Eri C exhibits H in emission which indicated ongoing strong chromospherical activity.
3.6 Spectroscopy of faint extended objects
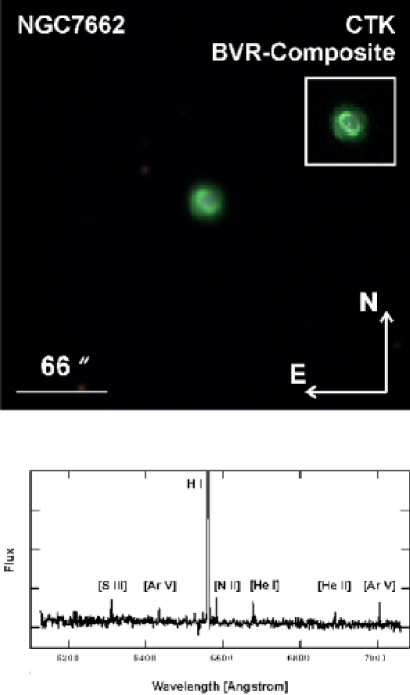
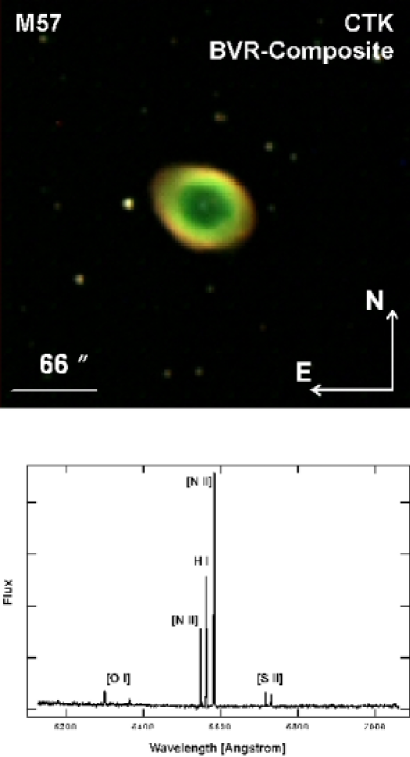
In order to test the telescope acquisition with the fibre viewing camera also on faint extended objects we tried to take spectra of deep sky objects. Thereby, the fibre viewing camera was used in its endless read out mode with freely adjustable integration times. On October 11th 2008 spectra of the planetary nebula NGC7662 (Blue Snowball) in the constellation Andromeda, and the famous ring nebula M57 (NGC6720) in the constellation Lyra were taken with FIASCO. The fibre (2.7 arcsec of diameter) was center in the central region of NGC7662 while its was placed on the northern arc of M57. For each nebula two 600 s spectra were averaged which are shown in Fig. 15 & 16.
The most prominent feature in the spectrum of NGC7662 is the strong H emission line at 6563 Å. In addition we could identify in the FIASCO spectrum also the forbidden lines of S [III] at 6312 Å, [Ar V] at 6435 Å and 7005 Å, [N II] at 6583 Å, [He I] at 6678 Å and [He II] at 6891 Å. In contrast, the most prominent feature in the spectrum of the northern arc of M57 is the forbidden line of [N II] at 6583 Å folowed by the H emission line at 6563 Å and the forbidden line of [N II] at 6548 Å. We could also identify the weaker features of the forbidden lines of [O I] at 6300 Å and 6364 Å, as well as [S II] at 6717 Å and 6731 Å.
In addition to the spectroscopy both planetary nebulas were also imaged with the CTK. The BVR color composite images of both nebulas are shown in Fig. 15 & 16. For NGC7662 three CTK images were taken in each filter, each with an integration times of 40 s in B-, but 20 s in V- and R-band. All CTK images of the planetary nebula were also deconvolved using surrounding stars as PSF reference. The deconvolved BVR composite image is shown in a white box in Fig. 15. The famous ring nebula M57 was already imaged with the CTK on September 17th 2006. Images with 120 s of integration time were taken in each filter, three in B-, and two in V- and R-band, respectively. The data reduction of all CTK images was done, as already described in the previous subsections.
References
- [Avila et al. 1999] Avila, G., Guirao, C., Rodríguez, J., Alcalá, J. M., & Pittichová, J. 1999, IAU Colloq. 173: Evolution and Source Regions of Asteroids and Comets, 235
- [Mugrauer 2009] Mugrauer, M. 2009, AN, arXiv:0903.4116
- [Pfau 1984] Pfau, W. 1984, Jenaer Rundsch., 29. Jahrg., Heft 3, p. 121 - 122, 29, 121
Acknowledgements.
We would like to thank Jesús Rodriguez, Carlos Guirao from ESO Garching, M. Sterzik from ESO Chile, V. Burwitz from MPE Garching, J. Alcala from INAF Capodimonte, and A. Seifahrt from University Göttingen for all their help. We would like also to thank the MPE for its contribution to FIASCO hardware, as well as the staff of the mechanic and electronic division of the faculty for physics and astronomy at the University Jena. This publication makes use of data products from the SIMBAD and VIZIER databases, operated at CDS, Strasbourg, France.