X-ray Emitting Stars Identified From The All-Sky Survey And The Sloan Digital Sky Survey11affiliation: Includes observations obtained with the Apache Point Observatory -m telescope, which is owned and operated by the Astrophysical Research Consortium.
Abstract
The All-Sky Survey (RASS) was the first imaging X-ray survey of the entire sky. Combining the RASS Bright and Faint Source Catalogs yields an average of about three X-ray sources per square degree. However, while X-ray source counterparts are known to range from distant quasars to nearby M dwarfs, the RASS data alone are often insufficient to determine the nature of an X-ray source. As a result, large-scale follow-up programs are required to construct samples of known X-ray emitters. We use optical data produced by the Sloan Digital Sky Survey (SDSS) to identify stellar X-ray emitters cataloged in the RASS and falling within the SDSS Data Release 1 footprint. Most of these are bright stars with coronal X-ray emission unsuitable for SDSS spectroscopy, which is designed for fainter objects ( mag). Instead, we use SDSS photometry, correlations with the Two Micron All Sky Survey and other catalogs, and spectroscopy from the Apache Point Observatory -m telescope to identify these stellar X-ray counterparts. Our sample of X-ray emitting F, G, K, and M stars is one of the largest X-ray selected samples of such stars. We derive distances to these stars using photometric parallax relations appropriate for dwarfs on the main sequence, and use these distances to calculate . We also identify a previously unknown cataclysmic variable (CV) as a RASS counterpart. Separately, we use correlations of the RASS and the SDSS spectroscopic catalogs of CVs and white dwarfs (WDs) to study the properties of these rarer X-ray emitting stars. We examine the relationship between and the equivalent width of the H emission line for X-ray emitting CVs and discuss tentative classifications for a subset based on these quantities. We identify new X-ray emitting DA (hydrogen) WDs, of which three are newly identified WDs. We report on follow-up observations of three candidate cool X-ray emitting WDs (one DA and two DB (helium) WDs); we have not confirmed X-ray emission from these WDs.
Subject headings:
surveys — X-rays:stars1. Introduction
X-ray data obtained since the 1970s have shown definitively that stellar X-ray emitters are present among almost all stellar classes (e.g., Harnden et al., 1979; Cassinelli & Swank, 1983; Stocke et al., 1983; Schmitt et al., 1995; Motch et al., 1998; Zickgraf et al., 2003; Rogel et al., 2006), with the emission mechanism being different for early and late-type stars; only evolved K and M stars and perhaps A stars do not appear to be X-ray emitters (e.g., Ayres et al., 1981; Antiochos et al., 1986; Haisch et al., 1991; Daniel et al., 2002). However, within a stellar class–particularly among late-type stars–the strength of the X-ray emission varies greatly. A G5 star may be much brighter in the X-ray regime than its apparent twin, suggesting that the physics of X-ray emission is intimately linked to detailed stellar properties. X-ray spectroscopy with the Chandra X-ray Observatory and XMM-Newton X-ray Observatory, occasionally in conjunction with observations at other wavelengths, is providing unprecedented insight into these connections (e.g., Osten et al., 2005; Smith et al., 2005; Hussain et al., 2007). Before such studies can be conducted, however, catalogs of confirmed X-ray emitting stars from all areas of the Hertzsprung-Russell diagram need to be compiled and broadly characterized.
We have identified a sample of stellar X-ray emitters cataloged in the All-Sky Survey (RASS; Voges et al., 1999) and falling within the footprint of the Sloan Digital Sky Survey (SDSS; York et al., 2000) Data Release 1 (DR1; Abazajian et al., 2003). We produced a two-part catalog. One part includes stars that are previously cataloged, e.g., in SIMBAD or in the NASA/IPAC Extragalactic Database (NED)111This research has made use of the SIMBAD database, which is operated at CDS, Strasbourg, France, and of the NASA/IPAC Extragalactic Database and Infrared Science Archive, which are operated by the Jet Propulsion Laboratory, California Institute of Technology, under contract with the National Aeronautics and Space Administration., but not identified as X-ray source counterparts. Another entries are new stellar X-ray source identifications made on the basis of spectroscopic observations with the Astrophysical Research Consortium -m telescope at the Apache Point Observatory (APO). The vast majority of these stars are F, G, K, and M stars ( stars), although we identify a new cataclysmic variable (CV) in our APO data; the SIMBAD sample also includes a newly identified X-ray emitting white dwarf (WD). To expand the sample of X-ray emitting CVs and WDs, we correlated the SDSS spectroscopic catalogs of these objects (Szkody et al., 2002, 2003, 2004a, 2005, 2006, 2007; Eisenstein et al., 2006) with the RASS to identify the X-ray emitters among these more exotic stars. In a previous paper we described our efforts to use the RASS and SDSS to identify new isolated neutron stars, which are possibly the rarest stellar X-ray emitters (Agüeros et al., 2006).
In Section 2, we review other efforts to construct large samples of X-ray emitting stars; we also provide a brief description of SDSS, as well as a summary of the challenges of using SDSS to identify RASS stellar X-ray emitters. In Section 3, we outline the process by which we constructed our list of candidate DR1 stellar counterparts to RASS sources. In Section 4, we describe how we confirmed our stellar identifications, thereby obtaining our sample of stellar X-ray sources. We distinguish between previously cataloged stars we identify as X-ray sources and stars for which we obtained spectra with the APO -m telescope. In Section 5, we begin by calculating distances and X-ray luminosities for stars in our catalog, compare our identifications to those of Flesch & Hardcastle (2004) and of Parejko et al. (2008) for sources that also appear in their catalogs, and describe the data in our main catalog, which includes the X-ray, optical, and infrared information for our stellar X-ray sources. We also estimate the overall reliability of our identifications; we find that are likely to be false associations. In Section 6, we present the results of a parallel effort to use correlations of the SDSS spectroscopic catalogs of CVs and of WDs with the RASS to construct catalogs of these rarer stellar X-ray emitters. We also report on follow-up Chandra and XMM observations of several candidate cool X-ray emitting WDs. We conclude in Section 7.
2. Identifying Stellar X-ray Sources…
2.1. using optical photometry and spectroscopy
The Einstein Observatory provided the first large samples of X-ray sources. The Medium Sensitivity Survey (MSS; Gioia et al., 1984) and the Extended Medium-Sensitivity Survey (EMSS; Gioia et al., 1990) collected serendipitously detected sources with fluxes between and ergs cm-2 s-1 in the keV energy band. Because survey X-ray data are often insufficient to determine unambiguously the nature of a source, extensive optical follow-up was required to identify the MSS and the EMSS sources. Stocke et al. (1983) used the MSS to confirm that a given class of X-ray emitters has a fairly narrow range of possible X-ray-to-optical flux ratios (e.g., for active galactic nuclei (AGN), log ), and that the overlap between broad classes (e.g., Galactic and extragalactic sources) is fairly small. They found that of MSS sources were coronally emitting stars, primarily late-type dwarfs; they also found one cataclysmic variable (CV). Stocke et al. (1991) used the MSS results to identify plausible counterparts to EMSS sources based on their . Still, confirming that these counterparts were X-ray sources was very time-intensive: Stocke et al. (1991) obtained two to five spectra in each X-ray error circle. Six to eight nights a year over seven years were needed at the Multiple Mirror Telescope Observatory, Mt. Hopkins, AZ, to identify sources. This work confirmed that of Einstein detected-sources are Galactic stars.
Similar efforts have been undertaken to identify some of the sources detected at soft X-ray energies ( keV) by as part of its All-Sky Survey. The RASS Bright Source Catalog (BSC; Voges et al., 1999) includes sources with count rates cts s-1 and counts; the Faint Source Catalog (FSC; Voges et al., 2000) lists another with cts s-1. A relatively small fraction of RASS sources can be identified from correlations with existing catalogs. Bade et al. (1998) found matches to of a sample of RASS sources in SIMBAD and NED. To identify other BSC sources, Bade et al. (1998) used objective prism spectra obtained during the Hamburg Quasar Survey (HQS; Hagen et al., 1995) and found candidate counterparts for of the sources within the HQS footprint. Of these, () were M stars, () K stars, () F or G stars; a further () were saturated bright stars ( mag), for which no spectral class is available. There were also WDs (), and CVs (). There are uncertainties associated with these identifications; the spectra are fairly low-resolution, for example (R at H). But the RASS/HQS program suggests that one-third of -detected sources are Galactic stars.
Zickgraf et al. (2003) applied this method to identify all RASS BSC sources with and Galactic latitudes ; the total area covered was deg2. Candidate counterparts were found for of the RASS sources; the “missing” counterparts are faint optical objects whose poor-quality prism spectra preclude classification. The fraction of the BSC sources due to coronal emission from stars increases from to when one includes the likely stellar sources among the missing counterparts (Zickgraf et al., 2003). The difference between this fraction and that of stellar sources in the EMSS may be due to the different energy sensitivities of and Einstein (Zickgraf et al., 2003). The final RASS/HQS sample includes M stars, K stars, F/G stars, and saturated stars without spectral classifications, along with WDs and CVs.
2.2. using catalog matching
Parallel efforts have been made to produce large-scale catalogs of RASS counterparts without spectroscopy. Voges et al. (1999) correlated the BSC sources with a number of existing catalogs–for example, of bright stars (Tycho; Høg et al., 1998) or of radio and ultraviolet (UV) sources (FIRST, NVSS, and EUVE; Becker et al., 1995; Condon et al., 1998; Bowyer et al., 1996). They found at least one cataloged counterpart within for of BSC sources. X-ray sources had a single cataloged counterpart, which Voges et al. (1999) used to establish the overall statistical properties of the catalog: have Galactic counterparts. This matching was based primarily on positional coincidence and relied on the relatively low surface densities of BSC sources and of the various candidate counterparts (Voges et al., 1999).
Rutledge et al. (2000) matched the BSC to the USNO A catalog (Monet et al., 1998). Factoring in both the proximity and the USNO of objects found within of the RASS sources, and estimating the contamination rate by comparisons to background fields, they sifted through possible optical counterparts to identify those with the highest probability of being X-ray sources. The resulting catalog includes BSC sources for which Rutledge et al. (2000) identified a USNO object with a probability of being the counterpart; had a probability .
In an even more ambitious effort, Flesch & Hardcastle (2004) matched X-ray data from all of the major catalogs to multiple radio and optical surveys, thereby creating an all-sky catalog of radio/optical counterparts to some X-ray sources. Nearly of these sources were previously identified, while an additional are estimated to be to likely to be previously unknown quasars (QSOs). The likelihood of a given association was calculated first by examining the proximity of a proposed counterpart, its color, and its optical classification, and then by comparing the density of all candidate counterparts with these properties to their all-sky density (Flesch & Hardcastle, 2004).

These catalogs are very useful for developing a statistical sample of a given category of X-ray emitters, typically QSOs (e.g, Bauer et al., 2000; Flesch & Hardcastle, 2004). (There is usually almost no discussion of the stellar X-ray sources.) However, because they rely largely on the properties of known counterparts to identify new counterparts, the catalogs cannot tell us more about the overall properties of X-ray sources than the smaller catalogs on which they are based (Flesch & Hardcastle, 2004). In that sense, these catalog-based approaches cannot fully replace the combined photometric and spectroscopic method developed to identify Einstein sources.
Furthermore, detailed analysis of selected subsets of these catalogs can reveal problems with the claimed identifications. For example, intrigued by apparent anomalies in the spatial distribution of QSOs in the Flesch & Hardcastle (2004) catalog, López-Corredoira et al. (2008) investigated a subsample of QSO candidates to test the reliability of their assigned QSO likelihoods. They found that only were actual QSOs, and that the catalog likelihoods were particularly unreliable for bright objects ( mag), where none of the Flesch & Hardcastle (2004) candidates was in fact a QSO.
2.3. using SDSS
Previous to this work, the Zickgraf et al. (2003) catalog was the single largest sample of RASS stellar sources for which counterparts have been spectroscopically confirmed. In fact, only of RASS BSC/FSC sources are identified and fully characterized (McGlynn et al., 2004; Mickaelian et al., 2006), with the majority of the identifications being of BSC sources. Large-scale programs to find the counterparts to RASS sources are still very much needed.
SDSS provides uniform optical photometric and spectroscopic data with which to correlate the RASS catalogs. The survey produces u, g, r, i, z images to a depth of mag (Fukugita et al., 1996; Gunn et al., 1998; Hogg et al., 2001; Smith et al., 2002; Gunn et al., 2006), with a photometric accuracy of mag (Ivezić et al., 2004); Tucker et al. (2006) describe the photometric pipeline. The imaging survey covers deg2 and includes photometric data for over stars and a similar number of galaxies. SDSS is also a spectroscopic survey, and has obtained spectra for galaxies, QSOs, and stars.
SDSS is an ideal tool for systematically identifying large numbers of sources (e.g., X-ray emitting AGN or galaxies; Anderson et al., 2003, 2007; Parejko et al., 2008). However, the vast majority of stellar X-ray emitters cataloged in the RASS are unlikely to be discovered from routine SDSS spectroscopy. Relative to their optical output, the most X-ray luminous normal stars (i.e., coronal emitters) have log (Maccacaro et al., 1988) and so almost all are optically brighter than the mag SDSS spectroscopic limit.

We have therefore combined the SDSS photometric data with infrared data from the Two Micron All Sky Survey (2MASS; Skrutskie et al., 2006) to select a sample of bright stars near BSC/FSC positions. When available, we used existing catalog data to classify the stars. In many cases, however, no spectral class is available, and we therefore used the APO -m telescope to obtain spectra for objects in about of these RASS error circles (the total number of spectra collected is close to ). We then used a spectral-template fitting code to classify the likely counterparts by spectral type. We also estimated ratios for all the stars based on their cataloged magnitudes and compared the ratios to those of known X-ray emitters of the same spectral type, thereby verifying that these stars are indeed plausible RASS source counterparts. Each of these steps is described in detail in the following sections.
3. Selecting X-ray Emitting Stars from the RASS and SDSS DR1
We matched the RASS X-ray source positions to those of the SDSS Data Release 1 (DR1; Abazajian et al., 2003) stripes; each SDSS stripe is a -deg-wide rectangle of sky. We found matches for RASS sources, or just under of the catalogs’ entries. Since the DR1 area is deg2 (Abazajian et al., 2003), or roughly of the entire sky, this number is consistent with a naive surface density expectation222The quoted DR1 area is for the imaging survey; the DR1 spectroscopic area is deg2..
We queried the SDSS photometric database using the SDSS Query Analyzer (sdssQA) to identify bright stars near these RASS sources; see Agüeros (2006) for details. This query returned coordinates, PSF magnitudes333PSF fitting provides better estimates of isolated star magnitudes; see Stoughton et al. (2002)., and automatically assigned morphology type (star or galaxy) for objects with or mag, subject to a small number of tests of the objects’ photometric flags.
The output from sdssQA was matched to the RASS sources in the DR1 footprint. This matching produced a list of RASS sources with a bright/saturated SDSS object within , roughly two-thirds of the total number of RASS/DR1 sources. However, visual inspection of the SDSS images for these sources revealed that a significant fraction did not have a nearby bright object444We used the SDSS image list tool to examine our error circles (Nieto–Santisteban et al., 2004).. While a more conservative set of photometric cuts might eliminate many contaminants, it might also remove the real but saturated objects in which we are interested. We therefore used the Two Micron All Sky Survey (2MASS; Skrutskie et al., 2006) to confirm the existence of bright SDSS objects in the RASS error circles. While SDSS is a much deeper survey than 2MASS, whose , , and limits are mag, the two surveys are well matched at the bright end (), and our target sample of bright SDSS objects should be detected by 2MASS.
Accordingly, the 2MASS catalog was queried for matches to the SDSS objects. The typical positional uncertainties for point sources in both surveys are on the order of a fraction of an arcsecond (e.g., Finlator et al., 2000; Pier et al., 2003); the median separation between matches was . This matching left us with a list of bright/saturated SDSS objects with a nearby 2MASS counterpart within of a RASS source. In Figure 1 we show the normalized histogram of the resulting RASS/SDSS separations .
To estimate the likelihood of false matches, we shifted the positions of RASS sources in the DR1 footprint by ′ in declination and searched for nearby SDSS objects with 2MASS counterparts in the same manner as described above. Figure 1 shows the (dashed) normalized histogram for this control sample. The number of false matches rises with separation, as expected. The normalization is the same as for the previous matches, so that the dashed histogram gives an upper limit to the contamination of our sample by chance superpositions of independent RASS sources and optical/IR objects. At ′′, the cumulative contamination is . Absent other information, e.g., the brightness or nature of the proposed counterpart, positional proximity alone is generally insufficient to make secure RASS source identifications from SDSS/2MASS data. We return to the question of contamination by false matches in § 5.4, after we have assembled our final catalog.
In general, the SDSS spectroscopic database does not provide the needed additional information to identify stellar RASS counterparts. As objects brighter than mag are rarely targeted, the RASS counterparts most likely to be targeted for spectroscopy are QSOs and other AGN, since they tend to be optically fainter than X-ray emitting stars (cf. Anderson et al., 2003, 2007). In 2003 Sep, SDSS spectra were available, a sample we defined as making up the DR1 spectroscopic survey, yet only of our matched RASS/SDSS/2MASS objects have an associated SDSS spectrum. Clearly, the majority of our RASS DR1 sources cannot therefore be directly identified from SDSS spectroscopy.
4. The RASS/SDSS DR1 Catalog of Stellar X-ray Sources
To identify new stellar X-ray sources, we begin by searching SIMBAD to find stars with known spectral types recovered in our RASS/SDSS correlation. Among these are a subset of previously identified X-ray sources, to which we add the (optically bright) cataloged stars with small offsets relative to the RASS positions to construct flux ratio distributions. Using spectral types obtained from our APO observations, we then find those previously uncatalogued stars whose log () falls within the range obtained from our RASS/SIMBAD sample. Our final catalog includes these stars along with those cataloged in SIMBAD but not previously identified as RASS sources. The steps in constructing this catalog are described in detail below.
4.1. RASS/SIMBAD stars
We searched SIMBAD for cataloged candidate stellar counterparts to our matched RASS sources and found stars with an associated spectral type. Examining the literature, we determined that of these stars were previously associated with X-ray sources (e.g., by Dempsey et al., 1993; Appenzeller et al., 1998; Fleming, 1998; Hünsch et al., 1998a, b; Metanomski et al., 1998; Hünsch et al., 1999; Schwope et al., 2000; Zickgraf et al., 2003) and more rarely with sources detected by Einstein (e.g., by Topka et al., 1982; Fleming et al., 1989a, b; Stocke et al., 1991; Drake et al., 1992) or by an even earlier X-ray mission (e.g., the RS CVn systems DM UMa, detected by the High Energy Astrophysics Observatory-1 and IN Vir, by EXOSAT; Walter et al., 1980; Giommi et al., 1991). In four additional cases the stars were listed as the RASS source counterparts, but the origin of the association was unclear555These are FBS 0124098, NLTT 6782, FBS 0249084, and TYC 255263.. Conversely, of these SIMBAD stars had not been associated with an X-ray source.
Unsurprisingly, these stars tend to be optically very bright. have a cataloged ; for these, the median is mag. The stars are generally associated with brighter X-ray sources: the sample median count rate is counts s-1. By contrast, the median for the RASS sources is counts s-1. The median separation between RASS sources and SIMBAD stars is ′′; this is equivalent to , where is the separation between the matched positions divided by the RASS positional uncertainty (see Figure 2). The offset distribution of the known X-ray emitters in the sample suggests that the number of X-ray source counterparts drops quickly for separations or ; only eight stars are at offsets ′′; six have separations .
The optical brightness and small positional offsets of the previously unpublished RASS/SIMBAD matches strongly suggest that they are also the X-ray sources. We replicate the matching to the RASS BSC done by Voges et al. (1999) for stars in the Tycho catalog; the matched stars are comparable in brightness to our SIMBAD stars (their median mag). For offsets ′′ the fraction of chance Tycho/RASS coincidences is . This implies that of the stars with offsets not yet associated with an X-ray source are likely RASS source counterparts.
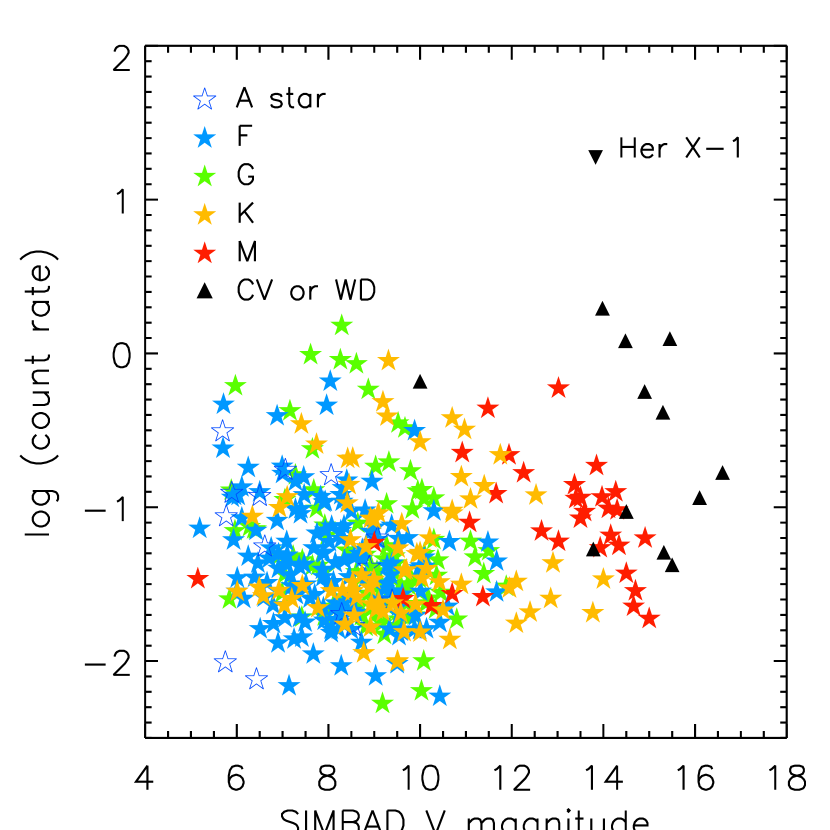
Figure 3 displays the RASS count rate vs. SIMBAD for known X-ray emitters and for other SIMBAD stars with ′′ offsets666 known X-ray emitting stars lack a cataloged , as do four previously unidentified candidate RASS counterparts.. These are primarily F, G, K, and M stars, although there are a few candidate A star counterparts (see the Appendix). There are also a handful of WDs (including a WD/M-star binary) and of CVs, which stand out because of their relative optical faintness but X-ray brightness. The brightest source is the low-mass X-ray binary Hercules X-1, among the first extrasolar X-ray sources to be detected (Schreier et al., 1972; Tananbaum et al., 1972).
4.1.1 X-ray-to-optical flux ratio calculations
Numerous studies have shown that there is a typical range of X-ray-to-optical flux ratios for each stellar type (e.g., Stocke et al., 1991; Krautter et al., 1999; Zickgraf et al., 2003). Accordingly, we calculate log for our stars. We exclude the stars listed in SIMBAD as belonging to luminosity classes II, III, or IV (see the Appendix). We also remove all stars for which the RASS match has an X-ray flag set to , which indicates that the X-ray data are not reliable (see Voges et al., 1999).

We do not remove the known binary systems from this sample when calculating the flux ratios. There are such systems within ′′ of a RASS source and with RASS flags set to ; one more is a known X-ray emitter with an offset . are listed in SIMBAD as double or multiple star systems; one is in a star cluster, and one was identified as a binary through high-resolution spectroscopy by Metanomski et al. (1998). Seven of these systems have been previously cataloged as X-ray sources. The sample also includes two Algol-type eclipsing and five spectroscopic binaries, four Lyr, six RS CVn, and six W UMa systems (including W UMa itself). While these systems may seem unrepresentative, many are known X-ray emitters (e.g., all the W UMa and RS CVn systems, but also the Algol-type binaries), which argues for their inclusion in flux ratio calculations777In practice, including the binaries broadens the flux ratio distributions slightly by adding objects at higher ..
As part of the spectroscopic campaign described in § 4.2, we obtained spectra for of the SIMBAD stars with listed spectral types. Only meet the criteria for inclusion in these calculations, and in only three cases would using our APO-based spectral classifications affect the distributions. In two cases, the difference in spectral type is consistent with our spectral typing uncertainty (see § 4.2): V* V842 Her, for which SIMBAD gives an F9V spectral type, and which we identify as a G2 star, and StKM , which Stephenson (1986) classifies as a K5 star, and which we find is an M0. In both cases, we use the SIMBAD type. The third star is RX J, classified as a K4V star by Zickgraf et al. (2005). We type the RASS counterpart as a G5 star; however, examination of this error circle reveals that our APO target is not RX J but a nearby star. See the Appendix for further discussion of these stars.
We then have known X-ray emitting F, G, K, and M stars with a cataloged and with RASS flags , and an additional SIMBAD stars not previously associated with an X-ray source that meet the same criteria and are offset by from a RASS source. Following Maccacaro et al. (1988), we calculate log log and assume that on average count s-1 translates to erg cm-2 s-1 in the keV energy range (e.g., Motch et al., 1998; Voges et al., 1999).
We first create separate distributions for the known X-ray emitters and for the other SIMBAD stars. Kolmogorov-Smirnov tests of the resulting flux ratio distributions find that for F, G, and K stars the log distributions are drawn from different underlying distributions (), while for the M stars the distributions are weakly related (; however, there are only six previously unidentified candidate M star counterparts). This is consistent with the fact that the known X-ray emitters are generally somewhat brighter in the optical and significantly brighter in the X ray than the SIMBAD stars not previously associated with a RASS source. Given the high probability that based on positional coincidence the previously unassociated stars considered here are RASS sources, we group the known and previously unknown X-ray emitters together, and calculate log for all of the stars of a given spectral type. The resulting distributions are presented in Figure 4, as are empirical ranges estimated from the mean log for each spectral type.
| Initial | New RASS | log | log | |||||
|---|---|---|---|---|---|---|---|---|
| Type | Number | Sources | Mean | Min | Max | Mean | Min | Max |
| F | ||||||||
| G | ||||||||
| K | ||||||||
| M | aaSix are identified based on their ; three without a cataloged are identified based on their . | |||||||
| Mean | Min | Max | ||||||
| A | ||||||||
| WDbbOnly six WDs have cataloged magnitudes. | ||||||||
| CV | ccThese are log values. | ccThese are log values. | ccThese are log values. | |||||
| XRB | ||||||||
Note. — The number in parentheses in the second column is the number of known X-ray emitters. Empirical log ranges and means are given for reliable samples of F, G, K, and M stars. The full flux ratio ranges are given for the A stars, WDs, and CVs.
We also show in Figure 4 the flux ratio limits for each class as observed by Krautter et al. (1999); they identified stellar X-ray emitters in an area-limited survey of RASS BSC and FSC sources. The Maccacaro et al. (1988) Einstein limits are also included in each panel. The flux ratio distributions and ranges for the SIMBAD stars are consistent with those found in these earlier studies. This suggests that, as expected, the vast majority of these stars are RASS source counterparts. Furthermore, the flux ratio ranges calculated from our own distributions for these stellar types give us limits slightly more generous than the Einstein values (which are known to be quite conservative; Stocke et al., 1991), but generally more conservative than those of Krautter et al. (1999).
Table 1 summarizes the properties of our sample of SIMBAD stars. We list the total number of stars of each spectral type in the initial sample, the number of known X-ray emitters among them, and the number of new X-ray source counterparts we identify based on the combination of positional proximity and appropriate X-ray-to-optical flux ratios. For the F, G, K, and M stars, we include the empirically derived log means and ranges. For the A stars, WDs, and CVs, which are less numerous, we list the full range of flux ratios and their means. For the CVs, we give log () (see Zickgraf et al., 2003).
| Offset | ||||||
|---|---|---|---|---|---|---|
| 1RXS J | Counts s-1 | Counterpart | (′′) | (mag) | (mag) | Type |
| 015543.3002817 | V FL Cet | P | ||||
| 083821.6483800 | V EI UMa | DN | ||||
| 085343.5574846 | V BZ UMa | DN | ||||
| 113826.8032210 | V T Leo | DN | ||||
| 020801.8133625 | WD 0205133 | DA+dM1 | ||||
| 034850.1005823 | WD 0346011 | DA | ||||
| 084104.2032118 | WD 0838035 | DA | ||||
| 112814.4024950 | WD 1125025 | DA | ||||
| 152146.6522215 | WD 1520525 | DO | ||||
| 165008.0370130 | WD 1648371 | DA | ||||
| 165020.4403723 | WD 1648407 | DA | ||||
| 172642.8583726 | WD 1725586 | DA |
Note. — “P” indicates that CV is a polar and “DN” that it is a dwarf nova.

Below we touch on the properties of the CVs and WDs in this sample, and discuss our use of the F, G, K, and M stars to construct empirical log ranges888The A stars are discussed in the Appendix..
4.1.2 The CVs and WDs
Table 2 lists the matched RASS/SIMBAD CVs and WDs. All of the CVs are known X-ray emitters; only EI UMa does not have an SDSS spectrum. Szkody et al. (2002) and Schmidt et al. (2005b) identified FL Cet as a polar, where accretion from (typically) a late-type star is directly onto a WD’s magnetic poles. The three other CVs are dwarf novae.
Six of the eight WDs in Table 2 are listed as X-ray sources by Fleming et al. (1996) while another, WD 1520525, was proposed as a soft X-ray source by Chu et al. (2004). Seven of these WDs are DAs, stars with pure hydrogen atmospheres that are the most commonly observed WD type. WD 1520525 is the only non-DA; its spectrum includes strong HeII features, making it a DO WD. Wachter et al. (2003) identified WD 0205133 as belonging to a binary system on the basis of its infrared excess and Farihi et al. (2006) resolved its M-star companion; this WD system is the only one not to be previously proposed as an X-ray source.
Overall, the X-ray sources near the WDs have very soft X-ray spectra, as measured by their hardness ratios. For these sources, HR1 , which is typical for X-ray-emitting WDs (e.g., Fleming et al., 1996; Zickgraf et al., 1997), and confirms that their counterparts are indeed likely to be these WDs. Only one of these objects has an SDSS spectrum: WD 1725586.
For a broader discussion of RASS detections of WDs and CVs, see § 6.
4.1.3 Using the known stars to construct empirical log ranges
While typical flux ratio ranges can be derived using log calculations for our sample of previously cataloged stars, we cannot use this flux ratio to evaluate the likelihood that fainter, previously uncatalogued SDSS stars are X-ray emitters, as they generally lack SIMBAD magnitudes999A handful do: a few SIMBAD entries give a magnitude but no spectral class, for example. These stars are included in the APO spectroscopic sample discussed in § 4.2.. While or would be a natural substitute for , because many of these stars are saturated, they have unreliable SDSS photometry. Instead, we use 2MASS magnitudes; all of the stars in our sample have a 2MASS counterpart.
To calculate flux ratios, we adapt the Maccacaro et al. (1988) formula to reflect the definition of the 2MASS -band flux (e.g., Cohen et al., 2003): log = log . The SIMBAD stars included in our calculations are either previously known X-ray emitters or newly identified RASS counterparts, as defined in § 4.1.1; in addition, we require that the -band errors mag (for a discussion of the 2MASS flags, see Cutri et al., 2003).

As mentioned above, a small number of these stars have both a cataloged spectral type and one derived from an APO spectrum. In cases, using either type has no effect on the distributions; in cases it does. of these stars were classified as “F/G” or “K” by Zickgraf et al. (2003); these spectra are lower resolution than ours, and we therefore use our APO-derived types instead. The other stars are V* V842 Her and StKM , discussed above; we used the SIMBAD types for these two.
We then have F, G, K, and M stars with which to construct empirical log ranges. The distributions are shown in Figure 5. The derived flux ratio ranges and means are listed in Table 1 alongside the earlier log values. Based on their log values, we are able to add three of the SIMBAD M stars lacking a cataloged and previously unassociated with RASS sources to our list of new stellar X-ray emitters. In total, we have identified F, G, K, and M stars cataloged in SIMBAD but previously unassociated with an X-ray source as RASS source counterparts. These are included in our final catalog; see § 5.
4.2. The APO spectroscopic sample
Our search for cataloged candidate counterparts identified RASS sources with no obvious counterparts in either SIMBAD or NED101010Some sources with matches were included, e.g., matches to Tycho stars lacking a published spectral type.. The objects from a RASS source made up the list of primary targets for our spectroscopic campaign. We used the Dual Imaging Spectrograph (DIS) on the APO -m telescope to obtain spectra for of these objects, and for objects with separations ′′, over the course of half nights from 2003 Sep to 2007 Jul. In our standard set-up, the DIS ‘low’ blue grating is centered on Å (with a dispersion of Å per pixel); its ‘medium’ red grating is centered on Å ( Å per pixel); we use a ( pixel) slit. This results in wavelength coverage from to Å with a resolution of in the blue and in the red. Almost all of our observing was done in bright time, and our integrations were typically min. The data were flux calibrated with standards taken each night. The spectra were reduced with a script written in PyRAF, the Python-based command language for the Image Reduction and Analysis Facility (IRAF)111111PyRAF is a product of the Space Telescope Science Institute, which is operated by AURA for NASA. IRAF is distributed by the National Optical Astronomy Observatories, which are operated by the Association of Universities for Research in Astronomy, Inc., under cooperative agreement with the National Science Foundation.. All spectra were trimmed, overscan and bias corrected, cleaned of cosmic rays, flat fielded, extracted, dispersion corrected, and flux calibrated using standard IRAF tasks.

In most cases, a single observation was sufficient to obtain a spectral type for the candidate counterpart; we thus have error circles with a unique spectrum. In error circles we took at least two spectra of the same target, generally because the target was relatively faint () or the weather uncooperative, and the first spectrum was of insufficient quality to allow for confident typing. In an additional RASS error circles we took spectra for more than one target, usually because of the presence of an apparent companion to our target. The total number of RASS sources considered is nearly if we include the SIMBAD stars with cataloged spectral types for which we obtained APO spectra.
| Offset | log | APO | SIMBAD | |||||
|---|---|---|---|---|---|---|---|---|
| 1RXS J | Counts s-1 | SDSS J | (′′) | (mag) | (mag) | type | data | |
| 002203.7… | 002204.47… | K7e | ||||||
| 002204.20… | K5 | |||||||
| 083203.9… | 083203.74… | K1 | ||||||
| 083202.66… | G0 | |||||||
| 092455.1… | 092456.44… | M3 | ||||||
| 092455.33… | M2 | RX J0924.95756 1; | ||||||
| 110830.8… | 110830.87… | G7 | ||||||
| 110830.87… | G2 | RX J1108.50117 | ||||||
| 114930.0… | 114930.34… | G0 | ||||||
| 114930.34… | G6 | |||||||
| 123247.7… | 123247.68… | G6 | ||||||
| 123247.28… | G8 | |||||||
| 132339.1… | 132338.98… | M0 | ||||||
| 132339.64… | M1 | |||||||
| 135902.2… | 135902.75… | K5 | GPM 209.761906…; ; ; | |||||
| 135903.24… | M3 | |||||||
| 140148.9… | 140148.48… | K4 | ||||||
| 140148.69… | M0 | |||||||
| 150656.8… | 150656.87… | M3 | ||||||
| 150656.90… | M3 | |||||||
| 153826.3… | 153826.02… | K3 | BD53 1797B; ; ; i | |||||
| 153826.38… | K3 | HD 234250; ; ; K2; i | ||||||
| 164129.8… | 164129.54… | G8 | BD40 3051aaThe given SIMBAD position is offset by , but this appears to be the SDSS star.; | |||||
| 164129.47… | G5 | |||||||
| 171017.5… | 171017.05… | K4 | 2E 1709.96325 | |||||
| 171016.46… | M0 | 2E 1709.96325 | ||||||
| 235942.7… | 235943.68… | K7 | ||||||
| 235943.80… | K3 | |||||||
| 001619.1… | 001620.75… | K3e | GSC 0466401105; | |||||
| 001620.16… | K7 | |||||||
| 015119.8… | 015119.97… | G9 | [ZEH2003] RX J0151.31324 2 | |||||
| 015119.97… | M3 | |||||||
| 020419.0… | 020419.12… | M3 | [ZEH2003] RX J0204.31318 2 | |||||
| 020418.31… | K0 | |||||||
| 085921.0… | 085922.99… | G8 | ||||||
| 085922.79… | M0 | |||||||
| 091140.6… | 091139.52… | M4 | ||||||
| 091140.92… | M1 | |||||||
| 145626.1… | 145628.50… | G0 | TYC 38644101; ; ; | |||||
| 145626.46… | K5 | |||||||
| 150521.8… | 150523.09… | G6 | ||||||
| 150520.38… | G6 | |||||||
| 152350.6… | 152348.89… | M3 | NLTT 40162; PM | |||||
| 152351.61… | QSO | |||||||
| 160207.9… | 160206.84… | G9 | TYC 387715221; ; ; | |||||
| 160208.39… | K1 | |||||||
| 163845.2… | 163845.73… | K2 | ||||||
| 163844.64… | K7 | |||||||
| 171702.0… | 171702.55… | G6 | ||||||
| 171702.12… | K2 | TYC 38914101; ; ; | ||||||
| 172713.4… | 172715.09… | G7 | ||||||
| 172714.58… | G8 | TYC 39004171; ; ; |
Note. — Pairs above the line are close companions. In several cases, the SDSS pipeline returns the same data for both stars. The SIMBAD data includes, when available, the cataloged object name, its magnitude, the corresponding log , and/or its type. “” or “i” indicates a double or multiple star system and “PM” a high proper-motion star.
To obtain spectral types for our targets, we used the Hammer (Covey et al., 2007). The Hammer automatically predicts the Morgan-Keenan (for stars earlier than M) or Kirkpatrick (for later stars) spectral type on the basis of a fit to a set of spectral indices121212The Hammer is written in IDL and is available from http://www.cfa.harvard.edu/kcovey/.. The Hammer also allows the user to interactively modify the assigned spectral type. Every spectrum was therefore checked by eye before a final type was assigned.
As noted above, in cases we obtained at least two spectra of a candidate RASS counterpart, generally because our first spectrum was fairly noisy. Nevertheless, of the time the stellar types assigned to a given star agree to within two subclasses, which we take to be our uncertainty. For those cases where the difference is larger, we assigned the spectral type obtained from fitting the highest signal-to-noise spectrum for that particular star.
In Figure 6 we present the positional offset and (as defined earlier) distributions for stars in of the RASS error circles where we selected only one target. For these calculations, we updated the positional (and photometric) data for the SDSS stars to the more recent Data Release 6 (DR6; Adelman-McCarthy et al., 2008) values. Of the five objects not included, one is a QSO, two are stars whose spectra are too poor for confident typing, and two others lack data in DR6 because they fall on the survey edges.
of the stars have separations ′′; to these we add two stars with separations ′′ previously identified as RASS counterparts by Zickgraf et al. (2003) but lacking a spectral type. Of these stars, are F, G, K, or M stars (two others were typed as A stars131313Discussed in the Appendix. and one is a CV). If we apply the same -band quality cut as to our earlier sample ( mag), and remove objects for which the RASS flag is not , we are left with a sample of stars: F, G, K, and M.
The log distributions for these F, G, K, and M stars are plotted in Figure 7. We also include the flux ratio means and ranges derived from the RASS/SIMBAD sample (see Table 1). We identify as spectroscopically confirmed counterparts to RASS X-ray sources objects with within of the mean value of optically bright X-ray emitters in the same spectral type range. These plots show clearly that the probability that a spectroscopic target is a RASS counterpart increases as we move to later spectral types. Only of the spectroscopically identified F stars fall within the log range derived from the RASS/SIMBAD F stars (); for the G stars, the fraction is of (). For K stars and M stars the fraction is much higher: of K stars () and of M stars () have log within their respective ranges.
The X-ray, optical, and infrared properties of the new F, G, K, and M X-ray emitters identified here are included in our final catalog141414Note that this number reflects our removal of three stars (one G, one K, and one M) observed at APO from our final catalog based on our comparison to the Flesch & Hardcastle (2004) catalog. See § 5.2., described in § 5, along with the RASS/SIMBAD F, G, K, and M stars identified above. Below we discuss the error circles for which we obtained multiple APO spectra, our candidate flare stars, and a new CV discovered in this spectroscopic campaign.
4.2.1 The error circles with multiple spectra
For the error circles in which we have APO spectra for several targets, we calculated the positional separation and log ratio and obtained a spectral type for each. The best candidate counterpart in each error circle was then identified on the basis of its proximity (only stars ′′ from a RASS source whose X-ray flag is were considered) and the appropriateness of its given its spectral type. In error circles we identified a single stellar counterpart ( F, G, K, and M stars); these are included in our final catalog.
In another error circles, two stars met our criteria; in of these cases our target has an apparent close companion (separations of or less), making it difficult to avoid photometric uncertainties in the SDSS and 2MASS catalogs and sometimes to obtain clean spectra with our slit. We list these error circles separately in Table 3. Higher resolution X-ray observations are required to determine which of the possible counterparts is in fact the X-ray source; it is also possible, of course, that both stars are X-ray emitters.

4.2.2 The candidate flare stars
Many of the stars for which we obtained multiple spectra were M stars with what appeared to be stronger-than-average emission lines. Figure 8 shows the spectra for the target with the largest number of observations, the proposed counterpart to 1RXS J080826.7434745. The initial spectrum suggested that we caught this M4 star flaring, and we returned to it regularly over the course of the next two years. All of the spectra include the Balmer and CaII H & K emission lines typical of M star spectra. However, these features are much stronger in the initial spectrum, as can be clearly seen in the bottom panel of Figure 8, where the spectra have been normalized to the value of their flux at Å. In addition, an emission feature at Å is evident in the initial spectrum and absent in the quiescent spectra. During a flare, the amount of material emitting at chromospheric temperatures increases, and lines due to high-excitation species such as HeI, which is responsible for this feature, appear (Reid & Hawley, 2005). The blue continuum visible in the initial spectrum is also typically observed in flare events (e.g., Hawley & Pettersen, 1991). In a forthcoming paper (E. Hilton et al., 2009, in preparation) we describe the properties of M stars for which we detected similar changes to the emission lines and continuum.

4.2.3 A new CV: SDSS J171456.78585128.3
APO spectra for the proposed counterpart to the RASS source RXS J171456.2585130 are presented in Figure 9. We obtained six spectra for this star on five separate nights between 2005 Sep 14 and 2006 May 17 using DIS in the low-resolution setup. While the underlying spectrum corresponds to that of a K4 star, strong, persistent Balmer emission is obvious (see the top panel of Figure 9). The emission lines are broader than for the M star in Figure 8, suggesting that we are observing accretion rather than flaring, and there is therefore a currently invisible companion to the K4 star.
On 2007 Jul 16, we obtained three more spectra of this star using DIS in the high-resolution setup ( Å per pixel in the blue, Å in the red, with the gratings centered on and Å respectively). These spectra confirmed that the emission lines are broader than those of flaring stars, and also more structured than those typically seen in flares or in symbiotic systems (see bottom panel of Figure 9). We used IRAF’s splot routine to measure the H and H equivalent widths (EqWs) in our two longest observations ( and min). The average H EqW Å, corresponding to a flux of ergs cm-2 s-1; for H, the EqW Å and the flux ergs cm-2 s-1. We conclude that SDSS J1714 is a new CV.
To measure its period, we used DIS in its new low-resolution setup ( Å per pixel in the blue, Å in the red, with the gratings centered on and Å) to acquire a dozen -min spectra on 2007 Oct 07. Since the secondary in this system is a K star, we expected the orbital period to be long, on the order of 5 to 6 hours. In fact, our radial velocity measurements suggest that the period is hours and further observations are required to determine SDSS J1714’s period and nature. Its log of , while low, is consistent with it being a dwarf nova, as is its position in the log vs. H EqW plot (see § 6.1.1).
5. The Catalog
5.1. Distances and X-ray Luminosities
We derive distances to the F, G, K, and M stars in our catalog using photometric parallax relations appropriate for dwarfs on the main sequence, since these dominate our sample. We construct colors using the Tycho/USNO magnitudes for stars in the catalog ( lack a magnitude) and adopt the relationship between and derived by Covey et al. (2008). We then use a fit to the M vs. tabulations of Kraus & Hillenbrand (2007) to derive distances to each star. Adopting the same conversion of count s-1 into erg cm-2 s-1 used in § 4.1.1, we calculate X-ray luminosities for our stars.
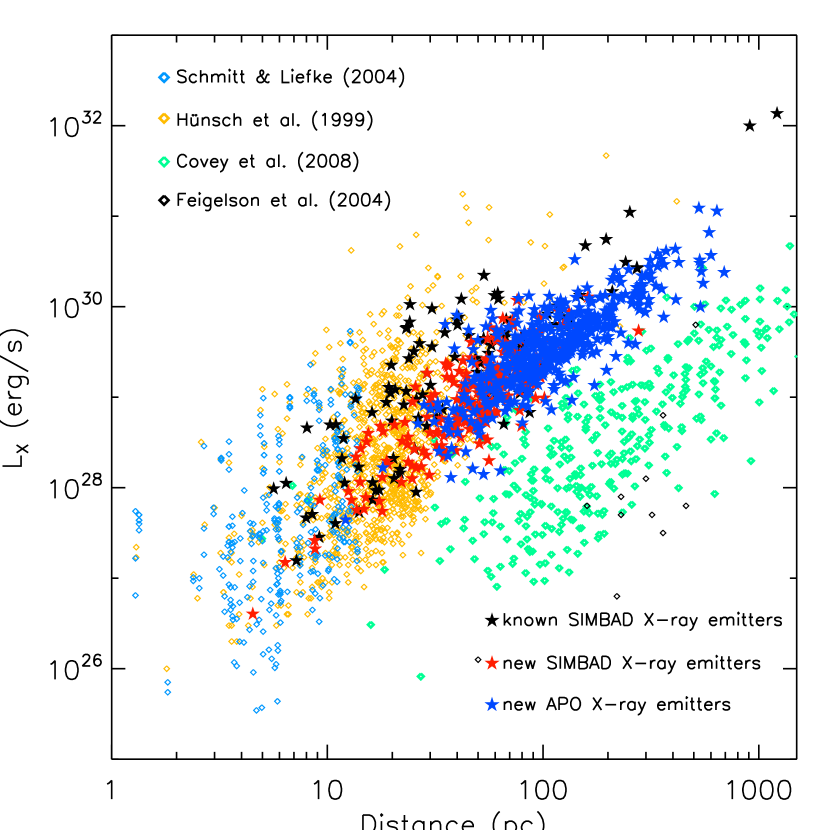
These luminosities are shown in Figure 10 as a function of distance. We also plot data from several other catalogs of X-ray emitters. The Schmitt & Liefke (2004) and Hünsch et al. (1999) catalogs are both of ROSAT detections of nearby stars, and the luminosities are also over the keV range. We also include the X-ray emitting stars identified by Feigelson et al. (2004) in the Chandra Deep Field North and the identified by Covey et al. (2008) in the Extended Chandra Multiwavelength Project (here we use the keV luminosities). Our sample covers a unique area in the –distance plane, with ergs s-1 and D pc.
| Offset | SDSS | 2MASS | log | Syn. M | Distance | LX | |||
|---|---|---|---|---|---|---|---|---|---|
| 1RXS J | Counts s-1 | SDSS J | (mag) | (mag) | (mag) | (pc) | (ergs s-1) | ||
| 000053.1… | 000051.96… | ||||||||
| 000312.8… | 000312.63… | ||||||||
| 000447.9… | 000446.97… | ||||||||
| 000659.3… | 000658.40… | ||||||||
| 000714.2.. | 000714.06… | ||||||||
| 000803.1… | 000803.42… | ||||||||
| 000921.2… | 000921.79… | ||||||||
| 001745.3… | 001745.03… | ||||||||
| 002127.8… | 002127.08… | ||||||||
| 002552.2… | 002550.97… |
Note. — This table is available in its entirety in a machine-readable form in the online journal. A portion is shown here for guidance regarding its form and content.
5.2. Comparison to the Flesch & Hardcastle (2004) and Parejko et al. (2008) catalogs
As a test of the robustness of our identifications, we queried the Flesch & Hardcastle (2004) catalog for matches to our own. They provide classifications for X-ray sources that appear in our catalog151515In nine cases there are two entries in the Flesch & Hardcastle (2004) catalog for what appear to be different detections of the same X-ray source.. have counterparts that are classified as stars; while these are therefore previously known sources, our work provides additional information (e.g., spectral types) not available in the Flesch & Hardcastle (2004) catalog.
The other sources have counterparts identified by Flesch & Hardcastle (2004) as radio sources (six), galaxies (nine), or AGN/QSOs (three). However, in four of these cases, Flesch & Hardcastle (2004) calculate that their catalog-level matching has most likely produced a random association between e.g., a radio source and an optical object. For five sources, inspection of the SDSS data for the RASS error circles reveals that the position of the Flesch & Hardcastle (2004) counterpart is that of our proposed stellar counterpart, or is offset but still consistent with being the star in our catalog (i.e., there is no SDSS object detected at the Flesch & Hardcastle (2004) position and the nearest object is the bright star we identify as the source). The available SDSS data indicate that the proposed AGN/QSOs are the RASS source counterparts, and we remove these three sources from our catalog. This leaves only three cases in which Flesch & Hardcastle (2004) propose a different (non-AGN) counterpart to the X-ray source.
In another cases a source in our catalog is classified by Flesch & Hardcastle (2004) simply as an X-ray source. They calculate that of these entries most probably have stellar counterparts and that for another sources their proposed association is most likely random. Inspection of the SDSS data for the remaining Flesch & Hardcastle (2004) RASS error circles finds that in cases the counterpart’s position is that of our cataloged star, or is offset but still consistent with being the star in our catalog. For of these sources, therefore, the Flesch & Hardcastle (2004) classification either agrees with or does not contradict our own.
We also checked our catalog for entries listed in the Parejko et al. (2008) catalog of X-ray emitting galaxies, constructed from matching the RASS to the so-called main galaxy sample from the SDSS Data Release 4 (DR4; Adelman–McCarthy et al., 2006). sources in our catalog are listed as having an SDSS galaxy as the X-ray counterpart. This sample is dominated by unclassifiable galaxies (), which Parejko et al. (2008) define as galaxies for which most or all of their chosen diagnostic emission lines have fluxes too weak to be measured, and for which most of the matches to the RASS are in fact random. Unsurprisingly, only two of these galaxies are quoted as having a more than chance of being the X-ray counterpart; are less than likely to be the RASS source. Of the six remaining galaxies, only a transition galaxy and a galaxy with unclassified emission, meaning that its position in the standard BPT diagrams (Baldwin et al., 1981) shifts according to the line ratios being considered, have a more than chance of being the X-ray source counterpart.
Given this broad agreement between our classifications and those of both Flesch & Hardcastle (2004) and Parejko et al. (2008) and the additional information provided by our catalog, we list all of the (non-AGN) sources that appear in their catalogs and ours in our final catalog and note their Flesch & Hardcastle (2004) and/or Parejko et al. (2008) classification.
5.3. Available data
The full version of our catalog of stars is available on-line only. Sample data and derived quantities are shown in Table 4. We give the RASS source name, positional error, and count rate, the SDSS counterpart’s name, the offset between the X-ray and optical position, and the SDSS and 2MASS magnitudes. We caution that any SDSS photometry for objects brighter than is suspect, and should be used only once the objects’ flags (included in the full on-line catalog) have been considered. We then provide the calculated log , the synthetic M and corresponding distance for stars with a cataloged , and the resulting X-ray luminosity and associated error (assuming count s-1 corresponds to erg cm-2 s-1).
The on-line catalog contains the complete SDSS and 2MASS photometry, and where relevant, SIMBAD data or APO observation dates and derived spectral types, as well as classification information from the Flesch & Hardcastle (2004) or Parejko et al. (2008) catalog.

5.4. Reliability of our identifications
In order to test the reliability of our identifications, we replicate the test described in § 3 to estimate the probability of false matches for the stars included in our final catalog. We shift the positions of our stars by a few arcminutes and rematch the catalog to the RASS. This consistently returns fewer than five matches, indicating that the chance of a random association between a star in our catalog and a RASS source is under .
A more conservative estimate of the number of false identifications in our catalog comes from our comparison to the Flesch & Hardcastle (2004) catalog discussed above. There are roughly X-ray sources listed in that catalog for which we also provide identifications. For of those our classifications disagree, and we take this to be an upper limit on the contamination rate of our catalog as a whole.
6. Using SDSS Spectroscopic Catalogs to Identify X-ray Emitting…
6.1. Cataclysmic Variables
As evidenced from their small numbers in our SIMBAD and APO sample of RASS counterparts, CVs and WDs (discussed in § 6.2) are both rarer types of stellar X-ray sources. In order to build up meaningful samples of these objects, we use the full SDSS spectroscopic catalogs for our correlations with the RASS.
The properties of the new CVs spectroscopically identified in SDSS have been described by Szkody et al. (2002, 2003, 2004a, 2005, 2006, 2007); an additional previously known CVs have been recovered in the survey data. SDSS CVs have X-ray counterparts in the RASS; all but one have been published in the Szkody et al. papers (SDSS J100515.38191107.9 will be included in the next catalog). Below we discuss the distributions for the X-ray emitting CVs and reproduce the Patterson & Raymond (1985) log vs. H EqW plot for the for which we have spectra.
6.1.1 Flux ratios and H equivalent widths
We calculate log for the X-ray emitting SDSS CVs, for EI UMa, the only CV in our RASS/SIMBAD sample not included in the SDSS CV catalogs, and for SDSS J1714, the CV discovered in our APO spectroscopic survey. While this distribution is fairly symmetric about the median () (left panel, Figure 11), we find, as expected, an offset between the flux ratios for confirmed polars (median log ) and for dwarf novae (median log ) (right panel, Figure 11).
Patterson & Raymond (1985) described a correlation between and the EqW of the H emission line, a proxy for the CV’s overall emission strength. In Figure 12 we plot these two quantities for our CV sample161616The color-dependent difference between and is small: for a low-redshift QSO with (Fukugita et al., 1996).. The H EqWs are reported in Szkody et al. (2002, 2003, 2004a, 2005, 2006, 2007) for all but two of these CVs (SDSS J083642.80532838.1/SW UMa and SDSS J100515.38191107.9); in those cases (and that of our new CV) we measured them using IRAF’s splot routine.
The scatter around the predicted by the Patterson & Raymond (1985) relationship is comparable to that found in other studies (e.g., Richman, 1996). However, there are clear departures from this relationship, with the polars appearing to form a distinct population from the dwarf novae and other CVs. Furthermore, the SDSS CVs tend to have higher ratio than those included in the earlier studies, where only a handful had log (Richman, 1996).
6.1.2 Outliers
SDSS J015543.40002807.2 occupies an unusual position in Figure 12 for a polar because of its low X-ray-to-optical flux ratio (log ). As noted by Szkody et al. (2002), SDSS J0155 was significantly brighter when observed by SDSS than in its Digitized Sky Survey image. A change in brightness of a few magnitudes–typical for polars entering a phase of stronger accretion–would be sufficient to explain the apparent inconsistency of this system’s log relative to that of other polars. Follow-up observations by Woudt et al. (2004) and Schmidt et al. (2005b) confirmed the large changes in mass transfer rate in this system.
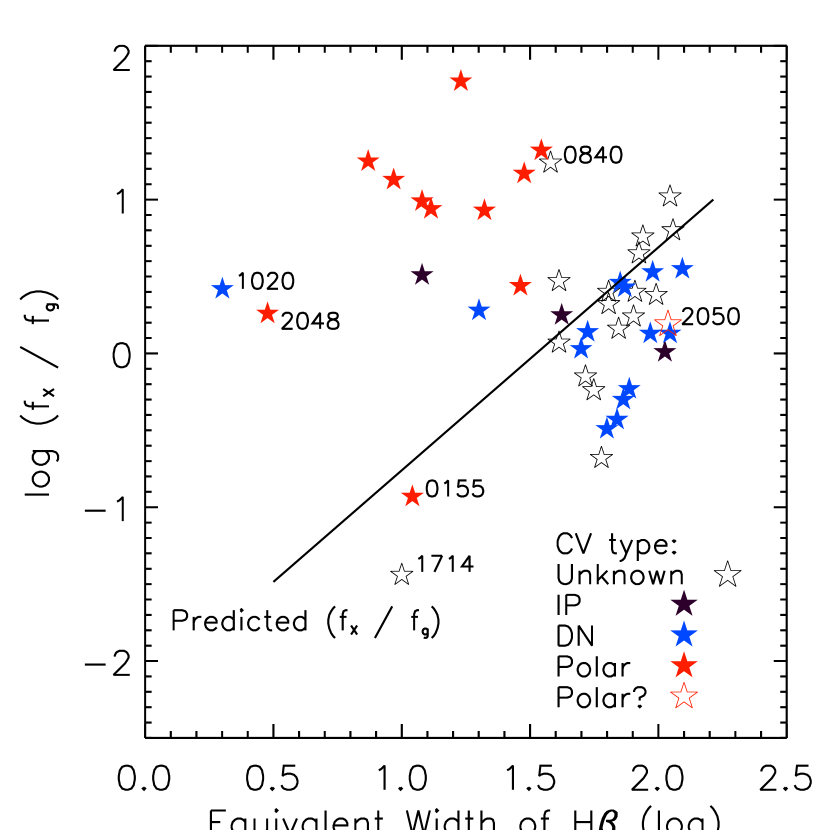
The spectrum of SDSS J205017.84053626.8 shows HeII emission, but initial follow-up observations of this CV could not confirm that this is a magnetic system (Szkody et al., 2003). Its log of is similar to that of other intermediate polars (IPs) in our sample, but SDSS J2050 has a period of hr, much shorter than is typical for IPs. Homer et al. (2006) determined that this is an example of the most magnetized type of CV, a disk-less, stream-fed polar.
SDSS J102026.53530433.1, the dwarf nova KS UMa, has an anomalously low H EqW relative to other DNe; this is because its SDSS spectrum was taken during an outburst and is dominated by the accretion disk.
The spectrum of SDSS J204827.91005008.9 is very unusual, with a hump apparent between and Å and a typical M-dwarf continuum to the red of the hump (see Szkody et al., 2006). Follow-up observations by Schmidt et al. (2005a) led to the conclusion that this low-accretion magnetic binary is possibly a pre-polar. The X-ray luminosity derived for this CV is an order of magnitude greater than the for similar SDSS systems, where the coronae of the late-type companion stars are thought to be responsible for the X-ray emission (Szkody et al., 2004b). Schmidt et al. (2005a) suggested that this weakens the case for SDSS J2048 as the -detected X-ray source. Accordingly, on 2005 Aug 29 we obtained a DIS low-resolution spectrum for the most obvious potential X-ray counterpart in the RASS field, a bright nearby star (), which we then typed using the Hammer. This late G star has a 2MASS counterpart with ; the resulting log of is within the typical G star range (see Table 1). While this suggests that the G star may in fact be the RASS counterpart, this is a crowded field; pointed X-ray observations are required to confirm that this star, rather than SDSS J2048, is the RASS-detected X-ray source.
Finally, when discovered, SDSS J084026.16220446.6 did not appear to have strong HeII emission (Szkody et al., 2006), but its log and H EqW are very similar to those of the known polar GG Leo. However, definitively classifying this system and many other SDSS CVs clearly requires more observational data than are provided by the survey.
6.2. White Dwarfs
WDs cool as they age, and the most commonly observed WDs, DAs, have an effective temperature (Teff) distribution that peaks at K (e.g., Eisenstein et al., 2006). At that temperature, one would not expect a typical DA to be a significant producer of thermal X rays. However, Shipman (1976) pointed out that the X rays produced in the hotter interior of a DA should travel through its thin hydrogen atmosphere unabsorbed.
The consensus was that the RASS would include upwards of X-ray emitting DAs (e.g., Barstow, 1989), but to date the number found in the RASS is far smaller. Fleming et al. (1996) searched RASS sources for the super-soft sources (HR1 and HR2 ), found only DAs, and concluded that of DAs are opaque to X-ray emission. More recent RASS identification programs have added only a few dozen X-ray emitting WDs to this sample (e.g., Zickgraf et al., 2003).
The SDSS DR4 produced a catalog of spectroscopically confirmed WDs. of these are DAs and are new (Eisenstein et al., 2006). Correlating SDSS WD lists with the RASS does not add many new WDs to the sample of known X-ray emitters (see the Appendix for details about our correlations). However, among these new X-ray emitters are three that, if confirmed, may be the coolest X-ray emitting DAs detected (see § 6.2.2), suggesting that these fainter SDSS X-ray emitting WDs, while small in number, may prove to be very interesting. Below we summarize our results before discussing the DAs’ X-ray-to-optical flux ratio and temperature distributions.
6.2.1 New SDSS X-ray emitting white dwarfs
We list new confident DA WD/RASS source associations in Table 5; this number includes three post-DR4 WDs, described below, and four McCook & Sion (1999) DAs not previously identified as X-ray sources171717Our matching returned an additional known X-ray emitting DAs; ten were identified by Fleming et al. (1996) or Zickgraf et al. (2003) or both; the other DA was reported as an X-ray emitter by Chu et al. (2004).. Table 5 gives the relevant data for these DAs, including the McCook & Sion (1999) catalog name if available.
| Teff | Offset | log | McCook & | |||
|---|---|---|---|---|---|---|
| SDSS J | (K) | 1RXS J | (′′) | Counts s-1 | Sion (1999) | |
| 075106.51301726.4 | 075107.4301719 | aa photometry is flagged in SDSS. | ||||
| 082346.14245345.6 | 082345.4245344 | |||||
| 091215.43011958.8 | 091215.5012003 | aa photometry is flagged in SDSS. | WD 0909015 | |||
| 093006.79522803.3 | 093006.7522752 | |||||
| 093608.90382200.5 | 093609.6382237 | WD 0933385 | ||||
| 093921.83264401.1bbPost-DR4 WD. | 093922.8264404 | |||||
| 095245.58020938.9 | 095244.6020946 | WD 0950023 | ||||
| 100543.92304744.9bbPost-DR4 WD. | 100543.7304809 | |||||
| 101339.56061529.5 | 101340.6061556 | |||||
| 113836.33475509.8 | 113836.9475459 | |||||
| 120432.67581936.9 | 120428.0581934 | |||||
| 125938.08603900.0 | 125936.6603910 | |||||
| 132629.58571131.5 | 132634.4571052 | |||||
| 143736.67362213.4bbPost-DR4 WD. | 143738.0362237 | |||||
| 145600.79574150.7 | 145605.0574132 | WD 1454578 | ||||
| 154448.25455039.0 | 154449.3455035 | |||||
| 163418.25365827.1 | 163421.8365859 | |||||
| 022618.60083049.3 | 022615.8083108 | WD 0223087 | ||||
| 074859.06215445.7 | 074858.9215458 | |||||
| 093307.65400637.9 | 093305.6400553 | |||||
| 093456.44023121.1 | 093458.0023151 | WD 0932027 | ||||
| 103237.35512857.9 | 103236.8512809 | |||||
| 112740.90024638.7 | 112741.1024614 | |||||
| 152349.89041434.6 | 152351.0041356 | WD 1521044 | ||||
| 165645.49182437.7 | 165643.7182441 | |||||
| 232658.89002339.9 | 232701.2002337 | |||||
| 232659.23002348.0 | 232701.2002337 |
Note. — Above the line are highly secure RASS counterpart identifications; below it are tentative identifications requiring further observations. SDSS J0936 is listed as a DQ WD by McCook & Sion (1999). However, the SDSS spectrum does not show the carbon absorption lines typical of DQs, and it seems that this is indeed a DA WD.
Three of these DAs are not included in the Eisenstein et al. (2006) DR4 catalog: SDSS J093921.83264401.1, J100543.92304744.9, and J143736.67362213.4. We have therefore fitted the SDSS spectra using the WD models described in Kleinman et al. (2004) to obtain estimates for their Teff and log g. Because of calibration problems with the SDSS spectrum, this fitting fails for SDSS J1437, and we identify it as a DA based on visual inspection of the spectrum. For SDSS J0939, the fits yield that the star is a DA with log g and T K; SDSS J1005 is a DA with log g and T K (see Figure 15).
We also identify ten DAs as less certain RASS counterparts and list them in Table 5 for reference. Follow-up optical and/or X-ray observations are required to confirm these associations.
We further identify several WDs of other types as RASS counterparts. Among these are three DAs with M star companions, two DB WDs, which have helium-rich atmospheres, and a PG 1159 star, a pre-WD star showing strong oxygen and carbon lines. We also identify two other non-DA WDs from our post-DR4 spectra as likely RASS sources. We list these objects in Table 6 and discuss follow-up Chandra observations of the two candidate X-ray emitting DBs in § 6.2.3.
6.2.2 log and temperature distributions
In Figure 13 we plot the log distribution for the Fleming et al. (1996) X-ray emitting DA WDs within the SDSS footprint181818This includes the six WDs from Table 2 listed in the Fleming et al. (1996) catalog. Of the eight WDs in that table, only the last, WD 1725586, has an SDSS spectrum. It is therefore the only X-ray emitting WD identified in our earlier work included in the rest of this analysis.. The median log , with the range being from to . The WDs not cataloged in Fleming et al. (1996) that we have confidently identified as X-ray emitters have flux ratios that fall within this range. Although not included in this Figure, the additional less certain X-ray emitting DAs listed in Table 5 also have flux ratio values within this range.

In Figure 14 we compare the temperature distribution for our X-ray emitting DAs to that of the Fleming et al. (1996) DAs for which Marsh et al. (1997) obtained temperatures. We include previously known and new DAs for which the association with a RASS source is most secure191919One new DA, SDSS J1437, lacks a Teff, as mentioned above.. Only three Fleming et al. (1996) DAs in our sample have Marsh et al. (1997) temperatures and are plotted twice: WD 1026453, 1429373, and 17255863. For these DAs, the difference between the Eisenstein et al. (2006) and Marsh et al. (1997) Teff are rather large (, , and K), with the Eisenstein et al. (2006) Teff being greater in each case. Discrepancies such as these have been noticed in comparisons between SDSS temperatures and those in the literature, particularly for the hotter objects, with the differences reaching at K (D. Eisenstein 2006, private communication). Nevertheless, the temperature distributions for our sample of X-ray emitting DAs (median T K) and that of Fleming et al. (1996) are very similar.

We also plot the Teff distribution for Eisenstein et al. (2006) DAs, normalized to the maximum of the Fleming et al. (1996) distribution. The separation between X-ray emitters and “ordinary” WDs is clear, with the Fleming et al. (1996) DAs having a median T K, compared to K for the Eisenstein et al. (2006) DAs. Interestingly, of the Eisenstein et al. (2006) DAs are hotter than K, the temperature of the coolest Fleming et al. (1996) DA. Even if, as suggested by Fleming et al. (1996), of DAs are opaque to X rays, we would expect of these to be X-ray sources. If we include the uncertain WD/RASS associations, we have to date found roughly half that number. One possible explanation for this discrepancy is that the use of the Fleming et al. (1996) super-softness criterion is too restrictive at fainter X-ray fluxes, where the hardness ratios have larger errors. Alternatively, these sources may be too faint to be detected in the RASS. We plan to explore this question further.
Three of our new X-ray emitting DAs are cooler than the coolest Fleming et al. (1996) DA and below the minimum temperature theoretically needed for X-ray emission from a DA. The three DAs, SDSS J101339.56061529.5, J120432.67581936.9, and J163418.25365827.1, are faint ( mag), and the quoted Teff should be considered with caution. That said, because of the strength of the Balmer absorption lines, model fits to lower temperature SDSS WD spectra are very reliable (D. Eisenstein 2006, private communication). Follow-up optical and especially X-ray observations, given the low X-ray detection likelihoods of the RASS sources, are called for.
One of these DAs, SDSS J1634, was observed with XMM on 2008 Mar 11 (ObsId 0503550701). The X-ray background for these observations was very high; the on-source integration time was very short ( s rather than the s requested) and only MOS data are available. As the MOS is not very sensitive at soft energies, the non-detection of the WD in these data is neither surprising nor conclusive.
| Teff | Offset | log | McCook & | ||||
|---|---|---|---|---|---|---|---|
| SDSS J | (K) | 1RXS J | (′′) | Counts s-1 | Type | Sion (1999) | |
| 093122.86362209.4 | 093119.2362223 | DB | |||||
| 153225.49472700.9 | 153221.7472648 | DB | |||||
| 114635.23001233.5 | aaFit for Teff is unreliable. | 114634.6001238 | PG 1159 | ||||
| 114312.57000926.6 | 114313.8000955 | DA+dM6e | |||||
| 132725.72505711.2bbPost-DR4 WD. | aaFit for Teff is unreliable. | 132725.7505713 | DA+dM | WD 1325512 | |||
| 134100.03602610.4 | 134101.0602556 | DA+dM3e | |||||
| 141740.23130148.7bbPost-DR4 WD. | 141741.2130206 | DA+dM | WD 1415132 | ||||
| 223051.15125706.8 | 223051.6125713 | DA+dM4e |
6.2.3 Observations of candidate cool X-ray emitting DBs
The first two WDs listed in Table 6 are DB white dwarfs newly identified by Eisenstein et al. (2006). These DBs are cooler than one would expect for non-DA X-ray emitters (cf. discussion in O’Dwyer et al., 2003); however, both are at relatively large offsets from the corresponding RASS sources. Furthermore, these RASS sources have low detection likelihoods; visual inspection of the RASS images suggests that both sources were marginally detected. ksec Chandra snapshots of SDSS J0931 on 2008 Jan 16 (ObsId 8916 (catalog ADS/Sa.CXO#Obs/8916)) and J1532 on 2008 Jun 01(ObsId 8917 (catalog ADS/Sa.CXO#Obs/8917)) were therefore taken to locate the RASS source and test whether the DBs are in fact X-ray sources. Sources were identified using the Ciao routine dmextract.
There is no Chandra source at the position of the WD in either observation, nor do we appear to have detected either of the RASS sources. We discuss each observation below; we conclude that the RASS sources were either spurious or transient.
-
•
SDSS J0931 The closest source to the RASS position is a weekly detected () optically faint ( mag) galaxy202020Star/galaxy separation at these magnitudes is unreliable (Scranton et al., 2002). Taking into account the photometric errors, SDSS J has , giving it the UV-excess typically seen in SDSS QSOs (cf. Richards et al., 2002); its log of is consistent with this being an AGN or QSO. While it is offset by from the RASS position, it seems unlikely that this is the RASS source, however, as its Chandra count rate is substantially less than that predicted from the RASS source count rate.
We note the serendipitous detection of the counterpart to the RASS source 1RXS J. SDSS J is a relatively bright ( mag212121This is the Petrosian magnitude.) z early type galaxy lacking both the photometric UV-excess and the strong spectroscopic emission lines typically seen in AGN. The likely counterpart to a FIRST source, this is plausibly an X-ray emitting BL Lac, as suggested by Plotkin et al. (2008), although it also has some similarities to e.g., CXOU J031238.9765134, an X-ray bright optically normal galaxy (XBONG; Comastri et al., 2002).
-
•
SDSS J1532 The closest Chandra-detected source corresponds to a faint SDSS object ( mag). Within the photometric errors, SDSS J has ; its log of is consistent with this being an AGN or QSO. However, this object is over from the RASS position and its Chandra count rate is significantly less than that predicted based on the RASS source count rate.
7. Conclusion
We have used photometric and spectroscopic data from SDSS to identify stellar X-ray emitters detected in the All-Sky Survey. The majority of these are optically bright stars with coronal X-ray emission, and were therefore not identified based on routine SDSS spectroscopy, which typically does not target mag objects. Instead, we used SDSS imaging photometry, correlations with 2MASS and other catalogs, and spectroscopy from the APO -m telescope to identify these stellar X-ray counterparts. Our sample of X-ray emitting F, G, K, and M stars characterized in this fashion is one of the largest X-ray selected samples of such stars. Our catalog also includes a known WD, WD 1725586, not previously identified as an X-ray source, as well as a new X-ray emitting CV, SDSS J171456.78585128.3, identified on the basis of follow-up APO observations. We estimate that our contamination rate by false matches between a RASS source and a star is .
In order to expand the sample of X-ray emitting WDs and CVs, we also matched the SDSS spectroscopic catalogs of these objects (i.e., Eisenstein et al., 2006; Szkody et al., 2007) to the RASS. We identified of the SDSS CVs published to date as RASS sources; roughly half are SDSS discoveries, with the others being previously known systems. We add a new X-ray emitting CV to this list; SDSS J10051911 is among the CVs spectroscopically identified since the last SDSS catalog (Szkody et al., 2007) and is a SDSS discovery.
Correlating the SDSS DR4 WD catalog of Eisenstein et al. (2006) with the RASS does not yield very many new entries in the catalog of known X-ray emitting WDs. We identify DA WDs included in Eisenstein et al. (2006) as RASS sources; of these are new identifications (e.g., not included in the Fleming et al. (1996), Zickgraf et al. (2003), and/or Chu et al. (2004) catalogs of X-ray emitting WDs). Examination of post-DR4 spectroscopy allows us to identify three additional SDSS-discovered DAs as RASS counterparts, but the total number of X-ray emitting WDs in SDSS remains small.
This dearth of new X-ray emitting WDs may be a result of the relative sensitivities of the two surveys. Stellar counterparts to RASS sources tend to be very bright optically, and can be identified without requiring the depth of SDSS–while the fainter WDs discovered by SDSS are unlikely to be bright enough in the X-ray regime to have RASS detections (e.g., because they are too distant). However, among the new RASS WDs are three that, if confirmed, may be the coolest X-ray emitting DAs detected to date, suggesting that these fainter SDSS X-ray emitting WDs, while small in number, may prove to be very interesting. In these cases, as in the cases of other, less certain WD/RASS associations we propose, follow-up X-ray and/or optical observations are necessary.
| Offset | log | |||||
|---|---|---|---|---|---|---|
| 1RXS J | Counts s-1 | Name | (′′) | (mag) | Type | |
| 012041.7154141 | HD 8110 | G8IV | ||||
| 015332.2124047 | HD 11520 | F6III | ||||
| 082929.4453210 | BD+46 1404 | K0III | ||||
| 113615.1662047 | CCDM J11362+6621AB | F5IV; | ||||
| 141050.6623121 | HD 124370 | F2IV | ||||
| 164532.0422651 | HD 151445 | F5IV | ||||
| 165947.2375045 | HD 153777 | F2IV | ||||
| 171558.3270804 | HD 156362 | K2III | ||||
| 171701.2264252 | HD 156536 | F3IV | ||||
| 013552.3000559 | HD 9806 | A2 | ||||
| 032728.1065748 | HD 21468 | A2 | ||||
| 093642.4565820 | HD 82861 | Am | ||||
| 130412.8031257 | HD 113498 | A2 | ||||
| 132218.6055348 | V BC Vir | A; RR | ||||
| 140251.4614051 | HD 122944 | A2 | ||||
| 144952.6035517 | HD 130770 | A3 | ||||
| 155108.2525439 | HD 142282 | A0; i | ||||
| 163147.7453527 | BD+45 2422B | A0; i | ||||
| 165344.9630608 | HD 153204 | A2 | ||||
| 171337.2304151 | V TU Her | A5; Al |
Note. — “” or “i” indicates a double or multiple star system, “RR*” a RR Lyrae star, and “Al” an Algol-type binary.
Non-Main Sequence And A Stars
Table 7 gives the basic properties of the nine SIMBAD stars within ′ of a RASS source cataloged as belonging to luminosity classes II, III, and IV that have not previously been associated with an X-ray source. We recovered an additional previously identified X-ray emitting members of these luminosity classes (from Fleming et al., 1989a; Haisch & Schmitt, 1994; Favata et al., 1995; Hempelmann et al., 1996; Appenzeller et al., 1998; Hünsch et al., 1998a, b).
Table 7 also includes these data for the unpublished RASS/SIMBAD A stars. A stars are not generally predicted to be X-ray emitters; an unseen, young, active later-type companion is usually thought to be the source for the observed X rays (c.f. discussion in Güdel, 2004). While we recover seven A stars that are previously known X-ray sources (from Stocke et al., 1991; Simon et al., 1995; Shaw et al., 1996; Appenzeller et al., 1998; Hünsch et al., 1998b; Schröder & Schmitt, 2007), it is unlikely, therefore, that all the other matched A stars are X-ray sources. However, the available SDSS data do not allow us to propose other counterparts to these X-ray sources. Follow-up X-ray and/or optical observations are required to test whether they are in fact the RASS sources.
| Offset | SIMBAD | Offset | Published | First APO | APO | ||
|---|---|---|---|---|---|---|---|
| 1RXS J | SDSS J | (′′) | name | (′′) | Type | Observation | Type |
| 002552.2095756 | 002550.97095740.0 | NLTT 1354 | M3 | 2003 Sep 03 | M4 | ||
| 010257.2095145 | 010257.42095140.5 | HD 6204 | G0 | 2003 Sep 03 | G3 | ||
| 012724.2093359 | 012723.80093409.1 | FBS 0124098 | M3… | 2003 Nov 08 | M3 | ||
| 020000.4003216 | 015959.78003219.3 | [BHR2005] 284 | M3.5V | 2003 Nov 16 | M3 | ||
| 020144.5101743 | 020143.87101728.9 | NLTT 6782 | M3… | 2003 Nov 08 | M4 | ||
| 020221.0010715 | 020223.99010708.3 | BD01 277 | K0 | 2005 Nov 20 | K3 | ||
| 021042.8093817 | 021044.57093826.0 | NLTT 7231 | M4 | 2003 Nov 08 | M3 | ||
| 021559.9092913 | 021558.94092912.4 | EUVE J021509.5aaX-ray source identified by Schwope et al. (2000). | Me | 2004 Oct 04 | M3 | ||
| 022839.4093550 | 022839.68093545.5 | HD 15424 | F8 | 2005 Jan 05 | F2 | ||
| 022942.6003026 | 022941.79003029.2 | BD01 341a | G | 2003 Sep 03 | G8 | ||
| 025150.0081338 | 025148.21081342.3 | FBS 0249084 | M5… | 2004 Oct 04 | M4 | ||
| 031114.2010655 | 031115.49010630.8 | [BHR2005] 344 | M5.5V | 2005 Nov 20 | M6 | ||
| 101627.8005127 | 101626.93005139.4 | RX J1016.40051bb… by Appenzeller et al. (1998). | M0e | 2004 Dec 03 | M1 | ||
| 103546.1021559 | 103546.90021558.3 | RX 1035.70215bb… by Appenzeller et al. (1998). | M2e | 2004 Dec 03 | M3 | ||
| 104743.9652750 | 104743.71652736.0 | HD 93270 | F8 | 2005 Jan 29 | F7 | ||
| 115749.7663406 | 115749.80663344.1 | GSC 0416000286 | M | 2004 Dec 03 | M4 | ||
| 142049.4604930 | 142049.51604934.9 | RX J1420.86049cc… by Zickgraf et al. (2003). | M | 2004 Apr 30 | M3 | ||
| 144243.9003955 | 144244.40003955.4 | BD00 2862dd… by Metanomski et al. (1998). | G5V+K1V | 2005 Mar 01 | G2 | ||
| 152346.8004434 | 152346.11004424.8 | TYC ee… by Fischer et al. (1998). | Ke | 2005 Mar 30 | K1e | ||
| 153826.3523407 | 153826.38523418.2ffOne of two possible counterparts to this source (see Table 3). This star was not included in the flux ration calculations discussed in § 4.1.1. | HD 234250 | K2 | 2005 Apr 26 | K3 | ||
| 153912.0554357 | 153912.04554355.2 | HD 238488 | F8 | 2005 Apr 26 | F8 | ||
| 165110.5355500 | 165109.95355507.2 | NLTT 43695 | M4 | 2005 May 31 | M5 | ||
| 165445.3423237 | 165445.04423227.5 | RX J1654.74232cc… by Zickgraf et al. (2003). | M | 2005 May 31 | M3 | ||
| 170352.9321147 | 170352.87321146.2 | TYC aaX-ray source identified by Schwope et al. (2000). | M2.5 | 2005 Jul 19 | M3 | ||
| 172142.4620036 | 172142.60620032.8 | RX J1721.76200gg… by Gioia et al. (2003). | K4 | 2005 Sep 14 | K2 | ||
| 172439.2644054 | 172438.98644052.5 | TYC gg… by Gioia et al. (2003). | G0 | 2005 Jul 20 | G7 | ||
| 230240.3003453 | 230241.41003450.2 | [ZEH2003] RX J2302.60034 3cc… by Zickgraf et al. (2003). | K | 2005 Nov 09 | K7e | ||
| 074553.1355818 | 074555.71355836.0 | HD 62547 | K0 | 2005 Jan 05 | G7 | ||
| 081546.8460123 | 081548.99460119.5 | [ZEH2003] RX J0815.74601 1cc… by Zickgraf et al. (2003). | F/G | 2005 Jan 29 | M2 | ||
| 091609.6015320 | 091610.17015308.8 | [ZEH2003] RX J0916.10153 3cc… by Zickgraf et al. (2003). | K | 2005 Jan 29 | M4 | ||
| 092023.1021351 | 092023.40021340.5 | [ZEH2003] RX J0920.30213 1cc… by Zickgraf et al. (2003). | F/G | 2005 Jan 29 | K7e | ||
| 101716.7051145 | 101716.76051149.8 | [ZEH2003] RX J1017.20511 2cc… by Zickgraf et al. (2003). | F/G | 2005 Jan 29 | G5 | ||
| 102547.0033143 | 102545.64033141.0 | [ZEH2003] RX J1025.70331 2cc… by Zickgraf et al. (2003). | F/G | 2004 Mar 28 | G2 | ||
| 105706.3010109 | 105707.70010115.5 | RX J1057.10101b,hb,hfootnotemark: | K4V | 2004 Dec 03 | G5 | ||
| 110046.1052307 | 110046.08052304.6 | [ZEH2003] RX J1100.70523 1cc… by Zickgraf et al. (2003). | K | 2004 Mar 28 | M3 | ||
| 110804.1052216 | 110803.94052214.3 | RX J1108.00522cc… by Zickgraf et al. (2003). | F/G | 2004 Mar 28 | M0 | ||
| 143139.0004732 | 143138.92004731.4 | RX J1431.60047cc… by Zickgraf et al. (2003). | K | 2005 Mar 01 | M0 | ||
| 153709.0531928 | 153709.43531920.3 | StKM 11262 | K5 | 2005 Feb 26 | M0 | ||
| 160602.0501124 | 160602.24501113.0 | V V842 Her | F9V | 2005 Apr 26 | G2 | ||
| 161022.6450934 | 161022.24450934.9 | RX J1610.34509cc… by Zickgraf et al. (2003). | K | 2004 May 22 | M0 | ||
| 171928.8652227 | 171928.68652229.7 | RX J1719.46522gg… by Gioia et al. (2003). | K0 | 2005 May 31 | G7 |
Note. — The first offset is between the RASS and SDSS positions; the second is between the SDSS and SIMBAD positions. Stars above the line are those for which choosing the APO or the SIMBAD spectral class does not impact calculations.
In addition, we identified two candidate A star counterparts to RASS sources in our APO spectroscopic campaign. In both cases, however, the A star seems unlikely to be the RASS source. TYC , listed in SIMBAD without a spectral type, appears to be in front of a cluster of galaxies that includes 2MASX J, identified as the RASS source RXS J.
The SDSS spectrum of SDSS J095220.07531455.6, ′′ away from RXS J, is that of a z QSO. While the candidate stellar counterpart is closer (′′), the RASS hardness ratios (HR1 ; HR2 ) are consistent with those commonly found for AGN (e.g., Voges et al., 1999), and it therefore seems most likely that the QSO is in fact the RASS source.
Comparison of SIMBAD and APO stellar classifications
In Table 8 we list all the SIMBAD-cataloged candidate RASS counterparts with a spectral type for which we obtained an APO spectrum. For stars the spectral type derived from our spectrum either does not differ significantly from the SIMBAD type or is within the same spectral class. In these cases choosing one type or the other has no impact on the flux ratio calculations, since e.g., all F stars are binned together. In of the cases where subtypes are available in SIMBAD, the DIS-derived and SIMBAD spectral classes agree to within two subtypes. (The DIS spectra allow us to assign a subtype to seven other stars for which none was available.)
For another stars, the choice of stellar type does impact the flux ratio calculations. In nine cases the star’s type was derived by Zickgraf et al. (2003) from low-resolution spectra; we consider our types, obtained from higher resolution spectra, to be more reliable. In the five other cases, a stellar subtype is listed in SIMBAD; our DIS-derived spectral type agrees to within three subtypes in four cases–only slightly worse than what we consider our typical uncertainty when typing with the Hammer. The fourth case is that of the counterpart to 1RXS J105706.3010109, identified by Appenzeller et al. (1998) as the K4V star RX J1057.10101. Our APO target was a star offset by from this one, explaining the discrepancy in spectral types.
of these stars are previously identified X-ray sources; three additional stars are listed in SIMBAD as RASS counterparts, but the origin of these associations is unclear.
SDSS WD/RASS Identifications
Building the sample of X-ray emitting DAs
Table 5 lists our most confident SDSS DA/RASS associations. We discuss how we obtained these and our less certain identifications. Ten of these less certain cases are also listed in Table 5; follow-up optical and/or X-ray observations are required to confirm these identifications.
DAs discovered before SDSS
In correlating the Eisenstein et al. (2006) catalog with the RASS, we identified DAs listed in the McCook & Sion (1999) catalog with an X-ray source within . We classified seven of these sources as unlikely X-ray emitting WDs. In four cases, a known QSO is in the RASS error circle and the X-ray source is not super-soft, which is consistent with the QSOs being the X-ray sources.
In three ambiguous cases, the sources are not super-soft and at large separations from the RASS source, but the available SDSS data do not rule out the DAs as X-ray sources. SDSS J022618.60083049.3 is in a RASS error circle with two bright stars ( and ). The RASS source is not super-soft (HR1 ) and it is therefore unlikely that the WD is the X-ray source. SDSS J093456.44023121.1 is in a error circle with no obvious X-ray source counterparts. There is a very faint, red star closer to the RASS position (), but were it the X-ray counterpart, its log would be much higher than typical for stars. The RASS source is not soft (HR1 ), so perhaps this is a QSO with stellar colors. Finally, SDSS J152349.89041434.6 is in a error circle with SDSS J152349.88041400.8, a galaxy. In these cases follow-up spectroscopy is needed to reveal, for example, whether this galaxy hosts an AGN. We consider these three WDs to be less certain RASS counterparts and list them as such in Table 5.
Of the remaining previously known DAs, we include in Table 5 the four that have not been identified as X-ray emitters (i.e., they are not in the Fleming et al. (1996), Zickgraf et al. (2003), or Chu et al. (2004) catalogs) as new identifications.
SDSS DR4-discovered DAs
Our SDSS/RASS correlations yielded a further SDSS-discovered DA WDs (i.e., not listed in the McCook & Sion (1999) catalog) with an X-ray source within . Five of these sources also have nearby cataloged QSOs and are not super-soft. In three other cases we identify plausible non-WD counterparts to the RASS sources. A UV-excess source with is positionally coincident with the RASS source for which SDSS J083300.12272254.5 is proposed as a counterpart. Similarly, another UV-excess source (with ) is closer than SDSS J094437.72493815.3 to the RASS source for which the WD is the candidate counterpart. Finally, for SDSS J162814.59363008.3 a very faint UV-excess object (, ) is positionally coincident with a FIRST radio source. In all three cases the RASS sources are not super-soft, and it seems likely that the UV-excess objects are QSOs and X-ray sources. Follow-up spectroscopy is required to confirm this, but we consider these DAs to be unlikely RASS-source counterparts.
Of the remaining DAs, there are seven cases in which inspection of the RASS error circle, combined with the RASS source hardness ratio, suggests that the WD is probably not the X-ray source–but does not provide a strong alternate X-ray counterpart candidate. In all these error circles spectroscopy of multiple objects or high spatial resolution X-ray observations are needed. We consider these seven WDs to be less certain RASS counterparts and list them as such in Table 5.
The remaining SDSS DR4 DAs are listed in Table 5 as new identifications.
Building the sample of X-ray emitting non-DAs
Our SDSS/RASS correlations also returned non-DA WDs. Once again we eliminate those WDs in error circles with cataloged QSOs; there are three such error circles here, all with RASS sources that are not super-soft. For two other RASS sources the SDSS data suggest other counterparts. SDSS J123337.71+570335.4 is a z redshift QSO nearer to the RASS source (HR1 ) than SDSS J123345.52570343.9, a DB WD. The UV-excess object SDSS J155209.12433821.8 () is also closer to the RASS source (HR1 ) than SDSS J155205.59433825.8, one of the DA+M-star binaries. While spectroscopic confirmation is needed in the latter case, we conclude that both of these RASS sources are QSOs.
The six remaining WDs are the likely RASS sources listed in Table 6. In addition to the two DBs discussed in § 6.2.3, these objects include the previously known PG 1159 star SDSS J114635.23001233.5. The spectrum for this (very hot) star is poorly fit by our models, and the value for Teff in Table 6 should therefore not be trusted. The five other stars are DA+M-star systems, of which one is an SDSS discovery, SDSS J223051.15125706.8 (Silvestri et al., 2006). For the three systems included in the Silvestri et al. (2006) DR4 catalog of close binary systems, we give the published Teff and note the M stars’ spectral types. For the two other systems, SDSS J132725.72505711.0 (WD 1325512) and J141740.22130148.5 (WD 1415132), we fit the spectra to obtain Teff (listed in Table 6) and log g ( and , respectively). The fit to the spectrum of SDSS J1327 is poor; the spectrum has relatively low signal-to-noise, and the presence of the M dwarf appears to have corrupted the fit to the H line.
Building a sample of X-ray emitting WDs identified since DR4
Since the production of the Eisenstein et al. (2006) WD catalog, new WDs have been identified through inspection of the more recent SDSS spectroscopy. We have also collected a few objects whose spectra were taken earlier in the survey but that were not included in the Kleinman et al. (2004) DR1 or Eisenstein et al. (2006) samples; we refer to all of these objects as post-DR4.
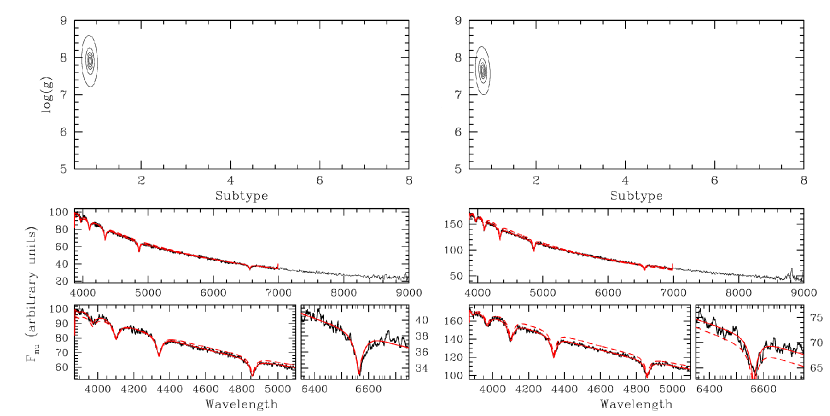
Among the RASS sources with new candidate WDs within , we selected the super-soft sources (HR1 ). Ten sources met this criterion. Two are known DA WDs, WD 1325512 and WD 1415132 (McCook & Sion, 1999), and known X-ray emitters222222WD 1415132 is included in Fleming et al. (1996); WD 1325512 is listed in SIMBAD as a known X-ray source, but is not included in Fleming et al. (1996) or Zickgraf et al. (2003). It is unclear how it was identified as a RASS source.. The SDSS spectra indicate that both have M-star companions, and we include these WDs in Table 6.
In two other cases, the SDSS data indicate that another object may be the RASS counterpart. For SDSS J114142.84143356.5, a star is nearer to the position of the RASS source (1RXS J14145.3143349). This star, were it to be the X-ray source counterpart, would have log , which is high for a main sequence stellar X-ray emitter. On the other hand, this is the least soft of the RASS sources (HR1 ). For SDSS J155109.55454252.2, a UV-excess object (, ) is virtually coincident with the RASS source (1RXS J155108.6454312). Since the RASS source is super-soft, this UV-excess object may be a WD or a CV; the latter are also frequently super-soft emitters.
In the remaining six cases the association of RASS source and SDSS candidate WD is very strong. Fitting the SDSS spectra using WD models then reveals that three of these candidate WDs are in fact hot stars: SDSS J125338.50051542.1, J133024.24001636.8, and J161614.02080905.8.
The other three stars are new DA WDs and included in Table 5: SDSS J093921.83264401.1, J100543.92304744.9, and J143736.67362213.4. Because of calibration problems with the SDSS data, the fitting failed to return values for Teff and log g for the spectrum of SDSS J143736.67362213.4 (the spectrum is also truncated at Å). The fits for the two other DAs are shown in Figure 15.
References
- Abazajian et al. (2003) Abazajian, K., et al. 2003, AJ, 126, 2081
- Adelman–McCarthy et al. (2006) Adelman–McCarthy, J. K., et al. 2006, ApJS, 162, 38
- Adelman-McCarthy et al. (2008) Adelman-McCarthy, J. K. et al. 2008, ApJS, 175, 297
- Agüeros (2006) Agüeros, M. A. 2006, PhD thesis, Univ. Washington, Washington
- Agüeros et al. (2006) Agüeros, M. A., et al. 2006, AJ, 131, 1740
- Anderson et al. (2003) Anderson, S. F., et al. 2003, AJ, 126, 2209
- Anderson et al. (2007) —. 2007, AJ, 133, 313
- Antiochos et al. (1986) Antiochos, S. K., et al. 1986, ApJ, 307, L55
- Appenzeller et al. (1998) Appenzeller, I. et al. 1998, ApJS, 117, 319
- Ayres et al. (1981) Ayres, T. R., et al. 1981, ApJ, 250, 293
- Bade et al. (1998) Bade, N., et al. 1998, A&AS, 127, 145
- Baldwin et al. (1981) Baldwin, J. A., Phillips, M. M., & Terlevich, R. 1981, PASP, 93, 5
- Barstow (1989) Barstow, M. A. 1989, LNP Vol. 328: IAU Colloq. 114: White Dwarfs, 328, 156
- Bauer et al. (2000) Bauer, F. E., et al. 2000, ApJS, 129, 547
- Becker et al. (1995) Becker, R. H., et al. 1995, ApJ, 450, 559
- Bowyer et al. (1996) Bowyer, S., Lampton, M., Lewis, J., Wu, X., Jelinsky, P., & Malina, R. F. 1996, ApJS, 102, 129
- Cassinelli & Swank (1983) Cassinelli, J. P., & Swank, J. H. 1983, ApJ, 271, 681
- Chu et al. (2004) Chu, Y.-H., et al. 2004, AJ, 127, 477
- Cohen et al. (2003) Cohen, M., Wheaton, W. A., & Megeath, S. T. 2003, AJ, 126, 1090
- Comastri et al. (2002) Comastri, A. et al. 2002, ApJ, 571, 771
- Condon et al. (1998) Condon, J. J., et al. 1998, AJ, 115, 1693
- Covey et al. (2008) Covey, K. R. et al. 2008, ApJS, 178, 339
- Covey et al. (2007) —. 2007, AJ, 134, 2398
- Cutri et al. (2003) Cutri, R. M., et al. 2003, 2MASS All Sky Catalog of point sources. (The IRSA 2MASS All-Sky Point Source Catalog, NASA/IPAC Infrared Science Archive. http://irsa.ipac.caltech.edu/applications/Gator/)
- Daniel et al. (2002) Daniel, K. J., et al. 2002, ApJ, 578, 486
- Dempsey et al. (1993) Dempsey, R. C., Linsky, J. L., Fleming, T. A., & Schmitt, J. H. M. M. 1993, ApJS, 86, 599
- Drake et al. (1992) Drake, S. A., Simon, T., & Linsky, J. L. 1992, ApJS, 82, 311
- Eisenstein et al. (2006) Eisenstein, D. J., et al. 2006, ApJS, 167, 40
- Farihi et al. (2006) Farihi, J., Hoard, D. W., & Wachter, S. 2006, ApJ, 646, 480
- Favata et al. (1995) Favata, F., Barbera, M., Micela, G., & Sciortino, S. 1995, A&A, 295, 147
- Feigelson et al. (2004) Feigelson, E. D., et al. 2004, ApJ, 611, 1107
- Finlator et al. (2000) Finlator, K., et al. 2000, AJ, 120, 2615
- Fischer et al. (1998) Fischer, J.-U., Hasinger, G., Schwope, A. D., Brunner, H., Boller, T., Trümper, J., Voges, W., & Neizvestnyj, S. 1998, Astronomische Nachrichten, 319, 347
- Fleming (1998) Fleming, T. A. 1998, ApJ, 504, 461
- Fleming et al. (1989a) Fleming, T. A., Gioia, I. M., & Maccacaro, T. 1989a, ApJ, 340, 1011
- Fleming et al. (1989b) —. 1989b, AJ, 98, 692
- Fleming et al. (1996) Fleming, T. A., et al. 1996, A&A, 316, 147
- Flesch & Hardcastle (2004) Flesch, E., & Hardcastle, M. J. 2004, A&A, 427, 387
- Fukugita et al. (1996) Fukugita, M., et al. 1996, AJ, 111, 1748
- Gioia et al. (1984) Gioia, I. M., et al. 1984, ApJ, 283, 495
- Gioia et al. (1990) —. 1990, ApJS, 72, 567
- Gioia et al. (2003) —. 2003, ApJS, 149, 29
- Giommi et al. (1991) Giommi, P. et al. 1991, ApJ, 378, 77
- Güdel (2004) Güdel, M. 2004, A&A Rev., 12, 71
- Gunn et al. (1998) Gunn, J. E., et al. 1998, AJ, 116, 3040
- Gunn et al. (2006) —. 2006, AJ, 131, 2332
- Hagen et al. (1995) Hagen, H.-J., et al. 1995, A&AS, 111, 195
- Haisch & Schmitt (1994) Haisch, B., & Schmitt, J. H. M. M. 1994, ApJ, 426, 716
- Haisch et al. (1991) Haisch, B., et al. 1991, ApJ, 383, L15
- Harnden et al. (1979) Harnden, F. R., et al. 1979, ApJ, 234, L51
- Hawley & Pettersen (1991) Hawley, S. L., & Pettersen, B. R. 1991, ApJ, 378, 725
- Hempelmann et al. (1996) Hempelmann, A., Schmitt, J. H. M. M., & Stȩpień, K. 1996, A&A, 305, 284
- Høg et al. (1998) Høg, E., et al. 1998, A&A, 335, L65
- Hogg et al. (2001) Hogg, D. W., et al. 2001, AJ, 122, 2129
- Homer et al. (2006) Homer, L., et al. 2006, AJ, 132, 2743
- Hünsch et al. (1999) Hünsch, M., Schmitt, J. H. M. M., Sterzik, M. F., & Voges, W. 1999, A&AS, 135, 319
- Hünsch et al. (1998a) Hünsch, M., Schmitt, J. H. M. M., & Voges, W. 1998a, A&AS, 127, 251
- Hünsch et al. (1998b) Hünsch, M., et al. 1998b, A&AS, 132, 155
- Hussain et al. (2007) Hussain, G. A. J., et al. 2007, MNRAS, 377, 1488
- Ivezić et al. (2004) Ivezić, Ž., et al. 2004, Astronomische Nachrichten, 325, 583
- Kleinman et al. (2004) Kleinman, S. J., et al. 2004, ApJ, 607, 426
- Kraus & Hillenbrand (2007) Kraus, A. L., & Hillenbrand, L. A. 2007, AJ, 134, 2340
- Krautter et al. (1999) Krautter, J., et al. 1999, A&A, 350, 743
- López-Corredoira et al. (2008) López-Corredoira, M., Gutiérrez, C. M., Mohan, V., Gunthardt, G. I., & Alonso, M. S. 2008, A&A, 480, 61
- Maccacaro et al. (1988) Maccacaro, T., et al. 1988, ApJ, 326, 680
- Marsh et al. (1997) Marsh, M. C., et al. 1997, MNRAS, 286, 369
- McCook & Sion (1999) McCook, G. P., & Sion, E. M. 1999, ApJS, 121, 1
- McGlynn et al. (2004) McGlynn, T. A. et al. 2004, ApJ, 616, 1284
- Metanomski et al. (1998) Metanomski, A. D. F., Pasquini, L., Krautter, J., Cutispoto, G., & Fleming, T. A. 1998, A&AS, 131, 197
- Mickaelian et al. (2006) Mickaelian, A. M., et al. 2006, A&A, 449, 425
- Monet et al. (1998) Monet, D., et al. 1998, VizieR Online Data Catalog, 1252, 0
- Motch et al. (1998) Motch, C., et al. 1998, A&AS, 132, 341
- Nieto–Santisteban et al. (2004) Nieto–Santisteban, M. A., et al. 2004, in ASP Conf. Ser. 314: Astronomical Data Analysis Software and Systems (ADASS) XIII, ed. F. Ochsenbein, M. G. Allen, & D. Egret, 666–+
- O’Dwyer et al. (2003) O’Dwyer, I. J., et al. 2003, AJ, 125, 2239
- Osten et al. (2005) Osten, R. A., et al. 2005, ApJ, 621, 398
- Parejko et al. (2008) Parejko, J. K., Constantin, A., Vogeley, M. S., & Hoyle, F. 2008, AJ, 135, 10
- Patterson & Raymond (1985) Patterson, J., & Raymond, J. C. 1985, ApJ, 292, 535
- Pier et al. (2003) Pier, J. R., et al. 2003, AJ, 125, 1559
- Plotkin et al. (2008) Plotkin, R. M., Anderson, S. F., Hall, P. B., Margon, B., Voges, W., Schneider, D. P., Stinson, G., & York, D. G. 2008, AJ, 135, 2453
- Reid & Hawley (2005) Reid, I. N., & Hawley, S. L. 2005, New Light on Dark Stars: Red Dwarfs, Low-Mass Stars, Brown Stars, Springer–Praxis Books in Astrophysics and Astronomy, ed. I. N. Reid & S. L. Hawley (Chichester: Praxis Publishing Ltd)
- Richards et al. (2002) Richards, G. T., et al. 2002, AJ, 123, 2945
- Richman (1996) Richman, H. R. 1996, ApJ, 462, 404
- Rogel et al. (2006) Rogel, A. B., et al. 2006, ApJS, 163, 160
- Rutledge et al. (2000) Rutledge, R. E., et al. 2000, ApJS, 131, 335
- Schmidt et al. (2005a) Schmidt, G. D., et al. 2005a, ApJ, 630, 1037
- Schmidt et al. (2005b) —. 2005b, ApJ, 620, 422
- Schmitt & Liefke (2004) Schmitt, J. H. M. M., & Liefke, C. 2004, VizieR Online Data Catalog, 341, 70651
- Schmitt et al. (1995) Schmitt, J. H. M. M., et al. 1995, ApJ, 450, 392
- Schreier et al. (1972) Schreier, E., et al. 1972, ApJ, 172, L79+
- Schröder & Schmitt (2007) Schröder, C., & Schmitt, J. H. M. M. 2007, A&A, 475, 677
- Schwope et al. (2000) Schwope, A., et al. 2000, Astronomische Nachrichten, 321, 1
- Scranton et al. (2002) Scranton, R. et al. 2002, ApJ, 579, 48
- Shaw et al. (1996) Shaw, J. S., Caillault, J.-P., & Schmitt, J. H. M. M. 1996, ApJ, 461, 951
- Shipman (1976) Shipman, H. L. 1976, ApJ, 206, L67
- Silvestri et al. (2006) Silvestri, N. M., et al. 2006, AJ, 131, 1674
- Simon et al. (1995) Simon, T., Drake, S. A., & Kim, P. D. 1995, PASP, 107, 1034
- Sion et al. (1983) Sion, E. M., et al. 1983, ApJ, 269, 253
- Skrutskie et al. (2006) Skrutskie, M. F., et al. 2006, AJ, 131, 1163
- Smith et al. (2002) Smith, J. A., et al. 2002, AJ, 123, 2121
- Smith et al. (2005) Smith, K., et al. 2005, A&A, 436, 241
- Stephenson (1986) Stephenson, C. B. 1986, AJ, 91, 144
- Stocke et al. (1983) Stocke, J. T., et al. 1983, ApJ, 273, 458
- Stocke et al. (1991) —. 1991, ApJS, 76, 813
- Stoughton et al. (2002) Stoughton, C., et al. 2002, AJ, 123, 485
- Szkody et al. (2002) Szkody, P., et al. 2002, AJ, 123, 430
- Szkody et al. (2003) —. 2003, AJ, 126, 1499
- Szkody et al. (2004a) —. 2004a, AJ, 128, 1882
- Szkody et al. (2004b) —. 2004b, AJ, 128, 2443
- Szkody et al. (2005) —. 2005, AJ, 129, 2386
- Szkody et al. (2006) —. 2006, AJ, 131, 973
- Szkody et al. (2007) —. 2007, AJ, 134, 185
- Tananbaum et al. (1972) Tananbaum, H., et al. 1972, ApJ, 174, L143+
- Topka et al. (1982) Topka, K., Golub, L., Gorenstein, P., Harnden, Jr., F. R., Vaiana, G. S., Avni, Y., & Rosner, R. 1982, ApJ, 259, 677
- Tucker et al. (2006) Tucker, D. L., et al. 2006, Astronomische Nachrichten, 327, 821
- Voges et al. (1999) Voges, W., et al. 1999, A&A, 349, 389
- Voges et al. (2000) —. 2000, VizieR Online Data Catalog, 9029, 0
- Wachter et al. (2003) Wachter, S., et al. 2003, ApJ, 586, 1356
- Walter et al. (1980) Walter, F. M., Cash, W., Charles, P. A., & Bowyer, C. S. 1980, ApJ, 236, 212
- Woudt et al. (2004) Woudt, P. A., et al. 2004, MNRAS, 351, 1015
- York et al. (2000) York, D. G., et al. 2000, AJ, 120, 1579
- Zickgraf et al. (2005) Zickgraf, F.-J., Krautter, J., Reffert, S., Alcalá, J. M., Mujica, R., Covino, E., & Sterzik, M. F. 2005, A&A, 433, 151
- Zickgraf et al. (1997) Zickgraf, F.-J., et al. 1997, A&AS, 123, 103
- Zickgraf et al. (2003) —. 2003, A&A, 406, 535