The low level of debris disk activity at the time of the Late Heavy Bombardment: a Spitzer study of Praesepe
Abstract
We present 24 photometry of the intermediate-age open cluster Praesepe. We assemble a catalog of 193 probable cluster members that are detected in optical databases, the Two Micron All Sky Survey (2MASS), and at 24 , within an area of square degrees. Mid-IR excesses indicating debris disks are found for one early-type and for three solar-type stars. Corrections for sampling statistics yield a 24 excess fraction (debris disk fraction) of % for luminous and % for solar-type stars. The incidence of excesses is in agreement with the decay trend of debris disks as a function of age observed for other cluster and field stars. The values also agree with those for older stars, indicating that debris generation in the zones that emit at 24 falls to the older 1-10 Gyr field star sample value by roughly 750 Myr.
We discuss our results in the context of previous observations of excess fractions for early- and solar-type stars. We show that solar-type stars lose their debris disk 24 excesses on a shorter timescale than early-type stars. Simplistic Monte Carlo models suggest that, during the first Gyr of their evolution, up to 15-30% of solar-type stars might undergo an orbital realignment of giant planets such as the one thought to have led to the Late Heavy Bombardment, if the length of the bombardment episode is similar to the one thought to have happened in our Solar System.
In the Appendix, we determine the cluster’s parameters via boostrap Monte Carlo isochrone fitting, yielding an age of 757 Myr ( 36 Myr at 1 confidence) and a distance of 179 pc ( 2 pc at 1 confidence), not allowing for systematic errors.
Subject headings:
infrared: stars – open clusters and associations: individual (Praesepe, M44, NGC 2632, Beehive) – stars: evolution – stars: circumstellar matter – planetary systems: formation1. Introduction
Stars generally form with an accompanying circumstellar disk. Planets can grow from this primordial disk over a few to a few tens of Myr. The Infrared Astronomy Satellite (IRAS) detected infrared excess emission from disks around stars with ages much older than the clearing timescales of protoplanetary circumstellar disks (Aumann et al., 1984). These excesses arise from second-generation ”debris disks” that are the results of collisional cascades initiated by impacts between planetesimals and of cometary activity (Backman & Paresce, 1993). The micron-sized dust grains in debris disks are heated by the central star(s) and reradiate the received energy at mid-infrared wavelengths. Studying this infrared emission lets us probe the frequency of formation of planetary systems and to track their evolution. For example, some of the relatively prominent disks may be analogs to that in the Solar System at the epoch of Late Heavy Bombardment (LHB; e.g. Gomes et al., 2005; Strom et al., 2005).
IRAS and Infrared Space Observatory (ISO) observations of debris disks suggest that the excess rate steadily declines with stellar age, indicative of stars losing these disks within a few hundred million years (Habing et al., 2001; Spangler et al., 2001). A theoretical model that involved delayed stirring was developed by Dominik & Decin (2003) to explain this phenomenon; however, a uniform evolutionary model could not be derived. There were a number of reasons. The sensitivity of these instruments was often inadequate for observations down to the photospheric levels. The large beam sizes also occasionally confused the excesses with background objects and/or the galactic cirrus. The Multiband Imaging Photometer for Spitzer (MIPS; Rieke et al., 2004) on the Spitzer Space Telescope has improved sensitivity and resolution in the mid-infrared and with it astronomers have been able to carry out more detailed statistical studies of debris disks at a wide range of stellar ages and spectral types.
Rieke et al. (2005) observed a large sample of nearby A-type field stars with Spitzer, which combined with existing IRAS and ISO data definitively demonstrated that the frequency of debris disk excesses declines with age and that the disk properties vary at all ages. Even by probing excesses down to 25% above the photospheric level, Rieke et al. (2005) found that some stars at ages of only 10-20 Myr do not show any signs of excess. These results were confirmed by Su et al. (2006). This behavior implies a very fast clearing mechanism for disks around some of these stars, or perhaps that they form with only very low mass disks. The models of Wyatt et al. (2007) provided a first-order explanation in terms of a steady state evolution of the debris disks from a broad distribution of initial masses.
An important question for habitable planet search/evolution is whether the same processes occur for FGK-type stars. A number of surveys of solar-type stars have been conducted with Spitzer. The MIPS Guaranteed Time Observers (GTO) team has searched field stars for excesses (Trilling et al., 2008), plus many hundreds of open cluster members (e.g., Gorlova et al., 2006, 2007; Siegler et al., 2007). The legacy survey by the Formation and Evolution of Planetary Systems (FEPS) group has examined 328 stars (both field and open cluster members)(Mamajek et al., 2004; Meyer et al., 2004, 2008; Stauffer et al., 2005; Kim et al., 2005; Silverstone et al., 2006).
Trilling et al. (2008) showed that solar-type stars of age older than 1 Gyr have excess emission at 70 % of the time. Excesses at this wavelength are expected to arise from Kuiper-Belt-like planetesimal regions, but with masses 10-100 times greater. Meyer et al. (2008) find that 8.5-19% of solar-type stars at ages Myr have debris disks detectable at 24 and that this number gradually goes down to % at older ages, augmenting work by Gorlova et al. (2006), Siegler et al. (2007) and Trilling et al. (2008). Excesses at this wavelength around solar-type stars probe the 1-40 AU range, the asteroidal and planetary region in the Solar System.
The ideal laboratories to determine the stellar disk fractions with good number statistics are open clusters and associations. To investigate the fraction of solar-type excess stars, the observations have to be able to detect the photospheres of the non-excess stars. The range of distances to suitable clusters compromises the uniformity of the results. The survey of h and Persei (Currie et al., 2008) could only determine the early-type star excess fraction, while that of NGC 2547 (Young et al., 2004; Gorlova et al., 2007) could only detect photospheres down to early G due to similar limits. The observations in M47 (Gorlova et al., 2004) also yielded values to early G spectral type stars. The investigations of IC 2391 (Siegler et al., 2007) and the Pleiades (Gorlova et al., 2006) gave insights on debris disk evolution down as far as K spectral-type stars.
To study further the fraction of debris disks around solar-mass stars, we have observed the nearby Praesepe (M44, NGC 2632, Beehive) open cluster. Our observations, along with those of Cieza et al. (2008) on the Hyades cluster, fill the gap in previous work on debris disk fractions in the age range of 600-800 Myr. This range is of interest because it coincides with the LHB in the Solar System. The close proximity of the cluster ( 180 pc) and its large number of members ensured that good statistics would be achieved. Praesepe has been extensively studied by many groups (Klein Wassink, 1927; Jones & Cudworth, 1983; Jones & Stauffer, 1991; Hambly et al., 1995; Wang et al., 1995; Kraus & Hillenbrand, 2007), providing a nearly full membership list to our completeness limit of mag (the brightness of a G4 V spectral-type star at the distance of the cluster). The member stars have high proper motions ( mas yr-1), clearly distinguishing them from field stars.
2. Observations, data reduction, and photometry
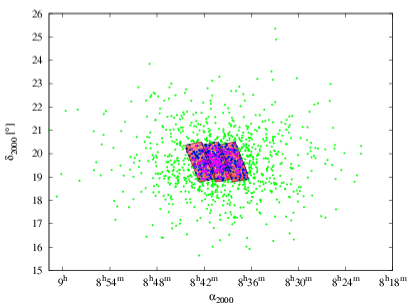
We used MIPS to observe Praesepe as part of the GTO program PID 30429 (2007 May 30). The center part of the cluster (8h40m21s, 19∘) was imaged using three scan maps (with 12 legs in a single scan map overlapping with half-array cross-scan). The map covers a field of , as shown in Figure 1. We used medium scan mode, resulting in a total effective exposure time per pixel of 80 s (at 24 ). All data were processed using the MIPS instrument team Data Analysis Tool (DAT, Gordon et al., 2005) as described by Engelbracht et al. (2007).

Although MIPS in scan-mode provides simultaneous data from all three detectors (at 24, 70 and 160 ), we base our study on the 24 channel data only. The 70 and 160 detectors are insensitive to stellar photospheric emissions at the distance of Praesepe. In retrospect, the rarity of excesses in our survey is consistent with the lack of detections at the longer wavelengths.
The initial coordinate list for the 24 photometry was assembled with the daofind task under IRAF111IRAF is distributed by the National Optical Astronomy Observatories, which is operated by the Association of the Universities for Research in Astronomy, Inc. (AURA) under cooperative agreement with the National Science Foundation.. We later expanded this list by visually examining the images and manually adding all sources to the list that were missed by daofind. Our final list for photometry contained 1457 sources. To achieve high accuracy, we performed point-spread function (PSF)–fitting photometry. The calibration star HD 173398 was adopted as a PSF standard, with the final PSF constructed from 72 individual observations, kindly provided to us by C. Engelbracht. The standard IRAF tasks phot and allstar of the daophot package were used.


The observed field is free of nebulosity and stellar crowding, so we were able to use a large PSF radius of , with fitting radius of . The large PSF radius ensured us that the aperture correction was negligible. The instrumental number counts were converted to flux densities with the conversion (Engelbracht et al., 2007). We then translated these values to 24 magnitudes taking 7.17 Jy for the [24] magnitude zero point, which has error of 0.11 Jy (Rieke et al., 2008). We show the photometric error vs. brightness plots of our measurements in Figure 2. Almost all sources brighter than 9th magnitude ( 1.8 mJy) have errors less than 0.04 mag ( 0.07 mJy) and all sources remain below errors of 0.1 mag; the average error is %. As a check, we performed independent PSF photometry with StarFinder under IDL, obtaining photometry values within the errors of our IRAF photometry and with errors similar to the ones given by daophot.
3. Catalog surveys and the final sample
We compiled a complete catalog for all sources in our field of view, including their optical, near infrared, and 24 data. We expanded this catalog with all known cluster members outside of our field of view (naturally without [24] data). This enabled us to plot a full cluster optical color-magnitude diagram (CMD), which we used to confirm the cluster’s age and distance (see Appendix).
Optical data for the sources were obtained from the 5th data release of the Sloan Digital Sky Survey (SDSS), while 2MASS provided J, H, and KS magnitudes. The SDSS photometry is generally unreliable for bright sources, the ones mostly detected in our MIPS survey. To ensure we had good photometry for these sources, we collected BV data (for 356 stars altogether) using the Webda database222http://www.univie.ac.at/webda/, providing an ensemble of data for high probability cluster members from various papers (Johnson, 1952; Anthony-Twarog, 1982; Dickens et al., 1968; Lutz & Lutz, 1977; Upgren et al., 1979; Castelaz et al., 1991; Mermilliod et al., 1990; Weis, 1981; Stauffer, 1982; Andruk et al., 1995; Mendoza, 1967; Oja, 1985). The data downloaded from the Webda database cover the brightest magnitude range of the cluster, including stars avoided by modern CCD observations or where they are saturated. We converted the BV magnitudes to SDSS r and g values by averaging the conversion slopes of Jester et al. (2005); Jordi et al. (2006); Zhao & Newberg (2006) and Fukugita et al. (1996) and obtained
| (1) | |||||
| (2) | |||||
Where our calculated r or g brightnesses for the Webda catalog members differed from the SDSS data by more than 0.5 magnitude, we replaced the SDSS data with the calculated one.
Cluster membership was determined by compiling all accessible databases. The largest membership lists are those of Wang et al. (1995) and Kraus & Hillenbrand (2007), which were supplemented by our Webda catalog search results. Wang et al. (1995) give a list of 924 stars, out of which we chose only 198 that are high probability members of the cluster according to the proper motion data in the paper. The list of Kraus & Hillenbrand (2007) is much more robust with 1130 stars, all of which have membership probability %; 1010 of them have % membership probability. The databases (SDSS, 2MASS, Webda, Wang et al. (1995), Kraus & Hillenbrand (2007)) were cross-correlated with a maximum matching radius of . The closest member within this radius is matched as a pair and all others are added to the catalog as new sources. The program excluded pairing members from the same catalog. Our final cluster member list contains 1281 candidates, of which 493 were in our observed field.
After plotting the color-magnitude diagram and doing an initial isochrone fit on cluster members, we tested for bad photometry. We generated a list of all the member stars that were further from the isochrone sequence than 0.3 magnitude, examined all these stars for anomolies on SDSS images, and searched for BV magnitudes in Simbad. If the star was saturated or a calculated r, g magnitude differed from the SDSS r, g value by 0.5 magnitude or more (the same criteria as used before), we used the calculated value.
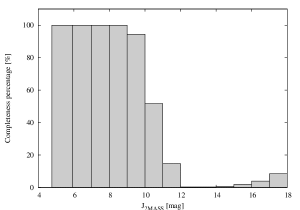

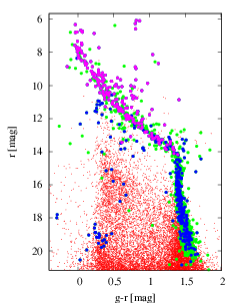
In Figure 3, we show how the selection criteria narrow the CMD, and where sources with different selection characteristics are distributed in the field. From the 1457 sources identified in our 24 survey, 201 were cataloged as cluster members by previous work. Of these, 193 also have data in the optical and near infrared. Our survey’s completeness limit compared to 2MASS is at (), as is shown in Figure 4. This limit corresponds to a G4 V star at the distance of Praesepe. The completeness limit for the cluster member sources is also shown in Figure 4. Between 10th and 11th magnitude in J we achieve 75% completeness for cluster members.
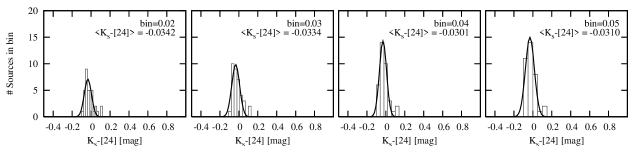
For our [24] magnitude values to be comparable to the 2MASS KS photometry, we fitted a Gaussian to the binned number distribution of the KS-[24] values of all member sources with r-K ( A stars). We derived a general correction factor of -0.0320.002 magnitude ( 3%) for the [24] values. The Gaussian fits are shown in Figure 5. This same method has been used by Rieke et al. (2008) to obtain the average ratio of KS to 24 flux densities. By optimizing the fit of our [24] data to the 2MASS KS data, we eliminated any absolute calibration offsets. The average variance of the fitted gaussians is mag, consistent with our average [24] error value of mag.
We summarize our [24] photometry results for the 193 cluster members that were identified in all wavelength regions in Table 1. The first column of the table gives our designated number, while the coordinates are that of the 24 flux source. As a source/coordinate comparison we also list the 2MASS source associated with the 24 emission. The table contains the KS adjusted [24] magnitude, the original flux values (in mJy) and the ”best” r and g photometry value. Cluster membership probability is shown by either the proper motion of the source or by the Wang et al. (1995) catalog number of the source. Sources that are missing both values were listed as cluster members either in the Webda database or in Kraus & Hillenbrand (2007).
4. Results
In this section we present our results on the debris disk fraction we observed in Praesepe and place it in context with previous results on the evolution of debris disks. There are two basic methods to detect 24 excess. The first is to use a color-color diagram, with one of the colors determining the stars’ spectral type and the other being KS-[24]. The r-KS color is ideal to differentiate spectral types, while the KS-[24] color depends only weakly on the spectral type of the star since both wavelengths fall on the Rayleigh-Jeans part of the spectral energy distribution (SED) for all sources hotter than early M type (T K) (Gautier et al., 2007). For non-excess stars the KS-[24] color should stay close to zero. Any excess measured in KS-[24] is most likely caused by circumstellar material.
The second method is to fit the observed optical and near-infrared photometry with theoretical SEDs based on stellar photosphere models. Excesses are revealed if the 24 flux density is significantly greater than the predicted flux.
4.1. Color-color selection
We used the color-color diagram shown in Figure 6 as our primary method to identify sources as excess candidates. We plot all cluster members that have magnitude values in r, KS, and [24], 193 sources altogether.
Gautier et al. (2007) show the trend of KS-[24] photospheric color with spectral type for stars of low effective temperature. The empirical locus of stars on the color-color plot in Figure 6 was derived by fitting a curve to a sample of field stars (from Gautier et al. (2007) and Trilling et al. (2008)). We then converted the fitted V-KS colors to r-KS colors through conversion tables in Cox (2000) and Kraus & Hillenbrand (2007). Our final color-color curve for r-KS vs. KS-[24] for main-sequence (MS) stars is:
| (3) | |||||
In Figure 6, we plot this curve and the 3 average confidence level for our photometry in [24] ( mag) (the errors of the curve itself are minor compared to the photometric errors). The majority of the stars (%) lie within this band. The errors plotted for the stars outside of our MS fitted curve are the 1 errors in our [24] photometry. To use the KS-[24] color as an excess diagnostic tool, one must make sure that the KS magnitude is truly photospheric. We examined the J, H, and KS fits to theoretical SEDs (Castelli & Kurucz, 2003) and concluded that all KS magnitudes are truly photospheric; the largest difference (from our debris disk candidate sample introduced later) is in the case of star 143, where the measured value is above the predicted SED value by 5.6%.

| [24] bin | N∗ | Flux | Excess | Ngalaxies | of at least chance alignments | ||||
|---|---|---|---|---|---|---|---|---|---|
| [mag] | [#] | [mJy] | [mJy] | [sr-1] | [0]$\ast$$\ast$The probability that none of the cluster member sources are chance aligned with a background galaxy in the appropriate magnitude range. | [1]$\dagger$$\dagger$The probability that at least 1, 2, 3 or 4 cluster member sources are chance aligned with a background galaxy in the appropriate magnitude range. | [2]$\dagger$$\dagger$The probability that at least 1, 2, 3 or 4 cluster member sources are chance aligned with a background galaxy in the appropriate magnitude range. | [3]$\dagger$$\dagger$The probability that at least 1, 2, 3 or 4 cluster member sources are chance aligned with a background galaxy in the appropriate magnitude range. | [4]$\dagger$$\dagger$The probability that at least 1, 2, 3 or 4 cluster member sources are chance aligned with a background galaxy in the appropriate magnitude range. |
| 4-5 | 4 | 125.900 | 16.245 | 2 | 99.99% | 0.01% | 0% | 0% | 0% |
| 5-6 | 2 | 50.122 | 6.467 | 7 | 99.98% | 0.02% | 0% | - | - |
| 6-7 | 11 | 19.954 | 2.575 | 4 | 99.54% | 0.46% | 0% | 0% | 0% |
| 7-8 | 26 | 7.944 | 1.025 | 1 | 97.46% | 2.54% | 0.04% | 0% | 0% |
| 8-9 | 48 | 3.162 | 0.408 | 7 | 72.35% | 27.65% | 3.80% | 0.01% | 0% |
| 9-10 | 53 | 1.259 | 0.162 | 4 | 12.60% | 87.40% | 60.26% | 31.93% | 13.14% |
| 10-11 | 48 | 0.501 | 0.065 | 8 | 2.47% | 97.53% | 87.34% | 69.30% | 47.06% |
| 11-12 | 1 | 0.199 | 0.026 | 1 | 91.20% | 8.80% | - | - | - |
As Figure 6 shows, we have 7 stars in the ”blue” region of the color-color plot, which we used to establish a selection rule to clean the excess region of the plot of possible spurious detections. We only accepted stars as true excess stars that: 1) lie at least 3 (their own and not the average [24] error) from the trend line; 2) have [24] data at least 3 from the best fitting SED solution also; and 3) are point sources on the images and have no noise anomalies. All stars in the ”blue” region failed these criteria. From the 19 stars that lie in the excess (”red”) region of the color-color diagram, fifteen were eliminated as debris disk candidates for the following reasons. Only 8 were 3 from the trend line: 181, 143, 100, 77, 134, 188, 24, and 2 (in the nomenclature of Table 1 and Figure 6). Star 188 turned out to be contaminated by a minor planet, which was identified by comparing scanlegs separately. Stars 24 and 2 are resolved doubles on the higher resolution 2MASS and SDSS images, so we excluded them from our list.
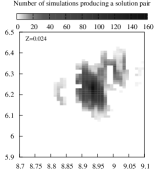
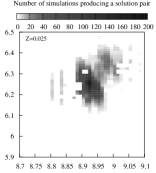
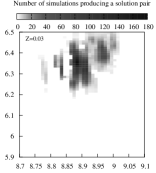
Star 100 is contaminated by a faint background galaxy, which was visible as a faint nebulosity next to the star. The probability for other sources of a 24 excess arising through a chance alignment with distant galaxies can be determined from galaxy counts (Papovich et al., 2004). Our mag [24] excess criterion results in different flux values identified as excesses as a function of source brightness. We estimated the probability of chance alignments by dividing our sample into 1 magnitude bins and running a Monte Carlo code with the number of sources in the bin and the number of extragalactic sources corresponding to 0.15 magnitude excess value for the specific bin. The matching radius for the chance alignment was chosen to be and the code was ran to 10000 simulations per magnitude bin. We summarize the simulation numbers with the probabilities of at least number of chance alignments in each bin in Table 2. The probability that star 143 with mag is a chance alignment with a background galaxy is very low (%), so it is very likely to be a true debris disk star. The probability that at least two sources (star 100 and 134) are contaminated by a background galaxy in the 8-9 magnitude bin is also very low (%), and since star 100 is already contaminated, we classify star 134 as a real debris disk star also. The likelihood that stars 77 and 181 are contaminated within is high (%). However, there is no indication of any positional offset between KS and [24], even at the level, so this likelihood is probably overestimated.
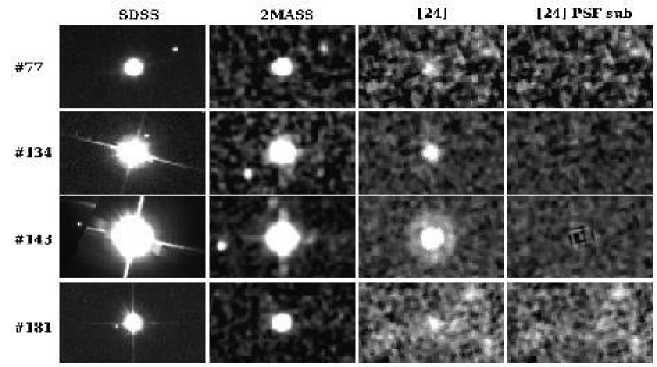
We determine stars 143 and 134 to be definite debris disk stars in Praesepe and list stars 77 and 181 as possible debris disk stars. We show these sources in Figure 7 and detail their properties in §4.4. Figure 7 shows that the fields are clean and that the sources are point-like. The PSFs were centered on the 24 sources with IRAF’s centroid algorithm. As Table 1 shows, the coordinate center of the excesses is closer than to the 2MASS coordinates for the debris disk candidates.
4.2. The SED fit selection
The 2MASS data are only useful in selecting debris disk candidates if the KS magnitude is photospheric. Since the threshold of the KS-[24] color above which a star is selected to be a debris disk candidate depends on the spectral type (the determination of which depends on correct r band photometry), we also fit the photometric data for all stars within the trend curves with model spectra to look for excess candidates. To be considered a debris disk candidate in this region required even stronger selection criteria then in the case of the ”excess region stars.” Stars were selected to be candidates from this region if their [24] photometry was at least 3 from the fitted SED and if the star was 3 (0.1 mag) from the trend line in the color-color plot. The 10% is an allowance for systematic errors. None of the stars within the trend curves passed these criteria.
4.3. Praesepe white dwarfs
We also checked whether any of the known eleven Praesepe white dwarfs (Dobbie et al., 2006) were detected, indicating a possible white dwarf debris disk. WD 0837+199 showed a strong signal in [24]. The UKIRT Infrared Deep Sky Survey (UKIDSS) survey team (Sarah Casewell, private communication 2008) have found that this signal originates from a background galaxy a few arcseconds north of the WD.
4.4. Debris Disk Candidates
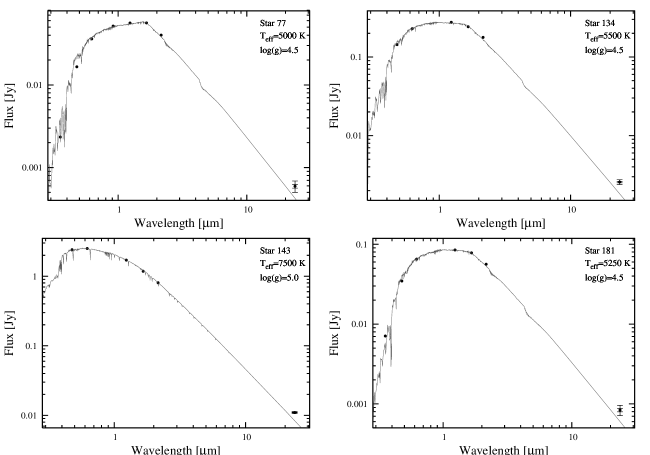
We discuss the four debris disk candidate stars in this section. None of these stars show extended emission (resolved disk), implying that the excess is confined to the radius of the MIPS beam of (Rieke et al., 2004), which is AU at the distance of Praesepe. This is consistent with the sizes of already resolved mid-IR debris disks (Stapelfeldt et al., 2004; Su et al., 2005, 2008; Backman et al., 2009). The best fitting SEDs of the debris disk candidate stars are plotted in Figure 8.
4.4.1 Star #77
This star was identified on three separate scanlegs, with no contamination by minor planets. It is rather faint with mag. Its optical and NIR photometry was best fitted by the and (K3 V) Kurucz model (Castelli & Kurucz, 2003). Franciosini et al. (2003) used XMM-Newton to detect X-ray emission from it with a flux of erg s-1 in the ROSAT 0.1-2.4 keV band. They point out that the flux measured by ROSAT (Randich & Schmitt, 1995) is a magnitude higher than theirs. The star is a cluster member cataloged in many papers (Wang et al., 1995; Klein Wassink, 1927; Jones & Cudworth, 1983).
4.4.2 Star #134
Star #134 (WJJP 179, KW 367) is a bright cluster member, with mag. It was imaged on two scanlegs with high S/N. Its optical and NIR photometry was best fitted by the and (G8 V) Kurucz model (Castelli & Kurucz, 2003) and we detect no extent to the stellar PSF core (Figure 7). North of it by , a fainter extended source is visible on both scanlegs. It has been found to be a triple system by Mermilliod et al. (1994) and the mass of the components was estimated by Halbwachs et al. (2003) using CORAVEL radial velocity measurements. The system consists of a wide pair, one of which is a spectroscopic binary with a period of 3.057 days. It is also a definite cluster member (Wang et al., 1995; Klein Wassink, 1927; Jones & Cudworth, 1983).
4.4.3 Star #143
This is the brightest of all debris disk stars we observed, with mag. Its optical and NIR photometry was best fitted with a , (A7 V) Kurucz model (Castelli & Kurucz, 2003). The PSF subtraction was very clean, with no hint of any extended emission (Figure 7). The star was discovered to be a Scuti type of pulsating variable by Paparó & Kolláth (1990) (HI Cnc, HD 73890, BD+19 2078). It has been cataloged as a definite cluster member in many papers (Wang et al., 1995; Klein Wassink, 1927; Jones & Cudworth, 1983). With high-resolution imaging surveys, Mason et al. (1993) found it to be a single star.
4.4.4 Star #181
The star was identified on three separate scanlegs. The best fit to its photometry points was with a , (K0 V) Kurucz model (Castelli & Kurucz, 2003). It has been identified as a cluster member in many catalogs (Wang et al., 1995; Hambly et al., 1995; Klein Wassink, 1927; Jones & Stauffer, 1991). It was not identified as a close binary star in the surveys of Bouvier et al. (2001) and Mermilliod & Mayor (1999). No extended emission is seen in our PSF subtracted image (Figure 7).
5. Discussion
We have found 4 sources out of 193 in the spectral range from A0 to K3 showing excess at 24 . One of our sources (star 143) is an A7 type star (out of 29 early-type stars), while the remaining three are G8, K0, and K3 (out of 164 solar-type stars), based on their photometric colors and fitted SEDs. Although the probability of chance alignments with faint background galaxies within are rather high for the K0 and K3 spectral-type sources, since the peaks of their emission are well within of the 2MASS coordinates they are likely excess sources. However, our statistics are incomplete to their spectral limit. In our field of view there are 106 stars within F0 and G8 spectral-type, of which we detected 98, meaning we have an almost complete sample of sources within this spectral band. We use the excess fraction of 1/106 for the solar-type star sample.
The excesses found around early type stars (B8-A9) are usually dealt with separately in the literature from the ones found around solar-type stars (F0-K4), because the dominant grain removal processes in the debris disks may not be the same and the 24 excesses probe significantly different distances from the stars. These populations are also separated observationally, by the natural detection limits.
In the following sections we analyze our results in the context of previous debris disk fractions observed around early- and solar-type stars. The errors on our debris disk fractions are given by Bayesian statistics detailed in the following §5.1. We contrast the results for early- and solar-type stars in §5.2 and §5.3 and discuss the implications for debris disk decay time scales in §5.4. In §5.5, we compare these results with a simple model for the incidence of episodes like the LHB around other stars.
5.1. Calulating errors on debris disk fractions
Due to the small number of observations, we estimated our debris disk fractions and associated uncertainties using a Bayesian approach, which we outline in this section.
If the fraction of objects with disks is , derived from our observed number of disks () from a sample size of , then the posterior probability that has a certain value will be
| (4) |
Here, if the probability distribution for , given that and are known. is the prior distribution of and is the probability of observing that of sources have a disk, assuming a certain value of . will be the posterior probability distribution for and is the likelihood function. If no prior assumption is made on the value of , then the prior will be uniform, i.e. . This will be assumed, so that all information on originates from the data itself. The likelihood function, , is a binomial distribution, therefore
| (5) |
where the binomial coefficient has been dropped because of its non-dependence on , making it irrevelant in the posterior distribution.
This equation is equivalent to a Beta () distribution with parameters and . The expectation value (posterior mean) of the distribution is simply
| (6) |
while its mode gives the regular ratio of (if and ). The 1 confidence region can be found by integrating the central region that contains 68.3% of the probability for the distribution. This was done in our paper by Monte Carlo-type calculations. We simulated random variables from a distribution and searched for the bottom and upper limits at the 15.85% and 84.15% percentiles.
We give our results with the expectation values and the upper and lower errors from the 1 limits. We decided to use expectation values (posterior mean) over mode averages based on that our fractions are usually low making the distributions skewed. In such cases, they are better described by their mean. For example, this will give an expected debris disk fraction of
| (7) |
for our solar-type stars.
5.2. The decay of the debris disk fraction in early-type stars
A-type stars are well suited to search for excess emission originating from debris disks. The extended surveys of Rieke et al. (2005) and Su et al. (2006), probed the excess fraction for A-type stars in the field and in associations between the ages of 5 and 850 Myr. Numerous observations have also determined the excess fraction for early-type stars in open clusters and associations (e.g. Young et al., 2004; Gorlova et al., 2004, 2006; Siegler et al., 2007; Cieza et al., 2008).

We compared our early spectral type excess fraction to the ones in the literature. We combined the data of Rieke et al. (2005) and Su et al. (2006), removing cluster and association members. Sources that were listed in both catalogs were adopted from Su et al. (2006), due to the improved reduction methods and photospheric model fits in the latter paper. Sources were counted as excess sources if their relative excess exceeded 15%. IRAS and ISO sources from the Rieke et al. (2005) sample were removed, due to their higher – 25% – excess thresholds. Our final age bins from the combined catalogs are listed in Table 3.
| Age | Excess fraction | |
|---|---|---|
| [Myr] | [#] | [%] |
| 3.16 - 10 | 6/10 | |
| 10 - 31.6 | 3/4 | |
| 31.6 - 100 | 4/10 | |
| 100 - 316 | 13/39 | |
| 316 - 1000 | 3/31 | |
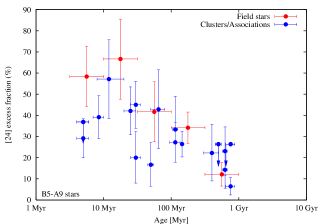
We also compared our results to those from open cluster (and OB association) surveys by other groups. We list these clusters, their excess fraction, age and the references for these parameters in Table 5.2. The majority of these clusters are from MIPS group papers, that used the same 15% excess level threshold as we did in our study of Praesepe. The few others used similar thresholds, or as in the case of the Pic MG study (Rebull et al., 2008), all excess sources that were identified exceeded their 20% threshold with no sources between 15 and 20%. We plot the excess fractions from all surveys with the field star samples in the top left panel of Figure 9.
| Name | Age | Excess fraction | Exc. | Age | |
|---|---|---|---|---|---|
| [Myr] | [#] | [%] | Reference | ||
| Upper Sco | 5 | 0/3 | 36.9∗ | 1,2 | 11 |
| Orion OB1b | 5 | 6/22 | 29.2 | 3 | 12 |
| Orion OB1a | 8.5 | 8/21 | 39.1 | 3 | 12 |
| Pic MG | 12 | 3/5 | 57.1 | 4 | 13 |
| Upper Cen | 25 | 7/17 | 42.1 | 1,2 | 14 |
| NGC 2547 | 30 | 8/18 | 45.0 | 5,6 | 5,6 |
| IC 2602 | 30 | 1/8 | 20.0 | 1 | 15 |
| IC 2391 | 50 | 1/10 | 16.7 | 7 | 16 |
| Per | 65 | 2/5 | 42.9 | 1,2 | 17,18 |
| Pleiades | 115 | 2/7 | 33.3 | 1 | 18,19,20 |
| Pleiades | 115 | 5/20 | 27.3 | 6 | 18,19,20 |
| NGC 2516 | 145 | 13/51 | 26.4 | 2 | 19,21 |
| Ursa M | 400 | 1/7 | 22.2 | 1 | 22,23,24 |
| Coma Ber | 500 | 0/5 | 26.4∗ | 1,2 | 25 |
| Hyades | 625 | 1/12 | 14.3 | 1 | 26 |
| Hyades | 625 | 2/11 | 23.1 | 9 | 26 |
| Praesepe | 757 | 1/29 | 6.5 | 10 | 10 |
| Praesepe | 757 | 0/5 | 26.4∗ | 1 | 10 |
References. — (1) Su et al. (2006); (2) Rieke et al. (2005); (3) Hernández et al. (2006); (4) Rebull et al. (2008); (5) Young et al. (2004); (6) Gorlova et al. (2007); (7) Siegler et al. (2007); (8) Gorlova et al. (2006); (9) Cieza et al. (2008); (10) This work; (11) Preibisch et al. (2002); (12) Briceño et al. (2005); (13) Ortega et al. (2002); (14) Fuchs et al. (2006); (15) Stauffer et al. (1997); (16) Barrado y Navascués et al. (2004); (17) Song et al. (2001); (18) Martín et al. (2001); (19) Meynet et al. (1993); (20) Stauffer et al. (1998); (21) Jeffries et al. (2001); (22) Soderblom & Mayor (1993); (23) Castellani et al. (2002); (24) King et al. (2003); (25) Odenkirchen et al. (1998); (26) Perryman et al. (1998)
The fifteen open clusters and associations follow the same trend as the field star sample, with the exception of IC 2602 (Su et al., 2006) and IC 2391 (Siegler et al., 2007). Possible explanations for this deviation are explored in Siegler et al. (2007) and they conclude that the most likely cause is the lack of a statistically large sample. The peak near Myr observed by Currie et al. (2008) is suggested. Thereafter, the excess fraction shows a steady decline to the age of Praesepe ( 750 Myr). Although the single A7 debris disk star we observed is not a statistically high number, the sample of 29 stars it was drawn from is high enough to indicate a real lack of debris disks around early-type stars at 750 Myr.
5.3. The decay of the debris disk fraction for solar-type stars
Detailed studies of the frequency of debris disks as a function of system age are useful tools to characterize belts of planetesimals and their collisions around solar-type stars. They provide important proxies for comparisons between the Solar System and exoplanetary systems in terms of planetary system formation and evolution. For example, observations at 70 show that Kuiper-belt-like planetesimal systems around solar-type stars can be rather common (%; Trilling et al., 2008)(%; Hillenbrand et al., 2008), but are not necessarily accompanied by 24 excess, which would be indicative of terrestrial planet formation.
| Age | Excess fraction | |
|---|---|---|
| [#] | [%] | |
| 3.16 - 10 Myr | 2/12 | 21.4 |
| 10 - 31.6 Myr | 2/8 | 30.0 |
| 31.6 - 100 Myr | 2/38 | 7.5 |
| 100 - 316 Myr | 7/48 | 16.0 |
| 316 - 1000 Myr | 7/58 | 13.3 |
| 1 - 3.16 Gyr | 2/94 | 3.1 |
| 3.16 - 10 Gyr | 6/167 | 4.1 |
| Name | Age | Excess fraction | Exc. | Age | |
|---|---|---|---|---|---|
| [Myr] | [#] | [%] | Reference | ||
| Orion OB1b | 5 | 7/12 | 57.1 | 1 | 11 |
| Upper Sco | 5 | 5/16 | 33.3 | 2 | 12 |
| Upper Sco | 5 | 2/5 | 42.9 | 3 | 12 |
| Cha | 8 | 8/13 | 60 | 4 | 13,14 |
| Orion OB1a | 9 | 4/5 | 71.4 | 1 | 11 |
| Pic MG | 12 | 5/25 | 22.2 | 5 | 15 |
| Lower Cen C | 16 | 11/24 | 46.2 | 3 | 16 |
| Lower Cen C | 16 | 5/14 | 37.5 | 2 | 16 |
| Upper Cen L | 17 | 3/11 | 30.8 | 3 | 12 |
| Upper Cen L | 17 | 1/23 | 8.0 | 2 | 12 |
| NGC 2547 | 30 | 8/20 | 40.9 | 6 | 6 |
| Tuc-Hor | 30 | 1/7 | 22.2 | 5 | 17 |
| IC 2602 | 30 | 1/5 | 28.6 | 2 | 18 |
| IC 2391 | 50 | 5/16 | 33.3 | 7 | 19 |
| Per | 65 | 2/13 | 20.0 | 2 | 20,21 |
| Pleiades | 115 | 5/53 | 10.9 | 8 | 21,22,23 |
| Pleiades | 115 | 5/20 | 27.3 | 2 | 21,22,23 |
| Hyades | 625 | 0/67 | 2.7∗ | 9 | 24 |
| Hyades | 625 | 0/22 | 7.7∗ | 2 | 24 |
| Praesepe | 757 | 1/106 | 1.9 | 10 | 10 |
References. — (1) Hernández et al. (2006); (2) Carpenter et al. (2008b); (3) Chen et al. (2005); (4) Gautier et al. (2008); (5) Rebull et al. (2008); (6) Gorlova et al. (2007); (7) Siegler et al. (2007); (8) Gorlova et al. (2006); (9) Cieza et al. (2008); (10) This work; (11) Briceño et al. (2005); (12) Preibisch et al. (2002); (13) Mamajek et al. (1999); (14) Lyo et al. (2004); (15) Ortega et al. (2002); (16) Mamajek et al. (2002); (17) Rebull et al. (2008), with arbitrary errors adopted from similar age clusters; (18) Stauffer et al. (1997); (19) Barrado y Navascués et al. (2004); (20) Song et al. (2001); (21) Martín et al. (2001); (22) Meynet et al. (1993); (23) Stauffer et al. (1998); (24) Perryman et al. (1998)
To provide a large sample, we merged the 24 data of Trilling et al. (2008), Beichman et al. (2006) and that of the FEPS group (Carpenter et al., 2008a, b; Meyer et al., 2008) resulting in a database of 425 solar-type field stars with age estimates in the range from 3.16 Myr to 10 Gyr. The tables in Trilling et al. (2008) include the results of Bryden et al. (2006) and Beichman et al. (2005) with their photometry data reevaluated with the same procedures as the newer Trilling et al. (2008) sample. We divided this database into the same logarithmic age bins as we did for the early-type field star sample and calculated the debris disk fraction in these bins using the 15% threshold in excess emission at 24 . The debris disk fractions are summarized in Table 5.
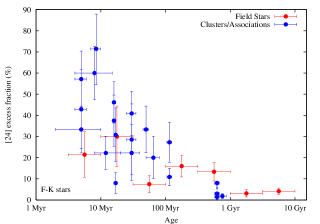
We also compiled results at 24 from the literature on debris disk fractions around solar-type stars in open clusters and associations. They are summarized in Table 5.3. The excess fractions for the combined sample of solar-type stars are plotted in the top right panel of Figure 9. The plots show a significantly larger scatter in the excess fractions for solar-type than for early-type stars. A second interesting feature is a possible environmental effect on the fraction of debris disks around solar-type stars. Although not pronounced – and possibly strongly effected by sampling biases – there seems to be higher fraction of debris disk stars in clusters/associations than in the field.
In Praesepe, the few debris disk candidate stars (from a statistically large sample of 106 stars) implies that the planetary systems in the 1-40 AU zones around solar-type stars have generally reached a quiescent phase. This behavior can be compared with that of the field star sample, which levels off at a few percent at ages Gyr. This result may seem surprising given the LHB period of the Solar System, but it is actually consistent with the models of Gomes et al. (2005) and Thommes et al. (2008). The LHB was modeled in these papers to be a result of instability in the planetary system, caused by either strong interaction at the mean motion resonances of Jupiter and Saturn or that of Uranus and Neptune. In both cases the outer planetary disk is destabilized, causing planetesimals to migrate inward and initiate a collisional cascade. The models of Gomes et al. (2005) show a wide range of ages (192 Myr – 1.1 Gyr) when the LHB can occur, but they are more likely to be initiated at the earlier ages. The timing of the cascade depends on a few initial conditions that can be set to realistic parameters to give any of the solutions. The paper by Strom et al. (2005) also agrees that the LHB was a catastrophic event, lasting between 10 and 150 Myr, however they argue that the characteristics of the craters found on the inner planets originating from that epoch are more likely to be from main belt asteroids.333Hartmann et al. (2000) and Morbidelli et al. (2001) argued that the LHB was the tail end of a monotonically decreasing impactor population. This theory was questioned by Bottke et al. (2007), who computed the probability of the cratering records being created by it, and could rule it out at a 99.7% (3) confidence level. The collisional cascade or ”terminal cataclysm” model is also supported by recent studies of Hadean-era zircons on Earth (Trail et al., 2007).
5.4. Evolutionary differences between the debris disks around early- and solar-type stars
To illustrate the differences between the evolution of debris disks around early- and solar-type stars, we combined the top panel plots in Figure 9 in the bottom panel of the same figure. There appears to be an upper envelope to the excess fraction as a function of age, as if there were a theoretical maximum number of debris disks possible at any age. There is substantial scatter below this envelope.


Figure 9 shows that there is a subtle difference between the evolution of debris disks around early- and solar-type stars. To reduce the effects of observational biases (such as detection thresholds) and sampling differences (number of stars in clusters), we rebinned all the data to a more homogeneous sampling. We used the same logarithmic age bins as we did for the field star samples: 3.16-10, 10-31.6, 31.6-100, 100-316 Myr, and 0.316-1, 1-3.16, and 3.16-10 Gyr. The result is shown in Figure 10, along with a second plot that shows the decay trends for A, F and G spectral-type stars separately. The data for all rebinned decay trends are summarized in Table 7. The ”rise-and-fall” characteristics for early-type stars is confirmed (Currie et al., 2008), but with a quick drop-off at later ages. The solar-type stars show a monotonic decaying trend that reaches a constant of a few percent at later ages. The most important feature though is that the trends have different timescales.
| Age | Early-type stars | Solar-type stars | A-type stars | F-type stars | G-type stars | |||||
|---|---|---|---|---|---|---|---|---|---|---|
| Excess fraction | Excess fraction | Excess fraction | Excess fraction | Excess fraction | ||||||
| [#] | [%] | [#] | [%] | [#] | [%] | [#] | [%] | [#] | [%] | |
| 3.16 - 10Myr | 20/56 | 36.2 | 28/63 | 44.6 | 19/35 | 54.05 | 12/20 | 59.09 | 3/15 | 23.5 |
| 10 - 31.6Myr | 22/52 | 42.6 | 37/137 | 27.3 | 11/20 | 54.55 | 19/42 | 45.45 | 7/39 | 19.5 |
| 31.6 - 100Myr | 7/25 | 29.6 | 9/67 | 14.5 | 4/6 | 62.50 | 2/8 | 30.00 | 2/29 | 9.7 |
| 100 - 316Myr | 33/117 | 28.6 | 17/121 | 14.6 | 13/44 | 30.43 | 2/11 | 23.08 | 10/42 | 25.0 |
| 316 - 1000Myr | 8/100 | 8.8 | 8/253 | 3.5 | 5/62 | 9.38 | 4/30 | 15.62 | 3/70 | 5.6 |
| 1 - 3.16Gyr | - | - | 2/94 | 3.1 | - | - | 2/52 | 5.56 | 0/37 | 2.6 |
| 3.16 - 10Gyr | - | - | 6/167 | 4.1 | - | - | 2/57 | 5.08 | 0/85 | 1.2 |
The fraction of infrared excesses at a given age range is set by the interplay of the occurrence rate of the collisional cascades for each system, the longevity of the dust produced in these cascades, and our ability to detect the debris at the distance of the given cluster. Detailed modeling of these processes is required to interpret the different rate of decline in the debris disk fraction between early- and solar-type stars. Although such modeling is beyond the scope of this paper, three possible explanations can be invoked to explain qualitatively the faster decline of excess fraction around solar-type stars. First, the dust must be in the 24 emitting regions and solar-type stars have about 50 smaller disk surface area in which a collisional cascade can produce warm enough dust. Second, the orbital velocity of planetesimals in the 24 emitting zone will be higher around solar-type than the early-type stars, possibly accelerating the evolution of their debris disks. Third, the dust size distributions and lifetimes are different for the two groups of stars. These issues will be discussed in a forthcoming paper (Gáspár et al. 2009).
5.5. Our results in context with the Late Heavy Bombardment
The cratering record of all non geologically active rocky planets and moons in the inner Solar System reveal a period of very intense past bombardment. Geochronology of the lunar cratering record shows that this bombardment ended abruptly at Myr (see e.g. Tera et al., 1973, 1974; Chapman et al., 2007), but the scarcity of the lunar rock record prior to this event hinders accurate assessment of the temporal evolution of the impact rates or the length of the bombardment period. Dynamical simulations of different possible impactor populations show that an unrealistically massive impactor population would be required to maintain the impact rate measured at the end of the bombardment for a prolonged period, thus convincingly arguing for the bombardment being a short-duration spike in the impact rate (Bottke et al., 2007). A possible explanation for this is that a dynamical instability initiated by the migration of the giant planets caused minor planetary bodies to migrate inwards from the outer region of the Solar System, bombarding the inner planets. Modeling shows that this scenario can occur over a wide range of ages (Gomes et al., 2005). Strom et al. (2005) show that it is possible instead that main belt asteroids bombarded the planetary system.

We performed a Monte Carlo simulation to evaluate our observed debris disk fraction in the context of the evidence from the LHB. Our goal was to constrain the fraction of the solar-type stars that undergo LHB (or fine dust generation) and the duration of these events. We presumed in our models that all LHB events could be detected in the existing debris disk surveys and that they had an equal probability of occurring once from 100 Myr to 1 Gyr. Both of these are strong assumptions. There is significant uncertainty on how much dust was generated and under what time scales during the LHB, making it difficult to relate the LHB unambiguously to debris disks. However, given that Spitzer measurements of 24 excess emission are typically sensitive to a collisional cascade involving mass on the order of a few lunar masses, and that such an episode has clearing time scale Myr (Grogan et al., 2001), it seems plausible that the destruction of a few large asteroids can be detected in most observed systems. In our code we modeled clusters with 135 (106+29) members in 20000 simulations. We varied the overall percentage of stars that will ever generate a debris disk from 0 to 100 % and the duration of their bombardment episodes from 0 to 500 Myr. If the number of disks at 750 Myr were within our measured excess fraction of 1-3%, the simulation was tagged as being consistent with our measurements, else it was tagged inconsistent. The overall probability of a given parameter pair is given by dividing the number of consistent simulations at a certain total disk fraction and duration timescale by the number of simulations (20000).
Our calculated probability map is shown in Figure 11. The plot shows that the results are degenerate in the parameter space of d and , with d being the duration of a bombardment episode and the percentage of stars to ever undergo such an event. Between the extremes of a very large percentage of the stars undergoing debris disk generation, but with a very short lifetime ( 5-10 Myr) and a very small percentage ( %), with a long ( Myr) lifetime there is a continuous set of solutions.
Our simple model allows the quantitative assessment of the probability of different types of LHB-like episodes. For example, we can exclude at a 3 % significance level that 60% of the stars undergo major orbital rearrangements, if this leads to debris production over 100 Myr. Similarly, very short debris producing events are unlikely, because they would not produce observable disks, inconsistent with our results.
If we seek to evaluate the probability of strictly LHB-like debris producing episodes we can fix the length of the episode to 75 Myr, consistent with the duration estimated for the inner Solar System and the other timescales discussed in §5.3. In this case our results show that up to 15-30 % of the stars should undergo such a major orbital reorientation during the first Gyr of their evolution to be consistent with our modeling.
6. Summary
We conducted a 24 photometric survey for debris disks in the nearby ( 180 pc) relatively old (750 Myr) Praesepe open cluster. The combined sample of SDSS, Webda, and 2MASS gave us a robust highly probable cluster member list. With simultaneous fitting of cluster distance and age we derived a series of solutions for both parameters as a function of metallicity (see Appendix). Our derived age for Praesepe is 757 Myr ( 114 Myr at 3 confidence) and a distance of 179 pc ( 6 pc at 3 confidence), not allowing for systematic errors.
Out of the 193 cluster members that we detected at all wavelengths in the combined catalog, 29 were early (B5-A9) and 164 later (F0-M0) spectral types. We found one star in the early and three in the later spectral type groups that show excess emission. Up to near our completeness limit, with one debris disk star, there are 106 sources in the later spectral-type sample. This result shows that only % of early- and % of solar-type stars are likely to possess debris disks in the 1-40 AU zones. These values are similar to that found for old ( Gyr) field stars.
We place our results in context with the Late Heavy Bombardment theory of the Solar System. With simple Monte Carlo modeling we show that our observations are consistent with 15-30% of the stars undergoing a major re-arrangement of the planetary orbits and a subsequent LHB-like episode once in their lifetime, with a duration period of 50-100 Myr.
We also summarize the results in the literature on the decay timescales of debris disks around early- and solar-type stars. We find that the decay timescale for solar-type stars is shorter than for earlier-type stars.
Appendix A Age and distance estimate
The precise value of the cluster age is important in constraining the debris disk fraction as a function of stellar age. The age and distance of Praesepe have been a matter of debate, especially since it is an important step in the galactic distance ladder. The estimated ages spread from all the way to (400 Myr – 1.42 Gyr)444Allen (1973); Vandenberg & Bridges (1984); Tsvetkov (1993); González-García et al. (2006). Most papers list it as a coeval cluster with the Hyades because of their similar metallicities and spatial motions (see, e.g., Barrado y Navascués et al., 1998). The Hyades on the other hand has a better defined age of (62550 Myr)(Perryman et al., 1998; Lebreton et al., 2001). If the clusters are coeval, their ages should agree within close limits.
Aside from using pulsating variables (Tsvetkov, 1993) or stellar rotation (Pace & Pasquini, 2004) to estimate the age of the cluster, the only method is to fit theoretical stellar evolution turnoff points on the observed CMD. This procedure involves a precise simultaneous fitting of the cluster distance, reddening, metallicity and age.


The metallicity of Praesepe has been revisited many times. The value of Boesgaard & Budge (1988) of is usually accepted. An et al. (2007), with new spectroscopic measurements, obtained a value of , also showing that the cluster is slightly metal rich. This fact has been overlooked in some studies that have used solar values for metallicity, and which therefore underestimate the cluster distance and overestimate its age.
The distance to Praesepe has been determined with many methods, yielding slight differences among the measured values. Gatewood & de Jonge (1994) used the Multichannel Astrometric Photometer (MAP) of the Thaw Refractor of the University of Pittsburgh to determine a weighted mean parallax of mas for five cluster member stars. The geometric method used by Loktin (2000) determines the apparent variation of the angular diameter of the cluster as it moves along the line of sight and estimates the distance to the cluster from it. The basic idea of this method is very similar to that of the convergent point method. The photometric distances (main-sequence fitting) seem to show a large scatter. We summarize the previous distance measurements and the methods used to obtain the values in Table 8.
We determined the distance and age of the cluster by simultaneously fitting the distance modulus and the age with isochrones. The photometry values we used were our best SDSS and band data, with the corrections explained in §3. We did not include reddening in our color values, because it can be neglected towards Praesepe (E(B-V)=0.027 0.004 mag; Taylor (2006)). Since the plotted CMD of Praesepe clearly showed a vertical trend at the later spectral type stars at , we only fitted cluster member points with (fitting the distance modulus to a vertical trend is impossible and only adds errors to the fit). The isochrones for the fit were obtained from the Padova group website555http://pleiadi.pd.astro.it/, where isochrones of any age and metallicity can be generated for a large number of photometric systems, such as the SDSS system (Girardi et al., 2004). These isochrones are similar to the empirical isochrones produced by An et al. (2007).
Since the metallicity of the cluster is still debated, we fitted isochrone sets for all metallicities in the literature. Assuming that metallicities are solar scaled, we set [Fe/H]=[M/H]. We fitted the following: [Fe/H]=0.13 (Z=0.025; Boesgaard & Budge, 1988), [Fe/H]=0.11 (Z=0.024; An et al., 2007) and [M/H]=0.2 (Z=0.03; An et al., 2007). The two values from the An et al. (2007) paper are from [Fe/H], determined from spectroscopy, and an [M/H] value from isochrone fitting. We also fitted solar metallicity isochrones to show the errors they give in the age and distance determinations.
We calculated the best fit via Monte Carlo (i.e. bootstrap) method. We generated 10,000 new samples with the same number of sources as in the original cluster member list. As with the bootstrap method, the members in the new samples were randomly picked from the original, resulting in multiple picks of a few sources and null of others. The best fitting isochrones (as a function of age and distance) to these mock samples were found by minimization. We computed from each fit as
| (A1) |
where is the r magnitude difference while is the color difference from the closest point of the isochrone model. By finding the closest point of the isochrones we not only fit the luminosity difference, but an actual distance from the isochrone, thus allowing points to be horizontally offset. We did not weight our fit by photometric errors, because the brightest members (that are most crucial in the age determination) did not have quoted errors, while the errors of the SDSS data cannot be trusted brighter than magnitude. The means and errors in age and distance modulus of the best fitting isochrone (for all metalicities) were calculated from the distribution of solutions given by the bootstrap method. Following an initial fit, we removed stars that were further than 3 magnitude from the best fitting isochrones and reran the Monte Carlo code. The best fit value is given as the arithmetic mean and its error as its standard deviation.
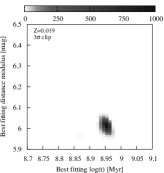
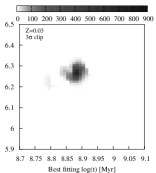
The 2D errors for the fits are shown in Figure 12, both for the full and for the clipped samples. The histograms of the distance modulus and age fits are shown in Figure 13, both for the full and for the clipped samples also. The results of the fitting for the 3 clipped sample are summarized in Table 9 quoting the 1 errors. These errors are purely from the fitting procedure, and do not include possible systematic errors such as those from isochrone models, reddening, extinction and photometry.
The best fitting isochrones for the four metallicities are shown in Figure 14. All isochrones seem to deviate from the observed trend at magnitude. This is either due to errors in the calculated isochrones or to the membership criteria of Kraus & Hillenbrand (2007), who used estimated Teff and luminosity values from photometry fitted SEDs and theoretical Hertzsprung-Russell diagrams.
| Reference | Method used | |
|---|---|---|
| [mag] | ||
| Nissen (1988) | Photometric | 6.05 |
| Mermilliod et al. (1990) | Photometric | 6.2 |
| Hauck (1981) | PhotometricaaUsing Lutz-Kelker corrections (Lutz & Kelker, 1973). | 6.260.23 |
| Vandenberg & Bridges (1984) | Photometric | 5.85 |
| An et al. (2007) | PhotometricbbUsing empirically corrected isochrones. | 6.33 0.04 |
| Gatewood & de Jonge (1994) | Parallax | 6.42 0.33 |
| Loktin (2000) | Geometric | 6.16 0.19 |
| This paper | Photometric | 6.267 0.024 |
| Metallicity | Age | |
|---|---|---|
| [mag] | [] | |
| aaBoesgaard & Budge (1988) | ||
| bbAn et al. (2007) | ||
| bbAn et al. (2007) |
We adopted the metallicity of Z=0.03 (An et al., 2007) to give a final estimate of the cluster’s age and distance. We chose this metallicity to ensure comparability, since An et al. (2007) deduced it from isochrone fitting also. The distance modulus of our best fit for this metallicity is at 1 confidence, within errorbars of the value of An et al. (2007) ( mag). The errorbars on distance are small at 3 and comparable to the diameter of the cluster’s central region ( 6 pc). The age of the cluster is determined to be (757 36 Myr) at 1 confidence. The errorbars on cluster age are significantly smaller than in papers before and help to pin down the decay trend at ages between 0.5 and 1 Gyr. The bootstrap Monte Carlo isochrone fitting method we introduce here turned out to be a very effective and successful way to determine cluster distance and age, and to estimate the errors of these parameters.
References
- Allen (1973) Allen, C. W. 1973, London: University of London, Athlone Press, —c1973, 3rd ed.,
- An et al. (2007) An, D., Terndrup, D. M., Pinsonneault, M. H., Paulson, D. B., Hanson, R. B., & Stauffer, J. R. 2007, ApJ, 655, 233
- Andruk et al. (1995) Andruk, V., Kharchenko, N., Schilbach, E., & Scholz, R. D. 1995, Astronomische Nachrichten, 316, 225
- Anthony-Twarog (1982) Anthony-Twarog, B. J. 1982, ApJ, 255, 245
- Aumann et al. (1984) Aumann, H. H., et al. 1984, ApJ, 278, L23
- Backman & Paresce (1993) Backman, D. E., & Paresce, F. 1993, Protostars and Planets III, 1253
- Backman et al. (2009) Backman, D., et al. 2009, ApJ, 690, 1522
- Barrado y Navascués et al. (1998) Barrado y Navascués, D., Stauffer, J. R., & Randich, S. 1998, ApJ, 506, 347
- Barrado y Navascués et al. (2004) Barrado y Navascués, D., Stauffer, J. R., & Jayawardhana, R. 2004, ApJ, 614, 386
- Beichman et al. (2005) Beichman, C. A., et al. 2005, ApJ, 622, 1160
- Beichman et al. (2006) Beichman, C. A., et al. 2006, ApJ, 652, 1674
- Boesgaard & Budge (1988) Boesgaard, A. M., & Budge, K. G. 1988, ApJ, 332, 410
- Bottke et al. (2007) Bottke, W. F., Levison, H. F., Nesvorný, D., & Dones, L. 2007, Icarus, 190, 203
- Bouvier et al. (2001) Bouvier, J., Duchêne, G., Mermilliod, J.-C., & Simon, T. 2001, A&A, 375, 989
- Briceño et al. (2005) Briceño, C., Calvet, N., Hernández, J., Vivas, A. K., Hartmann, L., Downes, J. J., & Berlind, P. 2005, AJ, 129, 907
- Bryden et al. (2006) Bryden, G., et al. 2006, ApJ, 636, 1098
- Carpenter et al. (2008a) Carpenter, J. M., et al. 2008a, arXiv:0810.1003
- Carpenter et al. (2008b) Carpenter, J. M., et al. 2008b, ApJS, 179, 423
- Castelaz et al. (1991) Castelaz, M. W., Persinger, T., Stein, J. W., Prosser, J., & Powell, H. D. 1991, AJ, 102, 2103
- Castellani et al. (2002) Castellani, V., Degl’Innocenti, S., Prada Moroni, P. G., & Tordiglione, V. 2002, MNRAS, 334, 193
- Castelli & Kurucz (2003) Castelli, F. & Kurucz, R.L. 2003, in Poster Papers, IAU Symp. 210: Modelling of Stellar Atmospheres, ed. N. Piskunov, W. W. Weiss & D. F. Gray (San Francisco: ASP), 20
- Chapman et al. (2007) Chapman, C. R., Cohen, B. A., & Grinspoon, D. H. 2007, Icarus, 189, 233
- Chen et al. (2005) Chen, C. H., Jura, M., Gordon, K. D., & Blaylock, M. 2005, ApJ, 623, 493
- Cieza et al. (2008) Cieza, L. A., Cochran, W. D., & Augereau, J.-C. 2008, ApJ, 679, 720
- Cox (2000) Cox, A. N. 2000, Allen’s astrophysical quantities, 4th ed. Publisher: New York: AIP Press; Springer, 2000. Editedy by Arthur N. Cox. ISBN: 0387987460
- Currie et al. (2008) Currie, T., Kenyon, S. J., Balog, Z., Rieke, G., Bragg, A., & Bromley, B. 2008, ApJ, 672, 558
- Dickens et al. (1968) Dickens, R. J., Kraft, R. P., & Krzeminski, W. 1968, AJ, 73, 6
- Dobbie et al. (2006) Dobbie, P. D., et al. 2006, MNRAS, 369, 383
- Dominik & Decin (2003) Dominik, C., & Decin, G. 2003, ApJ, 598, 626
- Engelbracht et al. (2007) Engelbracht et al. 2007, astro-ph, 07042195, to be published in PASP
- Fuchs et al. (2006) Fuchs, B., Breitschwerdt, D., de Avillez, M. A., Dettbarn, C., & Flynn, C. 2006, MNRAS, 373, 993
- Fukugita et al. (1996) Fukugita, M., Ichikawa, T., Gunn, J. E., Doi, M., Shimasaku, K., & Schneider, D. P. 1996, AJ, 111, 1748
- Franciosini et al. (2003) Franciosini, E., Randich, S., & Pallavicini, R. 2003, A&A, 405, 551
- Gatewood & de Jonge (1994) Gatewood, G., & de Jonge, J. K. 1994, ApJ, 428, 166
- Gautier et al. (2007) Gautier, T. N., III, et al. 2007, ApJ, 667, 527
- Gautier et al. (2008) Gautier, T. N., III, Rebull, L. M., Stapelfeldt, K. R., & Mainzer, A. 2008, ApJ, 683, 813
- Girardi et al. (2004) Girardi, L., Grebel, E. K., Odenkirchen, M., & Chiosi, C. 2004, A&A, ssss422, 205
- Gomes et al. (2005) Gomes, R., Levison, H. F., Tsiganis, K., & Morbidelli, A. 2005, Nature, 435, 466
- González-García et al. (2006) González-García, B. M., Zapatero Osorio, M. R., Béjar, V. J. S., Bihain, G., Barrado Y Navascués, D., Caballero, J. A., & Morales-Calderón, M. 2006, A&A, 460, 799
- Gordon et al. (2005) Gordon, K.D., et al. 2005, PASP, 117, 503
- Gorlova et al. (2004) Gorlova, N., et al. 2004, ApJS, 154, 448
- Gorlova et al. (2006) Gorlova, N., Rieke, G. H., Muzerolle, J., Stauffer, J. R., Siegler, N., Young, E. T., & Stansberry, J. H. 2006, ApJ, 649, 1028
- Gorlova et al. (2007) Gorlova, N., Balog, Z., Rieke, G. H., Muzerolle, J., Su, K. Y. L., Ivanov, V. D., & Young, E. T. 2007, ApJ, 670, 516
- Grogan et al. (2001) Grogan, K., Dermott, S. F., & Durda, D. D. 2001, Icarus, 152, 251
- Habing et al. (2001) Habing, H. J., et al. 2001, A&A, 365, 545
- Halbwachs et al. (2003) Halbwachs, J. L., Mayor, M., Udry, S., & Arenou, F. 2003, A&A, 397, 159
- Hambly et al. (1995) Hambly, N. C., Steele, I. A., Hawkins, M. R. S., & Jameson, R. F. 1995, A&AS, 109, 29
- Hartmann et al. (2000) Hartmann, W. K., Ryder, G., Dones, L., & Grinspoon, D. 2000, Origin of the earth and moon, edited by R.M. Canup and K. Righter and 69 collaborating authors. Tucson: University of Arizona Press., p.493-512, 493
- Hauck (1981) Hauck, B. 1981, A&A, 99, 207
- Hernández et al. (2006) Hernández, J., Briceño, C., Calvet, N., Hartmann, L., Muzerolle, J., & Quintero, A. 2006, ApJ, 652, 472
- Hillenbrand et al. (2008) Hillenbrand, L. A., et al. 2008, ApJ, 677, 630
- Jeffries et al. (2001) Jeffries, R. D., Thurston, M. R., & Hambly, N. C. 2001, A&A, 375, 863
- Jester et al. (2005) Jester, S., et al. 2005, AJ, 130, 873
- Johnson (1952) Johnson, H. L. 1952, ApJ, 116, 640
- Jones & Cudworth (1983) Jones, B. F., & Cudworth, K. 1983, AJ, 88, 215
- Jones & Stauffer (1991) Jones, B. F., & Stauffer, J. R. 1991, AJ, 102, 1080
- Jordi et al. (2006) Jordi, K., Grebel, E. K., & Ammon, K. 2006, A&A, 460, 339
- Kim et al. (2005) Kim, J. S., et al. 2005, ApJ, 632, 659
- King et al. (2003) King, J. R., Villarreal, A. R., Soderblom, D. R., Gulliver, A. F., & Adelman, S. J. 2003, AJ, 125, 1980
- Klein Wassink (1927) Klein Wassink, W. J. 1927, Publications of the Kapteyn Astronomical Laboratory Groningen, 41, 1
- Kraus & Hillenbrand (2007) Kraus, A. L., & Hillenbrand, L. A. 2007, AJ, 134, 2340
- Lebreton et al. (2001) Lebreton, Y., Fernandes, J., & Lejeune, T. 2001, A&A, 374, 540
- Loktin (2000) Loktin, A. V. 2000, Astronomy Letters, 26, 657
- Lutz & Kelker (1973) Lutz, T. E., & Kelker, D. H. 1973, PASP, 85, 573
- Lutz & Lutz (1977) Lutz, T. E., & Lutz, J. H. 1977, AJ, 82, 431
- Lyo et al. (2004) Lyo, A.-R., Lawson, W. A., Feigelson, E. D., & Crause, L. A. 2004, MNRAS, 347, 246
- Mamajek et al. (1999) Mamajek, E. E., Lawson, W. A., & Feigelson, E. D. 1999, ApJ, 516, L77
- Mamajek et al. (2002) Mamajek, E. E., Meyer, M. R., & Liebert, J. 2002, AJ, 124, 1670
- Mamajek et al. (2004) Mamajek, E. E., Meyer, M. R., Hinz, P. M., Hoffmann, W. F., Cohen, M., & Hora, J. L. 2004, ApJ, 612, 496
- Martín et al. (2001) Martín, E. L., Dahm, S., & Pavlenko, Y. 2001, Astrophysical Ages and Times Scales, 245, 349
- Mason et al. (1993) Mason, B. D., Hartkopf, W. I., McAlister, H. A., & Sowell, J. R. 1993, AJ, 106, 637
- Mendoza (1967) Mendoza, E. E. 1967, Boletin de los Observatorios Tonantzintla y Tacubaya, 4, 149
- Mermilliod et al. (1990) Mermilliod, J.-C., Weis, E. W., Duquennoy, A., & Mayor, M. 1990, A&A, 235, 114
- Mermilliod et al. (1994) Mermilliod, J.-C., Duquennoy, A., & Mayor, M. 1994, A&A, 283, 515
- Mermilliod & Mayor (1999) Mermilliod, J.-C., & Mayor, M. 1999, A&A, 352, 479
- Meyer et al. (2004) Meyer, M. R., et al. 2004, ApJS, 154, 422
- Meyer et al. (2008) Meyer, M. R., et al. 2008, ApJ, 673, L181
- Meynet et al. (1993) Meynet, G., Mermilliod, J.-C., & Maeder, A. 1993, A&AS, 98, 477
- Morbidelli et al. (2001) Morbidelli, A., Petit, J.-M., Gladman, B., & Chambers, J. 2001, Meteoritics and Planetary Science, 36, 371
- Nissen (1988) Nissen, P. E. 1988, A&A, 199, 146
- Odenkirchen et al. (1998) Odenkirchen, M., Soubiran, C., & Colin, J. 1998, New Astronomy, 3, 583
- Oja (1985) Oja, T. 1985, A&AS, 61, 331
- Ortega et al. (2002) Ortega, V. G., de la Reza, R., Jilinski, E., & Bazzanella, B. 2002, ApJ, 575, L75
- Pace & Pasquini (2004) Pace, G., & Pasquini, L. 2004, A&A, 426, 1021
- Paparó & Kolláth (1990) Paparó, M., & Kolláth, Z. 1990, Confrontation Between Stellar Pulsation and Evolution, 11, 336
- Papovich et al. (2004) Papovich, C., et al. 2004, ApJS, 154, 70
- Perryman et al. (1998) Perryman, M. A. C., et al. 1998, A&A, 331, 81
- Preibisch et al. (2002) Preibisch, T., Brown, A. G. A., Bridges, T., Guenther, E., & Zinnecker, H. 2002, AJ, 124, 404
- Randich & Schmitt (1995) Randich, S., & Schmitt, J. H. M. M. 1995, A&A, 298, 115
- Rebull et al. (2008) Rebull, L. M., et al. 2008, ApJ, 681, 1484
- Rieke et al. (2004) Rieke, G. H., et al. 2004, ApJS, 154, 25
- Rieke et al. (2005) Rieke, G. H., et al. 2005, ApJ, 620, 1010
- Rieke et al. (2008) Rieke, G. H., et al. 2008, AJ, 135, 2245
- Siegler et al. (2007) Siegler, N., Muzerolle, J., Young, E. T., Rieke, G. H., Mamajek, E. E., Trilling, D. E., Gorlova, N., & Su, K. Y. L. 2007, ApJ, 654, 580
- Silverstone et al. (2006) Silverstone, M. D., et al. 2006, ApJ, 639, 1138
- Soderblom & Mayor (1993) Soderblom, D. R., & Mayor, M. 1993, AJ, 105, 226
- Song et al. (2001) Song, I., Caillault, J.-P., Barrado y Navascués, D., & Stauffer, J. R. 2001, ApJ, 546, 352
- Spangler et al. (2001) Spangler, C., Sargent, A. I., Silverstone, M. D., Becklin, E. E., & Zuckerman, B. 2001, ApJ, 555, 932
- Stapelfeldt et al. (2004) Stapelfeldt, K. R., et al. 2004, ApJS, 154, 458
- Stauffer (1982) Stauffer, J. 1982, PASP, 94, 678
- Stauffer et al. (1997) Stauffer, J. R., Hartmann, L. W., Prosser, C. F., Randich, S., Balachandran, S., Patten, B. M., Simon, T., & Giampapa, M. 1997, ApJ, 479, 776
- Stauffer et al. (1998) Stauffer, J. R., Schultz, G., & Kirkpatrick, J. D. 1998, ApJ, 499, L199
- Stauffer et al. (2005) Stauffer, J. R., et al. 2005, AJ, 130, 1834
- Strom et al. (2005) Strom, R. G., Malhotra, R., Ito, T., Yoshida, F., & Kring, D. A. 2005, Science, 309, 1847 01
- Su et al. (2005) Su, K. Y. L., et al. 2005, ApJ, 628, 487
- Su et al. (2006) Su, K. Y. L., et al. 2006, ApJ, 653, 675
- Su et al. (2008) Su, K. Y. L., Rieke, G. H., Stapelfeldt, K. R., Smith, P. S., Bryden, G., Chen, C. H., & Trilling, D. E. 2008, ApJ, 679, L125
- Taylor (2006) Taylor, B. J. 2006, AJ, 132, 2453
- Tera et al. (1973) Tera, F., Papanastassiou, D. A., & Wasserburg, G. J. 1973, Lunar and Planetary Institute Conference Abstracts, 4, 723
- Tera et al. (1974) Tera, F., Papanastassiou, D. A., & Wasserburg, G. J. 1974, Earth and Planetary Science Letters, 22, 1
- Thommes et al. (2008) Thommes, E. W., Bryden, G., Wu, Y., & Rasio, F. A. 2008, ApJ, 675, 1538
- Trail et al. (2007) Trail, D., Mojzsis, S. J., & Harrison, T. M. 2007, Geochim. Cosmochim. Acta, 71, 4044
- Trilling et al. (2008) Trilling, D. E., et al. 2008, ApJ, 674, 1086
- Tsvetkov (1993) Tsvetkov, T. G. 1993, Ap&SS, 203, 247
- Upgren et al. (1979) Upgren, A. R., Weis, E. W., & Deluca, E. E. 1979, AJ, 84, 1586
- Vandenberg & Bridges (1984) Vandenberg, D. A., & Bridges, T. J. 1984, ApJ, 278, 679
- Wang et al. (1995) Wang, J. J., Chen, L., Zhao, J. H., & Jiang, P. F. 1995, A&AS, 113, 419
- Weis (1981) Weis, E. W. 1981, PASP, 93, 437
- Wyatt et al. (2007) Wyatt, M. C., Smith, R., Su, K. Y. L., Rieke, G. H., Greaves, J. S., Beichman, C. A., & Bryden, G. 2007, ApJ, 663, 365
- Young et al. (2004) Young, E. T., et al. 2004, ApJS, 154, 428
- Zhao & Newberg (2006) Zhao, C., & Newberg, H. J. 2006, ArXiv Astrophysics e-prints, arXiv:astro-ph/0612034
| # | g$\ast$$\ast$Upper limitUpper limit | r$\ast$$\ast$The r and/or g magnitudes marked with a star were calculated from B and V magnitudes as described in §3, while the rest are the original SDSS values. | K2MASS | [24]$\dagger$$\dagger$The [24] magnitudes are the ones that were calibrated to the 2MASS KS magnitudes, while the mJy values in the F24 column are the original flux values. | F24$\dagger$$\dagger$The [24] magnitudes are the ones that were calibrated to the 2MASS KS magnitudes, while the mJy values in the F24 column are the original flux values. | W#$\ddagger$$\ddagger$The numbers in this column represent the numbering of Wang et al. (1995). | 2MASS | ||||
|---|---|---|---|---|---|---|---|---|---|---|---|
| [h:m:s] | [∘:′:′′] | [mag] | [mag] | [mag] | [mag] | [mJy] | [mas yr-1] | [mas yr-1] | |||
| 1 | 8:36:29.83 | 18:57:56.52 | 9.57 | 9.33∗ | 8.300.01 | 8.230.05 | 3.54 0.15 | -34.60 | -12.60 | - | 08362985+1857570 |
| 2 | 8:36:48.95 | 19:15:26.06 | 11.54∗ | 10.92∗ | 9.690.02 | 9.350.06 | 1.26 0.07 | -36.30 | -12.80 | - | 08364896+1915265 |
| 3 | 8:37:02.04 | 19:36:17.42 | 9.34 | 9.06∗ | 8.060.01 | 8.010.02 | 4.32 0.09 | -34.30 | -13.00 | - | 08370203+1936171 |
| 4 | 8:37:16.35 | 19:29:11.58 | 14.67 | 13.38 | 10.470.02 | 10.060.07 | 0.65 0.04 | -34.70 | -15.40 | 267 | 08371635+1929103 |
| 5 | 8:37:18.29 | 19:41:56.33 | 11.75 | 11.23 | 9.800.02 | 9.690.05 | 0.93 0.04 | -37.20 | -15.20 | 268 | 08371829+1941564 |
| 6 | 8:37:26.51 | 19:29:13.06 | 14.48 | 13.33 | 10.830.02 | 10.770.15 | 0.34 0.05 | -42.70 | -14.40 | 274 | 08372638+1929128 |
| 7 | 8:37:27.58 | 19:37:03.29 | 11.97 | 11.40 | 9.810.02 | 9.750.06 | 0.87 0.04 | -34.10 | -12.60 | 277 | 08372755+1937033 |
| 8 | 8:37:27.95 | 19:33:45.25 | 9.91∗ | 9.64 | 8.460.02 | 8.480.02 | 2.80 0.06 | -36.60 | -13.20 | 2 | 08372793+1933451 |
| 9 | 8:37:28.22 | 19:09:44.32 | 9.65 | 9.37∗ | 8.400.01 | 8.390.02 | 3.06 0.05 | -36.20 | -13.40 | 3 | 08372819+1909443 |
| 10 | 8:37:33.84 | 20:00:49.39 | 8.76∗ | 8.66∗ | 7.950.03 | 7.950.02 | 4.57 0.10 | -35.70 | -13.10 | 5 | 08373381+2000492 |
| 11 | 8:37:36.33 | 19:15:53.96 | 14.05∗ | 13.05∗ | 10.760.02 | 10.340.09 | 0.51 0.04 | -35.30 | -11.20 | 288 | 08373624+1915542 |
| 12 | 8:37:37.00 | 19:43:58.69 | 7.77∗ | 7.79∗ | 7.290.01 | 7.300.01 | 8.31 0.09 | N/A | N/A | 6 | 08373699+1943585 |
| 13 | 8:37:40.71 | 19:31:06.38 | 8.29 | 8.20∗ | 7.660.01 | 7.630.01 | 6.14 0.08 | -34.80 | -12.50 | 10 | 08374070+1931063 |
| 14 | 8:37:42.36 | 19:08:01.57 | 10.05∗ | 9.75∗ | 8.580.02 | 8.580.02 | 2.57 0.05 | -36.60 | -13.50 | 12 | 08374235+1908015 |
| 15 | 8:37:46.35 | 19:35:57.26 | 12.75 | 12.04 | 10.240.02 | 10.140.06 | 0.61 0.03 | -37.80 | -9.40 | 295 | 08374640+1935575 |
| 16 | 8:37:46.64 | 19:26:18.10 | 10.85∗ | 10.50 | 9.280.02 | 9.320.04 | 1.29 0.04 | -36.10 | -13.40 | 13 | 08374660+1926181 |
| 17 | 8:37:46.77 | 19:16:02.03 | 6.75∗ | 6.76∗ | 6.170.01 | 6.120.01 | 24.79 0.26 | N/A | N/A | 14 | 08374675+1916020 |
| 18 | 8:37:47.30 | 19:06:24.01 | 12.71 | 11.96∗ | 10.200.02 | 10.070.07 | 0.65 0.04 | -35.60 | -15.10 | 299 | 08374739+1906247 |
| 19 | 8:37:49.99 | 19:53:28.75 | 11.78∗ | 11.13 | 9.330.02 | 9.100.04 | 1.59 0.05 | -31.80 | -19.20 | 304 | 08374998+1953287 |
| 20 | 8:37:52.08 | 19:59:13.85 | 11.54 | 11.07 | 9.690.02 | 9.550.04 | 1.05 0.04 | -38.80 | -14.60 | 310 | 08375208+1959138 |
| 21 | 8:37:57.06 | 19:14:09.67 | 12.23 | 11.59 | 10.040.02 | 10.110.09 | 0.63 0.05 | -35.40 | -13.70 | 325 | 08375703+1914103 |
| 22 | 8:38:07.63 | 19:59:16.40 | 12.48 | 11.82 | 9.900.02 | 10.020.07 | 0.68 0.05 | -38.10 | -13.50 | 346 | 08380758+1959163 |
| 23 | 8:38:08.08 | 20:26:20.83 | 12.08∗ | 11.47∗ | 9.930.02 | 10.030.17 | 0.68 0.11 | -36.40 | -14.40 | 347 | 08380808+2026223 |
| 24 | 8:38:14.11 | 19:47:23.82 | 15.56 | 14.17 | 10.910.04 | 10.000.13 | 0.69 0.08 | N/A | N/A | 358 | 08381421+1947234 |
| 25 | 8:38:14.28 | 19:21:55.37 | 11.20 | 10.31 | 9.190.02 | 9.120.03 | 1.56 0.05 | -35.00 | -13.70 | 21 | 08381427+1921552 |
| 26 | 8:38:23.16 | 20:12:26.60 | 8.01∗ | 7.71∗ | 6.650.01 | 6.640.01 | 15.37 0.13 | N/A | N/A | - | 08382311+2012263 |
| 27 | 8:38:24.31 | 20:06:21.92 | 10.80 | 10.40 | 9.180.02 | 9.230.03 | 1.41 0.04 | -36.30 | -13.10 | 24 | 08382429+2006217 |
| 28 | 8:38:29.70 | 19:51:45.83 | 14.67∗ | 13.53 | 10.930.02 | 10.560.14 | 0.41 0.06 | -40.10 | -13.20 | 27 | 08382963+1951450 |
| 29 | 8:38:32.18 | 19:27:55.04 | 10.46∗ | 9.65 | 7.540.01 | 7.460.01 | 7.18 0.08 | N/A | N/A | - | 08383216+1927548 |
| 30 | 8:38:34.27 | 19:51:36.90 | 9.68 | 8.87 | 6.690.01 | 6.660.01 | 15.03 0.18 | N/A | N/A | - | 08383425+1951369 |
| 31 | 8:38:37.43 | 19:01:14.81 | 14.45 | 13.27 | 10.610.01 | 10.160.18 | 0.60 0.10 | -37.70 | -6.80 | 394 | 08383723+1901161 |
| 32 | 8:38:37.78 | 19:38:47.69 | 10.73∗ | 10.43 | 9.220.02 | 9.240.05 | 1.40 0.06 | N/A | N/A | - | 08383776+1938480 |
| 33 | 8:38:37.88 | 19:59:23.14 | 8.16∗ | 8.16∗ | 7.610.01 | 7.640.02 | 6.08 0.08 | -37.40 | -13.60 | 35 | 08383786+1959231 |
| 34 | 8:38:46.97 | 19:30:03.53 | 9.08 | 8.95 | 8.220.02 | 8.080.02 | 4.06 0.06 | -34.80 | -12.60 | 37 | 08384695+1930033 |
| 35 | 8:38:50.05 | 20:04:03.29 | 11.01 | 10.64 | 9.370.02 | 9.280.03 | 1.35 0.03 | -36.60 | -15.40 | 423 | 08385001+2004035 |
| 36 | 8:38:53.57 | 19:34:17.90 | 14.82∗ | 13.53∗ | 10.960.02 | 10.920.17 | 0.30 0.05 | -40.90 | -21.30 | 432 | 08385354+1934170 |
| 37 | 8:38:55.07 | 19:11:54.02 | 10.84 | 9.87 | 8.040.01 | 7.900.02 | 4.81 0.08 | N/A | N/A | - | 08385506+1911539 |
| 38 | 8:39:01.89 | 20:00:19.62 | 12.48∗ | 11.45∗ | 9.070.02 | 8.960.03 | 1.80 0.05 | N/A | N/A | - | 08390185+2000194 |
| 39 | 8:39:02.27 | 19:19:35.36 | 12.83 | 12.06 | 10.260.02 | 10.200.08 | 0.57 0.04 | -36.60 | -10.50 | 448 | 08390228+1919343 |
| 40 | 8:39:02.84 | 19:43:28.99 | 9.48 | 9.19∗ | 8.120.01 | 8.080.02 | 4.06 0.06 | -35.80 | -11.20 | 46 | 08390283+1943289 |
| 41 | 8:39:03.24 | 20:02:35.12 | 15.18 | 13.86 | 11.050.02 | 10.880.13 | 0.31 0.04 | -40.70 | -14.30 | 47 | 08390321+2002376 |
| 42 | 8:39:03.60 | 19:59:59.24 | 8.33∗ | 8.32∗ | 7.770.01 | 7.710.02 | 5.69 0.09 | -34.20 | -13.30 | 48 | 08390359+1959591 |
| 43 | 8:39:04.09 | 19:31:23.20 | 14.40 | 13.28 | 10.860.01 | 10.460.13 | 0.45 0.05 | -37.00 | -14.60 | 450 | 08390411+1931216 |
| 44 | 8:39:05.25 | 20:07:01.92 | 9.51 | 9.31∗ | 8.410.02 | 8.380.03 | 3.09 0.07 | -35.70 | -12.10 | 49 | 08390523+2007018 |
| 45 | 8:39:06.12 | 19:40:36.59 | 7.48∗ | 7.43∗ | 6.710.01 | 6.730.01 | 14.03 0.17 | N/A | N/A | 50 | 08390612+1940364 |
| 46 | 8:39:06.55 | 19:00:36.68 | 13.83 | 13.09 | 11.300.02 | 11.160.30 | 0.24 0.07 | N/A | N/A | 457 | 08390649+1900360 |
| 47 | 8:39:09.11 | 19:35:32.68 | 8.54∗ | 8.49∗ | 7.880.02 | 7.870.03 | 4.93 0.12 | -35.30 | -12.00 | 52 | 08390909+1935327 |
| 48 | 8:39:10.15 | 19:40:42.56 | 9.55∗ | 9.32∗ | 8.410.01 | 8.400.02 | 3.03 0.04 | -36.10 | -13.70 | 54 | 08391014+1940423 |
| 49 | 8:39:12.20 | 19:06:56.45 | 10.86 | 10.41 | 9.260.02 | 9.180.05 | 1.47 0.07 | -37.00 | -13.40 | 57 | 08391217+1906561 |
| 50 | 8:39:15.05 | 20:12:39.35 | 11.61 | 11.13 | 9.650.02 | 9.630.06 | 0.97 0.05 | -35.20 | -14.70 | 477 | 08391499+2012388 |
| 51 | 8:39:19.77 | 20:03:10.91 | 9.78 | 8.97 | 7.080.01 | 7.020.01 | 10.80 0.14 | N/A | N/A | - | 08391972+2003107 |
| 52 | 8:39:21.88 | 19:51:40.86 | 12.97∗ | 12.20 | 10.370.02 | 10.070.10 | 0.65 0.06 | -36.40 | -8.80 | 65 | 08392185+1951402 |
| 53 | 8:39:24.99 | 19:27:33.70 | 10.75 | 10.01 | 9.000.01 | 8.890.03 | 1.92 0.04 | -37.00 | -14.90 | 66 | 08392498+1927336 |
| 54 | 8:39:28.63 | 19:28:25.00 | 12.07∗ | 11.32∗ | 9.530.02 | 9.400.05 | 1.21 0.06 | -36.10 | -10.80 | 506 | 08392858+1928251 |
| 55 | 8:39:29.42 | 19:47:11.51 | 13.09∗ | 12.29 | 10.060.01 | 9.940.22 | 0.73 0.14 | -38.90 | -9.00 | 69 | 08392940+1947118 |
| 56 | 8:39:30.44 | 20:04:08.69 | 10.68∗ | 10.11 | 8.810.01 | 8.740.02 | 2.22 0.03 | -35.80 | -13.40 | 70 | 08393042+2004087 |
| 57 | 8:39:33.44 | 20:10:10.52 | 9.79 | 8.67 | 6.130.01 | 6.000.02 | 27.56 0.38 | N/A | N/A | - | 08393342+2010102 |
| 58 | 8:39:36.35 | 19:15:39.67 | 15.10∗ | 13.87 | 11.010.02 | 10.490.12 | 0.44 0.05 | -33.30 | -24.60 | 523 | 08393643+1915378 |
| 59 | 8:39:38.29 | 19:26:26.02 | 13.13 | 12.28 | 10.290.02 | 10.220.09 | 0.57 0.04 | -33.00 | -9.60 | 77 | 08393836+1926272 |
| 60 | 8:39:42.66 | 19:46:42.49 | 6.69∗ | 6.65∗ | 6.000.01 | 5.980.01 | 28.02 0.37 | N/A | N/A | 79 | 08394265+1946425 |
| 61 | 8:39:42.81 | 20:05:10.46 | 7.75∗ | 7.73∗ | 7.160.01 | 7.160.03 | 9.47 0.23 | N/A | N/A | 80 | 08394279+2005103 |
| 62 | 8:39:43.35 | 19:25:10.52 | 12.27 | 10.86 | 7.900.02 | 7.760.01 | 5.44 0.06 | N/A | N/A | - | 08394333+1925121 |
| 63 | 8:39:44.68 | 19:16:30.94 | 7.68∗ | 7.69∗ | 7.0910.00 | 7.150.01 | 9.53 0.10 | N/A | N/A | 82 | 08394466+1916308 |
| 64 | 8:39:45.78 | 19:22:01.06 | 10.93 | 10.50 | 9.260.02 | 9.390.04 | 1.21 0.05 | -35.40 | -12.80 | 83 | 08394575+1922011 |
| 65 | 8:39:50.74 | 19:32:26.92 | 7.06∗ | 6.26∗ | 4.390.04 | 4.320.01 | 129.25 1.24 | N/A | N/A | 86 | 08395072+1932269 |
| 66 | 8:39:50.86 | 19:33:02.23 | 12.15∗ | 11.56∗ | 10.000.02 | 9.770.06 | 0.86 0.05 | -36.10 | -13.90 | 87 | 08395084+1933020 |
| 67 | 8:39:52.35 | 19:18:45.61 | 10.68 | 10.07 | 9.010.02 | 8.900.03 | 1.91 0.05 | -34.80 | -14.30 | 89 | 08395234+1918455 |
| 68 | 8:39:55.08 | 20:03:54.47 | 10.37 | 10.02 | 8.960.02 | 8.860.04 | 1.99 0.07 | -37.50 | -13.90 | 93 | 08395506+2003541 |
| 69 | 8:39:56.51 | 19:33:10.91 | 7.32∗ | 7.33∗ | 6.790.01 | 6.820.01 | 12.99 0.15 | N/A | N/A | 94 | 08395649+1933107 |
| 70 | 8:39:57.78 | 19:32:29.26 | 7.58∗ | 7.53∗ | 7.010.02 | 7.010.01 | 10.84 0.09 | N/A | N/A | 96 | 08395777+1932293 |
| 71 | 8:39:58.09 | 19:12:05.98 | 9.71 | 9.38 | 8.480.02 | 8.360.02 | 3.15 0.07 | -37.40 | -12.50 | 97 | 08395807+1912058 |
| 72 | 8:39:58.40 | 20:09:29.99 | 8.71 | 8.86 | 8.100.01 | 8.030.07 | 4.26 0.28 | -36.00 | -13.80 | 98 | 08395838+2009298 |
| 73 | 8:39:59.10 | 20:01:53.15 | 9.35 | 9.15 | 8.210.02 | 8.220.01 | 3.56 0.05 | -36.40 | -16.20 | 99 | 08395908+2001532 |
| 74 | 8:39:59.19 | 19:40:08.58 | 9.86 | 9.69 | 8.780.02 | 8.730.03 | 2.24 0.06 | N/A | N/A | - | 08395915+1940083 |
| 75 | 8:39:59.58 | 18:56:35.30 | 10.08∗ | 9.95 | 9.300.01 | 9.320.05 | 1.29 0.06 | N/A | N/A | - | 08395957+1856357 |
| 76 | 8:39:59.84 | number19:34:00.55 | 12.41∗ | 11.57∗ | 9.480.02 | 9.310.04 | 1.31 0.05 | -33.80 | -12.20 | 565 | 08395983+1934003 |
| 77 | 8:40:00.01 | 19:34:39.86 | 13.35∗ | 12.51∗ | 10.550.02 | 10.200.06 | 0.57 0.03 | -39.40 | -4.20 | 100 | 08395998+1934405 |
| 78 | 8:40:00.64 | 19:48:23.44 | 10.49∗ | 10.17∗ | 9.080.02 | 8.970.03 | 1.80 0.05 | -36.30 | -13.10 | 101 | 08400062+1948235 |
| 79 | 8:40:01.32 | 20:08:08.38 | 9.82∗ | 9.57∗ | 8.620.01 | 8.530.02 | 2.67 0.05 | -36.00 | -14.50 | 102 | 08400130+2008082 |
| 80 | 8:40:01.72 | 18:59:59.17 | 10.47 | 9.93 | 8.700.02 | 8.480.03 | 2.81 0.07 | -36.50 | -11.70 | 103 | 08400171+1859595 |
| 81 | 8:40:04.20 | 19:47:04.24 | 12.11 | 11.54 | 10.000.02 | 10.050.10 | 0.66 0.06 | -33.00 | -13.70 | 576 | 08400416+1947039 |
| 82 | 8:40:04.92 | 19:43:45.48 | 9.95 | 9.67 | 8.650.02 | 8.540.03 | 2.65 0.06 | -36.10 | -12.50 | 106 | 08400491+1943452 |
| 83 | 8:40:05.70 | 19:01:30.18 | 13.20 | 12.31 | 10.010.02 | 9.900.07 | 0.76 0.05 | -35.70 | -12.20 | 578 | 08400571+1901307 |
| 84 | 8:40:06.28 | 19:27:14.80 | 10.55 | 10.10 | 8.870.02 | 8.800.03 | 2.10 0.05 | N/A | N/A | - | 08400627+1927148 |
| 85 | 8:40:06.37 | 19:18:26.46 | 11.58∗ | 10.76 | 9.230.02 | 9.230.03 | 1.40 0.04 | -34.30 | -14.70 | 582 | 08400635+1918264 |
| 86 | 8:40:06.44 | 20:00:28.12 | 6.88∗ | 6.06∗ | 4.200.02 | 4.130.01 | 153.97 1.35 | N/A | N/A | 111 | 08400643+2000280 |
| 87 | 8:40:09.74 | 19:37:17.83 | 12.54∗ | 11.71 | 10.130.02 | 10.040.08 | 0.67 0.05 | -33.90 | -10.50 | 114 | 08400968+1937170 |
| 88 | 8:40:11.46 | 19:58:16.21 | 6.78∗ | 6.71 | 6.530.02 | 6.560.01 | 16.42 0.17 | N/A | N/A | 115 | 08401145+1958161 |
| 89 | 8:40:12.32 | 19:38:22.78 | 10.07∗ | 9.79∗ | 8.670.02 | 8.560.03 | 2.62 0.07 | -36.90 | -14.50 | 116 | 08401231+1938222 |
| 90 | 8:40:13.45 | 19:46:45.08 | 13.75∗ | 12.79∗ | 10.640.02 | 10.750.13 | 0.35 0.04 | -31.50 | -14.40 | 117 | 08401345+1946436 |
| 91 | 8:40:15.36 | 19:59:39.66 | 8.88∗ | 8.77∗ | 8.049.99 | 8.030.02 | 4.27 0.06 | -35.80 | -12.30 | 119 | 08401535+1959394 |
| 92 | 8:40:15.59 | 19:27:29.84 | 14.61 | 13.47 | 10.690.02 | 10.520.12 | 0.43 0.05 | -36.30 | -8.50 | 601 | 08401549+1927310 |
| 93 | 8:40:15.72 | 19:54:54.07 | 13.15 | 12.29 | 10.010.02 | 9.920.06 | 0.75 0.04 | -38.00 | -13.20 | 120 | 08401571+1954542 |
| 94 | 8:40:17.63 | 19:47:15.14 | 10.20 | 9.73∗ | 8.580.02 | 8.600.03 | 2.52 0.07 | -35.50 | -13.60 | 122 | 08401762+1947152 |
| 95 | 8:40:18.10 | 19:31:55.13 | 7.52∗ | 7.57∗ | 7.160.01 | 7.180.01 | 9.34 0.08 | N/A | N/A | 123 | 08401810+1931552 |
| 96 | 8:40:18.97 | 20:11:31.16 | 13.59 | 12.38∗ | 10.040.01 | 9.710.06 | 0.90 0.05 | -37.40 | -14.00 | 607 | 08401893+2011307 |
| 97 | 8:40:20.16 | 19:20:56.44 | 6.83∗ | 6.77∗ | 6.040.01 | 6.010.01 | 27.23 0.31 | N/A | N/A | 125 | 08402013+1920564 |
| 98 | 8:40:20.75 | 19:41:12.23 | 7.68∗ | 7.69∗ | 7.280.02 | 7.300.01 | 8.36 0.11 | N/A | N/A | 127 | 08402075+1941120 |
| 99 | 8:40:22.09 | 19:40:11.82 | 6.95∗ | 6.08∗ | 4.180.03 | 4.070.01 | 162.87 1.71 | N/A | N/A | 128 | 08402209+1940116 |
| 100 | 8:40:22.33 | 20:06:24.88 | 10.26 | 9.97 | 8.850.01 | 8.640.03 | 2.43 0.06 | -36.60 | -12.20 | 129 | 08402231+2006243 |
| 101 | 8:40:22.73 | 19:27:53.46 | 10.94∗ | 10.53∗ | 9.340.02 | 9.250.04 | 1.39 0.05 | -37.80 | -13.30 | 131 | 08402271+1927531 |
| 102 | 8:40:23.29 | 19:40:23.95 | 10.61∗ | 10.20∗ | 9.010.02 | 9.010.03 | 1.73 0.04 | -37.00 | -11.80 | 132 | 08402327+1940236 |
| 103 | 8:40:23.48 | 19:50:06.04 | 8.09∗ | 8.04 | 7.590.01 | 7.550.02 | 6.65 0.10 | N/A | N/A | 133 | 08402347+1950059 |
| 104 | 8:40:25.55 | 19:28:32.92 | 9.75 | 9.37 | 8.760.02 | 8.710.03 | 2.28 0.06 | -36.80 | -13.30 | 134 | 08402554+1928328 |
| 105 | 8:40:26.14 | 19:41:11.33 | 9.50∗ | 9.27∗ | 8.370.02 | 8.280.02 | 3.37 0.05 | -37.20 | -11.90 | 135 | 08402614+1941111 |
| 106 | 8:40:26.30 | 19:13:11.06 | 13.40 | 12.50 | 10.460.02 | 10.560.13 | 0.42 0.05 | -38.40 | -7.00 | 624 | 08402624+1913099 |
| 107 | 8:40:26.76 | 20:10:55.34 | 8.27∗ | 8.17∗ | 7.430.01 | 7.380.01 | 7.73 0.09 | N/A | N/A | 136 | 08402675+2010552 |
| 108 | 8:40:27.03 | 19:32:41.42 | 6.27∗ | 6.31∗ | 5.880.01 | 5.920.01 | 29.83 0.29 | N/A | N/A | 137 | 08402702+1932415 |
| 109 | 8:40:27.46 | 19:16:40.87 | 11.45 | 10.96∗ | 9.650.02 | 9.580.04 | 1.02 0.04 | -33.30 | -12.10 | 628 | 08402743+1916409 |
| 110 | 8:40:27.52 | 19:39:20.05 | 13.77∗ | 12.83 | 10.690.02 | 10.840.12 | 0.32 0.04 | -33.40 | -12.20 | 138 | 08402751+1939197 |
| 111 | 8:40:28.68 | 20:18:44.86 | 12.04∗ | 11.35 | 9.460.02 | 9.420.07 | 1.18 0.07 | -37.40 | -15.90 | 631 | 08402863+2018449 |
| 112 | 8:40:31.72 | 19:51:01.84 | 11.98∗ | 11.38∗ | 9.910.02 | 9.720.09 | 0.90 0.07 | -35.60 | -12.90 | 640 | 08403169+1951010 |
| 113 | 8:40:31.85 | 20:12:5.98 | 11.85∗ | 11.28 | 9.830.01 | 9.810.06 | 0.83 0.04 | -36.40 | -13.90 | 641 | 08403184+2012060 |
| 114 | 8:40:32.97 | 19:11:39.59 | 8.72 | 8.55∗ | 7.960.00 | 7.820.02 | 5.16 0.10 | -37.40 | -14.20 | 141 | 08403296+1911395 |
| 115 | 8:40:33.48 | 19:38:00.42 | 12.63∗ | 11.91∗ | 10.170.02 | 10.050.08 | 0.66 0.05 | -38.90 | -10.60 | 142 | 08403347+1938009 |
| 116 | 8:40:39.25 | 19:13:41.88 | 7.82∗ | 7.80∗ | 7.230.01 | 7.250.01 | 8.73 0.10 | N/A | N/A | 150 | 08403924+1913418 |
| 117 | 8:40:39.94 | 19:40:09.37 | 11.44∗ | 10.66 | 9.190.02 | 9.180.03 | 1.47 0.05 | -35.50 | -11.30 | 151 | 08403992+1940092 |
| 118 | 8:40:41.91 | 19:13:25.68 | 10.86∗ | 10.43∗ | 9.060.02 | 9.040.03 | 1.68 0.04 | -35.90 | -13.00 | 153 | 08404189+1913255 |
| 119 | 8:40:42.51 | 19:33:57.85 | 11.66∗ | 11.11∗ | 9.710.02 | 9.690.04 | 0.92 0.04 | -36.70 | -13.80 | 154 | 08404248+1933576 |
| 120 | 8:40:43.22 | 19:43:09.62 | 7.07∗ | 6.85 | 6.330.01 | 6.330.01 | 20.45 0.14 | N/A | N/A | 156 | 08404321+1943095 |
| 121 | 8:40:46.09 | 19:18:34.67 | 9.79 | 9.45 | 8.530.02 | 8.490.02 | 2.79 0.05 | -37.10 | -13.20 | 158 | 08404608+1918346 |
| 122 | 8:40:47.23 | 19:32:37.64 | 10.87 | 10.08 | 8.200.01 | 8.100.01 | 3.99 0.05 | N/A | N/A | - | 08404720+1932373 |
| 123 | 8:40:48.01 | 19:39:31.57 | 11.56 | 10.79 | 9.250.02 | 9.250.03 | 1.39 0.04 | -37.60 | -14.50 | 161 | 08404798+1939321 |
| 124 | 8:40:48.32 | 19:55:19.02 | 11.29 | 10.86 | 9.510.02 | 9.500.04 | 1.10 0.04 | -35.50 | -13.00 | 162 | 08404832+1955189 |
| 125 | 8:40:52.52 | 20:15:59.87 | 8.52 | 8.47∗ | 7.800.01 | 7.780.02 | 5.36 0.08 | -34.60 | -12.70 | 166 | 08405247+2015594 |
| 126 | 8:40:52.53 | 19:28:59.77 | 10.55 | 10.15 | 9.050.02 | 8.970.03 | 1.79 0.05 | -37.00 | -13.20 | 167 | 08405252+1928595 |
| 127 | 8:40:54.93 | 19:56:06.25 | 12.50∗ | 11.80∗ | 10.130.02 | 10.160.09 | 0.60 0.05 | -37.20 | -14.90 | 677 | 08405487+1956067 |
| 128 | 8:40:56.29 | 19:34:49.26 | 6.76∗ | 6.79∗ | 6.280.01 | 6.280.01 | 21.23 0.28 | N/A | N/A | 170 | 08405630+1934492 |
| 129 | 8:40:56.76 | 19:44:05.50 | 12.64∗ | 11.94∗ | 10.210.02 | 10.130.11 | 0.61 0.06 | -36.10 | -11.10 | 171 | 08405669+1944052 |
| 130 | 8:40:56.95 | 19:56:05.57 | 8.79∗ | 8.67∗ | 8.050.02 | 7.950.01 | 4.57 0.06 | -36.10 | -15.40 | 172 | 08405693+1956055 |
| 131 | 8:41:04.79 | 19:31:22.94 | 11.35 | 10.60 | 8.750.02 | 8.680.03 | 2.33 0.06 | N/A | N/A | - | 08410478+1931225 |
| 132 | 8:41:07.34 | 19:26:48.08 | 13.01 | 12.12 | 10.290.02 | 10.300.20 | 0.53 0.09 | -43.70 | -8.10 | 176 | 08410725+1926489 |
| 133 | 8:41:07.39 | 19:04:16.43 | 10.56 | 10.04 | 8.640.02 | 8.530.03 | 2.68 0.06 | -39.90 | -14.10 | 177 | 08410737+1904164 |
| 134 | 8:41:09.61 | 19:51:18.32 | 11.01∗ | 10.50∗ | 8.940.02 | 8.610.03 | 2.48 0.06 | -36.70 | -13.90 | 179 | 08410961+1951186 |
| 135 | 8:41:09.82 | 19:56:07.04 | 14.26∗ | 13.19 | 10.760.02 | 10.670.10 | 0.37 0.04 | -42.40 | -15.10 | 180 | 08410979+1956072 |
| 136 | 8:41:10.02 | 19:30:32.18 | 10.35∗ | 9.98 | 8.910.02 | 8.830.13 | 2.04 0.23 | -36.90 | -12.00 | 182 | 08411002+1930322 |
| 137 | 8:41:10.32 | 19:49:07.10 | 11.84∗ | 11.29∗ | 9.750.02 | 9.620.05 | 0.98 0.04 | -36.50 | -13.20 | 183 | 08411031+1949071 |
| 138 | 8:41:10.70 | 19:49:46.38 | 9.06 | 8.86 | 8.190.01 | 8.190.02 | 3.66 0.06 | -37.80 | -13.70 | 184 | 08411067+1949465 |
| 139 | 8:41:13.04 | 19:32:34.26 | 15.06 | 13.73 | 10.350.02 | 10.220.08 | 0.56 0.05 | -37.60 | -9.70 | 709 | 08411319+1932349 |
| 140 | 8:41:13.80 | 19:55:19.24 | 8.35∗ | 8.35∗ | 7.770.01 | 7.690.02 | 5.82 0.09 | -36.90 | -12.60 | 188 | 08411377+1955191 |
| 141 | 8:41:15.43 | 20:02:15.04 | 14.99∗ | 13.78∗ | 11.020.02 | 10.790.11 | 0.34 0.03 | -37.30 | -11.90 | 189 | 08411541+2002160 |
| 142 | 8:41:16.04 | 19:44:54.13 | 14.06 | 13.44 | 11.710.02 | 10.500.09 | 0.44 0.03 | N/A | N/A | 190 | 08411602+1944514 |
| 143 | 8:41:18.42 | 19:15:39.38 | 7.95∗ | 7.90∗ | 7.290.02 | 7.040.01 | 10.61 0.12 | -37.40 | -12.90 | 192 | 08411840+1915394 |
| 144 | 8:41:19.96 | 19:38:04.20 | 14.20 | 13.09 | 10.760.02 | 10.220.17 | 0.56 0.09 | -36.30 | -12.00 | 721 | 08411992+1938047 |
| 145 | 8:41:22.48 | 18:56:00.17 | 13.49 | 12.60 | 10.540.02 | 10.200.15 | 0.58 0.08 | -34.00 | -9.90 | 726 | 08412258+1856020 |
| 146 | 8:41:23.93 | 20:14:57.30 | 15.46∗ | 14.11∗ | 10.780.02 | 10.110.13 | 0.63 0.08 | N/A | N/A | 194 | 08412390+2014572 |
| 147 | 8:41:25.89 | 19:56:36.85 | 10.92∗ | 10.55 | 9.330.02 | 9.370.04 | 1.24 0.05 | -36.30 | -13.70 | 195 | 08412584+1956369 |
| 148 | 8:41:26.98 | 19:32:32.71 | 10.05 | 9.73∗ | 8.720.02 | 8.790.03 | 2.12 0.06 | -37.30 | -12.40 | 196 | 08412698+1932329 |
| 149 | 8:41:28.65 | 19:44:49.13 | 11.43 | 10.76 | 9.470.02 | 9.440.13 | 1.16 0.14 | -39.00 | -13.50 | 198 | 08412869+1944481 |
| 150 | 8:41:33.89 | 19:58:08.83 | 12.07 | 11.47∗ | 9.930.01 | 9.940.07 | 0.73 0.05 | -39.40 | -14.40 | 201 | 08413384+1958087 |
| 151 | 8:41:35.09 | 19:39:45.04 | 9.17∗ | 8.12 | 5.960.02 | 5.860.01 | 31.26 0.30 | N/A | N/A | - | 08413506+1939449 |
| 152 | 8:41:35.90 | 19:06:25.16 | 14.84 | 13.59 | 10.980.02 | 10.550.11 | 0.42 0.04 | -31.10 | -9.60 | 751 | 08413599+1906255 |
| 153 | 8:41:36.20 | 19:08:33.58 | 9.57 | 9.23 | 8.350.02 | 8.340.02 | 3.21 0.05 | -36.00 | -14.30 | 204 | 08413620+1908335 |
| 154 | 8:41:37.43 | 19:31:13.08 | 14.19 | 13.09 | 10.730.01 | 10.500.14 | 0.44 0.06 | -40.90 | -12.00 | 758 | 08413741+1931140 |
| 155 | 8:41:42.31 | 19:39:37.98 | 9.72∗ | 9.50∗ | 8.480.02 | 8.380.03 | 3.09 0.08 | -37.30 | -13.80 | 206 | 08414229+1939379 |
| 156 | 8:41:43.68 | 19:57:43.85 | 12.73 | 12.05 | 10.260.02 | 10.150.10 | 0.60 0.10 | -40.50 | -13.10 | 769 | 08414368+1957437 |
| 157 | 8:41:43.85 | 20:13:37.06 | 10.69 | 10.34 | 9.140.01 | 8.990.04 | 1.76 0.07 | -37.40 | -15.70 | 771 | 08414382+2013368 |
| 158 | 8:41:45.49 | 19:16:02.17 | 10.35 | 9.98∗ | 8.930.02 | 8.920.03 | 1.88 0.05 | -38.10 | -13.20 | 208 | 08414549+1916023 |
| 159 | 8:41:47.74 | 19:24:43.88 | 11.66∗ | 11.28 | 10.100.02 | 9.960.07 | 0.72 0.05 | -30.30 | -9.50 | - | 08414776+1924439 |
| 160 | 8:41:48.24 | 19:27:30.49 | 14.28∗ | 13.24 | 10.730.01 | 10.620.10 | 0.39 0.04 | -40.80 | -9.80 | 774 | 08414818+1927312 |
| 161 | 8:41:49.34 | 19:11:47.51 | 15.24 | 13.90 | 10.830.01 | 10.550.11 | 0.42 0.04 | -33.90 | -10.80 | 776 | 08414934+1911471 |
| 162 | 8:41:50.09 | 19:52:27.19 | 7.37∗ | 6.56∗ | 4.680.00 | 4.630.01 | 97.51 1.02 | N/A | N/A | 212 | 08415008+1952270 |
| 163 | 8:41:51.98 | 20:10:01.99 | 12.44∗ | 11.76∗ | 10.090.02 | 9.780.08 | 0.85 0.07 | -40.60 | -15.70 | 213 | 08415199+2010013 |
| 164 | 8:41:53.16 | 20:09:34.16 | 8.61∗ | 8.51∗ | 7.790.01 | 7.710.01 | 5.71 0.07 | -38.20 | -13.70 | 214 | 08415314+2009340 |
| 165 | 8:41:54.37 | 19:15:27.14 | 11.65 | 11.03 | 9.640.02 | 9.560.05 | 1.04 0.05 | -34.80 | -13.20 | 215 | 08415437+1915266 |
| 166 | 8:41:55.90 | 19:41:22.96 | 11.39 | 10.86 | 9.540.01 | 9.590.07 | 1.02 0.07 | -37.60 | -12.10 | 217 | 08415587+1941229 |
| 167 | 8:41:57.84 | 18:54:42.08 | 9.66∗ | 9.35 | 8.430.02 | 8.430.03 | 2.94 0.07 | -34.30 | -11.10 | 218 | 08415782+1854422 |
| 168 | 8:41:58.86 | 20:06:26.82 | 13.77∗ | 12.83 | 10.600.01 | 10.320.16 | 0.52 0.08 | -40.30 | -11.80 | 792 | 08415884+2006272 |
| 169 | 8:42:05.50 | 19:35:57.95 | 11.07 | 10.33∗ | 8.380.03 | 8.300.02 | 3.32 0.05 | N/A | N/A | - | 08420547+1935585 |
| 170 | 8:42:06.51 | 19:24:40.72 | 7.96∗ | 7.97∗ | 7.430.02 | 7.390.01 | 7.64 0.06 | -38.40 | -12.10 | 223 | 08420650+1924405 |
| 171 | 8:42:10.79 | 18:56:03.62 | 7.92∗ | 7.93∗ | 7.350.01 | 7.350.02 | 7.95 0.11 | -34.10 | -12.10 | 224 | 08421080+1856037 |
| 172 | 8:42:11.50 | 19:16:36.37 | 12.57∗ | 11.85∗ | 10.170.01 | 9.990.06 | 0.70 0.04 | -37.60 | -10.00 | 817 | 08421149+1916373 |
| 173 | 8:42:12.34 | 19:12:48.20 | 14.32 | 13.20 | 10.830.01 | 10.560.10 | 0.41 0.04 | -33.50 | -9.60 | 822 | 08421233+1912488 |
| 174 | 8:42:12.85 | 19:16:03.79 | 14.10∗ | 13.07 | 10.480.01 | 10.110.06 | 0.63 0.04 | -33.00 | -11.70 | 824 | 08421285+1916040 |
| 175 | 8:42:15.50 | 19:41:15.47 | 10.12 | 9.78 | 8.770.01 | 8.720.02 | 2.24 0.05 | -37.60 | -15.00 | 226 | 08421549+1941156 |
| 176 | 8:42:18.85 | 20:24:36.22 | 12.59 | 11.91 | 10.190.02 | 10.050.12 | 0.66 0.08 | N/A | N/A | 839 | 08421883+2024350 |
| 177 | 8:42:20.16 | 20:02:11.72 | 9.91 | 9.56 | 8.410.02 | 8.400.02 | 3.03 0.06 | -35.70 | -15.60 | 228 | 08422012+2002117 |
| 178 | 8:42:21.62 | 20:10:53.72 | 9.32 | 9.13 | 8.280.01 | 8.130.02 | 3.89 0.06 | -36.80 | -14.40 | 229 | 08422162+2010539 |
| 179 | 8:42:24.74 | 19:35:17.27 | 11.21 | 10.83∗ | 9.480.01 | 9.340.04 | 1.27 0.05 | N/A | N/A | - | 08422471+1935175 |
| 180 | 8:42:32.27 | 19:23:46.25 | 11.38 | 10.84 | 9.460.01 | 9.500.06 | 1.10 0.06 | -36.50 | -12.50 | 232 | 08423225+1923463 |
| 181 | 8:42:40.19 | 19:07:58.87 | 12.55∗ | 11.86∗ | 10.190.01 | 9.830.06 | 0.81 0.04 | -35.30 | -10.90 | 863 | 08424021+1907590 |
| 182 | 8:42:40.73 | 19:32:35.34 | 10.03 | 9.66 | 8.720.02 | 8.670.03 | 2.36 0.07 | -38.40 | -12.70 | 235 | 08424071+1932354 |
| 183 | 8:42:42.51 | 19:05:59.78 | 12.04∗ | 11.38 | 9.880.02 | 9.880.06 | 0.78 0.04 | -37.40 | -13.50 | 236 | 08424250+1905589 |
| 184 | 8:42:43.72 | 19:37:23.52 | 12.76 | 11.76 | 9.800.02 | 9.640.05 | 0.97 0.04 | -36.40 | -14.20 | 868 | 08424372+1937234 |
| 185 | 8:42:44.44 | 19:34:48.11 | 10.09 | 9.53 | 8.630.02 | 8.480.02 | 2.82 0.05 | -38.20 | -13.50 | 238 | 08424441+1934479 |
| 186 | 8:43:00.59 | 20:20:15.79 | 11.76 | 11.24 | 9.770.02 | 9.570.06 | 1.03 0.06 | -37.30 | -16.00 | 887 | 08430055+2020161 |
| 187 | 8:43:05.96 | 19:26:15.36 | 10.25 | 9.65 | 8.460.02 | 8.400.01 | 3.02 0.04 | -36.60 | -13.80 | 248 | 08430593+1926152 |
| 188 | 8:43:08.24 | 19:42:47.59 | 13.92 | 12.89 | 10.670.01 | 10.150.09 | 0.60 0.05 | -33.70 | -11.60 | 899 | 08430822+1942475 |
| 189 | 8:43:10.82 | 19:31:33.64 | 12.20 | 11.58 | 10.010.02 | 10.490.22 | 0.44 0.09 | -38.50 | -17.50 | 902 | 08431076+1931346 |
| 190 | 8:43:20.20 | 19:46:08.58 | 11.05 | 10.62 | 9.360.02 | 9.260.04 | 1.37 0.05 | -39.40 | -13.40 | 255 | 08432019+1946086 |
| 191 | 8:43:32.42 | 19:44:38.00 | 12.92 | 12.01 | 10.220.02 | 9.940.08 | 0.73 0.05 | -40.10 | -16.50 | 919 | 08433239+1944378 |
| 192 | 8:43:35.56 | 20:11:22.63 | 10.29 | 9.99 | 8.920.02 | 8.950.03 | 1.82 0.05 | -39.30 | -14.70 | 257 | 08433553+2011225 |
| 193 | 8:44:07.37 | 20:04:36.23 | 10.30 | 10.05 | 9.060.01 | 8.950.03 | 1.82 0.04 | N/A | N/A | - | 08440734+2004369 |