The ACS Nearby Galaxy Survey Treasury III: Cepheids in the Outer Disk of M81
Abstract
The ACS Nearby Galaxy Survey Treasury (ANGST) has acquired deep ACS imaging of a field in the outer disk of the large spiral galaxy M81. These data were obtained over a total of 20 HST orbits, providing a baseline long enough to reliably identify Cepheid variable stars in the field. Fundamental mode and first overtone types have been distinguished through comparative fits with corresponding Cepheid light curve templates derived from principal component analysis of confirmed Cepheids in the LMC, SMC, and Milky Way. A distance modulus of with a corresponding distance of 3.60 0.23 Mpc has been calculated from a sample of 11 fundamental mode and 2 first overtone Cepheids (assuming an LMC distance modulus of ).
Subject headings:
Cepheids — distance — galaxies: individual (M81)1. Introduction
The ACS Nearby Galaxy Survey Treasury (ANGST) is acquiring resolved stellar photometry with Hubble Space Telescope to determine the star formation history of our local volume of the universe (Dalcanton et al., 2009). The survey includes repeated long exposures for some targets, such as M81, to resolve the faintest stars possible. Having many images of the same field over several epochs makes it possible to identify bright variable stars including Cepheids.
Cepheid variable stars are used widely for extragalactic distance determinations, because of the firm correlation between their period of pulsation and their average absolute magnitude. They are therefore reliable standard candles, and crucial tools for determining the Hubble constant. Other methods commonly used to measure extragalactic distances include the tip of the red giant branch (TRGB) which is often used to calibrate the Cepheid Period-Luminosity (PL) relation and vice versa.
Once variable stars are identified from time-series photometry, the subset of Cepheid variables can be selected in several ways. The most straightforward method is by visual inspection of the light curves, which show a characteristic saw-tooth shape. Other more quantitative methods involve fitting the observed light curve to Cepheid templates (Stetson, 1996; Tanvir et al., 2005). We use the Cepheid light-curve templates and fitting procedure presented in Yoachim et al. (2008). These templates were built by performing principal component analysis (PCA) on a large sample of Galactic Cepheids (Berdnikov & Turner, 1995; Moffett & Barnes, 1984) as well as LMC and SMC stars (Udalski et al., 1999a, b), similar to the procedure of Tanvir et al. (2005).
As M81 is one of the most massive spirals in the Local Volume, there is a long history of attempts to measure its distance (e.g., Hubble, 1929). Ground based observations have resulted in Cepheid distances with large uncertainties of 0.30 (Madore et al., 1993). The Hubble Key Project greatly improved upon previous measurements and reported a distance modulus for M81 of . The Key Project distance was based on 25 long-period Cepheid light curves observed over 18 epochs in a field 1-2 disk scale lengths from the galaxy’s center (Freedman et al., 2001, 1994). There have also been numerous recent studies using the TRGB method (Rizzi et al., 2007; Tikhonov et al., 2005; Dalcanton et al., 2009). The TRGB has the advantage of not requiring multiple epochs of data to calculate a distance, but is still a tertiary distance indicator relying on calibration from Cepheids or other distance measurements.
In this paper, we show that accurate distances can now be calculated using sparsely sampled short-period Cepheids without an observing campaign optimized for time sampling. This advance is made possible by the combination of high-accuracy photometry from HST/ACS combined with template light curves. Moreover, in this study we use an outer disk-field which should have substantially less extinction and crowding than previous studies. In Section 2, we describe our observations and data reduction techniques. In Sections 3 and 4, we isolate Cepheid variables and use them in distance calculations. We include relevant tables and light curves in an Appendix.
2. Observations and Data Reduction
| File Name | Date | UT | Filter | (sec) |
|---|---|---|---|---|
| j9ra58tpq_flt.fits | 2006-11-17 | 18:43:34 | F606W | 2708 |
| j9ra58tqq_flt.fits | 2006-11-17 | 20:17:17 | F814W | 2735 |
| j9ra59tuq_flt.fits | 2006-11-17 | 21:59:17 | F606W | 2468 |
| j9ra59tyq_flt.fits | 2006-11-17 | 23:33:01 | F814W | 2495 |
| j9ra60o9q_flt.fits | 2006-11-16 | 18:45:42 | F606W | 2708 |
| j9ra60oaq_flt.fits | 2006-11-16 | 20:19:15 | F814W | 2735 |
| j9ra61ojq_flt.fits | 2006-11-16 | 23:33:16 | F606W | 2708 |
| j9ra61okq_flt.fits | 2006-11-17 | 01:06:51 | F814W | 2735 |
| j9ra62wvq_flt.fits | 2006-11-18 | 18:41:25 | F606W | 2708 |
| j9ra62wwq_flt.fits | 2006-11-18 | 20:15:16 | F814W | 2735 |
| j9ra63wzq_flt.fits | 2006-11-18 | 21:53:08 | F606W | 2708 |
| j9ra63x0q_flt.fits | 2006-11-18 | 23:27:00 | F814W | 2735 |
| j9ra64n7q_flt.fits | 2006-11-22 | 21:44:10 | F606W | 2708 |
| j9ra64n8q_flt.fits | 2006-11-22 | 23:18:47 | F814W | 2735 |
| j9ra65dtq_flt.fits | 2006-11-20 | 13:49:06 | F606W | 2708 |
| j9ra65duq_flt.fits | 2006-11-20 | 15:23:36 | F814W | 2735 |
| j9ra66ebq_flt.fits | 2006-11-20 | 21:48:23 | F606W | 2708 |
| j9ra66ecq_flt.fits | 2006-11-20 | 23:22:54 | F814W | 2735 |
| j9ra67e1q_flt.fits | 2006-11-20 | 17:00:49 | F814W | 2708 |
| j9ra67e2q_flt.fits | 2006-11-20 | 18:34:44 | F814W | 2770 |

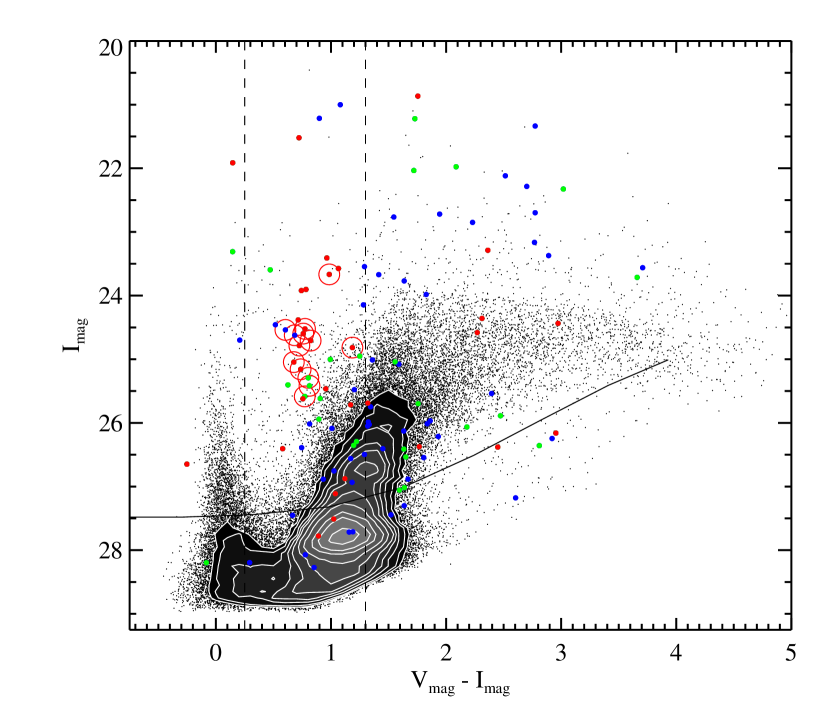
All photometry was taken from the ANGST data products (Dalcanton et al., 2009; Williams et al., 2009). Our full observation log is listed in Table 1, while the ACS target field is shown in Figure 1. ANGST data products came from the package DOLPHOT (Dolphin, 2000) which includes single frame magnitudes, combined magnitudes, data quality, and errors for each star in the field. Standard Johnson-Cousins and magnitudes were produced by DOLPHOT which were transformed from F606W and F814W passbands using Sirianni et al. (2005). Catalogs were limited to high quality stellar photometry based on combined and signal-to-noise, sharpness, and crowding. Only those stars that were resolved in every individual frame were carried through for variability index determination. The 50% completeness limit of an individual image was 27.5 mag for and 28.6 mag for and is indicated on the color magnitude diagram for the co-added data in Fig 2.
The magnitude errors returned by DOLPHOT are extremely small. They accurately reflect photon counting errors, but do not include systematic errors due to blending. To assess the empirical errors, we made use of artificial star tests (Williams et al., 2009). Millions of artificial stars with known input magnitudes were inserted into each of the ACS science images. The images were then reprocessed through DOLPHOT. The same quality cuts of S/N, sharpness, and crowding were applied as for the real stars. The cataloged uncertainty for each star has been updated with the standard deviation of the difference between comparable artificial stars’ input and output magnitudes. These “comparable” artificial stars were selected within a 100x100 pixel region centered on the real star and within a 0.2 magnitude range. The new errors generated for individual frame magnitudes using this method are slightly larger than the original magnitudes directly produced by DOLPHOT.
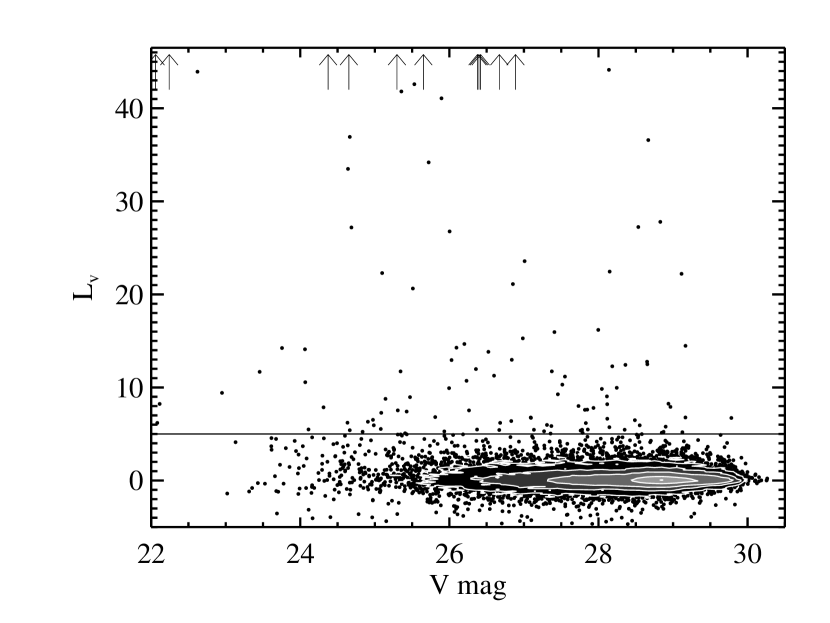
Identification of likely variables was performed by calculating a Welch & Stetson (1993) variability index for each star. Residuals from weighted averages of each star’s magnitude in each filter were used to calculate an overall variability index given by,
| (1) |
where and are the normalized magnitude residuals in and . Figure 3 shows the variability index for the stars detected in the field. Stars with a high variability index are marked on the full color magnitude diagram (Figure 2). Many variables form a well defined instability strip, along with a population of likely luminous red variables.
3. Cepheid Selection Criteria
We attempted to fit the Cepheid light curve templates detailed in Yoachim et al. (2008) to the individual frame magnitude data for the 114 stars with a variability index greater than five. The 114 stars were run through two passes of the Cepheid light curve template fitting procedure, once attempting fits to a short period fundamental mode template and once attempting fits to a first overtone template.
Cepheid light-curve templates were derived from principal component analysis of Galactic Cepheids (Berdnikov & Turner, 1995; Moffett & Barnes, 1984) as well as LMC and SMC stars (Udalski et al., 1999a, b) similar to the procedure used in Tanvir et al. (2005). Unlike previous studies, Yoachim et al. (2008) generate templates for short period (10 days) and overtone Cepheids. Normally, it would take approximately 20 parameters to accurately fit a well sampled variable star light curve using a Fourier decomposition. By using PCA, we can reduce the dimensionality of the problem and generate accurate light curves with only four free parameters ( and magnitudes, period, and phase).
We combine the PCA light curve templates with a Levenberg-Marquardt least-squares fitting routine111The Marquardt least-squares fitting routine can be found at http://cow.physics.wisc.edu/craigm/idl/fitting.html that returns the best fitting periods and magnitudes along with uncertainties. Light-curve data in both filters from all of the flagged variables were run though the least-squares procedure with the Cepheid templates. We ran the fitting procedure with a variety of initial guess parameters to ensure we converged on the global minimum.
| Selection Criteria | FU | FO |
|---|---|---|
| Initial Number | 114 | 114 |
| 1. /dof 7……………….. | 64 | 54 |
| 2. ….. | 34 | 22 |
| 3. ……………….. | 25 | n/a |
| 4. ……………. | n/a | 15 |
The best Cepheid light curve fits were determined for each of the 114 stars with an . For fundamental mode template fits the number of candidate Cepheids was reduced to 64 by accepting only high quality fits with a maximum of 7. Cuts based on position on the color magnitude diagram were also applied to further segregate true Cepheids. A conservative color boundary of 1.3 ensured that only those stars that lie within the instability strip were included. This further reduced our number of possible fundamental Cepheids to 34. Of these, only variables with a period range of 1-10 days were retained. Tests show that our template fitting procedure is only accurate if a substantial portion of the full Cepheid phase is observed. Because our observations span only a 6.19 day baseline, we reject any fit that converges on 10 or more days as unreliable reducing the number of candidates to 25. We clearly detect several long period Cepheids in the field, but can only constrain their periods to within a few days, making them unsuitable for distance determinations. Similar selection criteria were applied to the first overtone template fits with the only difference being the requirement that the period fall within days. This acceptance range was based on data on first overtone Cepheids in the LMC from the OGLE Cepheid study (Udalski et al., 1999a). After applying our full set of selection criteria, we had 29 stars remaining. Of these remaining candidates, we found 25 could be well fit with fundamental mode templates and 15 could be well fit with overtone templates. Results of these selection criteria are summarized in Table 2.
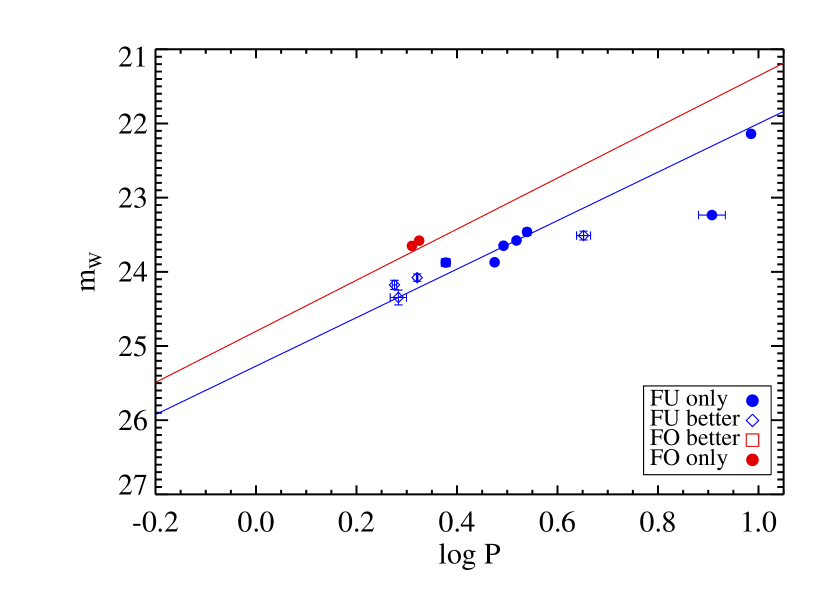
We compute reddening-free apparent magnitudes (Madore, 1982) for all our candidate stars and plot an initial period-luminosity relation in Figure 4. As was expected, many Cepheid candidates passed all of the selection criteria for the fundamental mode type and for both the first overtone type. Those that passed both sets of criteria were sorted into two additional categories: those that have a better fit to the fundamental light curve template and those that have a better fit to the first overtone light curve template. Some candidates were so close in their fits to both templates that it was not possible to distinguish the type; these seven candidates were removed from the list for being indistinguishable.

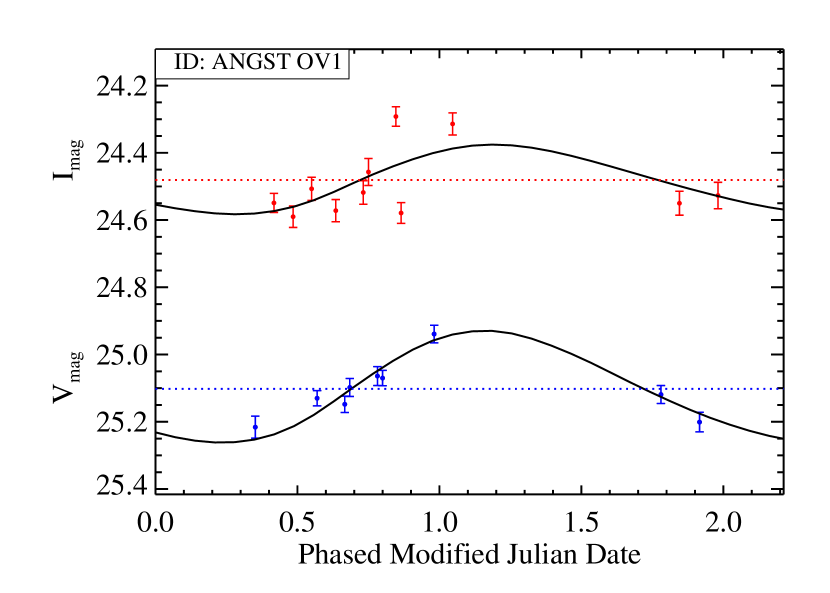
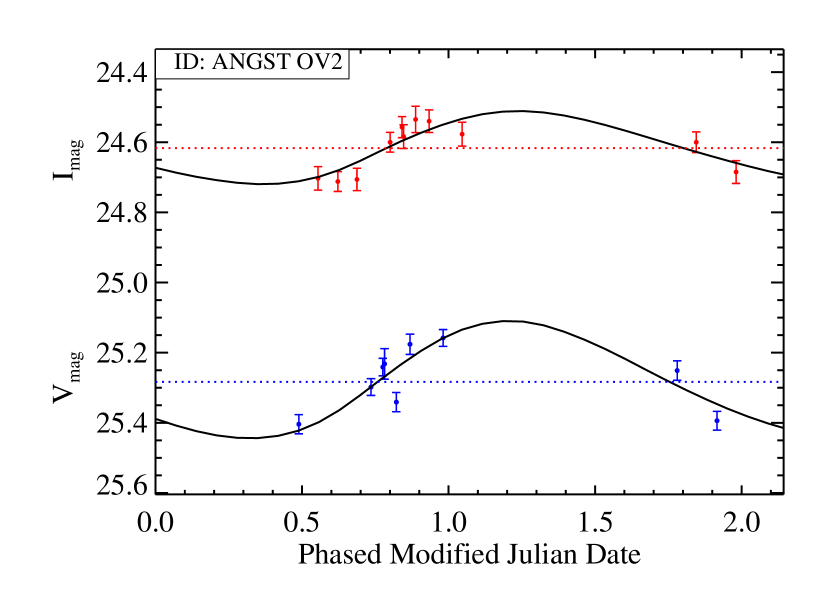
Of the remaining Cepheid candidates, visual inspection of the light curves was used to make the final quality cut. Nine additional candidates were removed in this manner. These were typically stars where one or two outliers gave the star the appearance of variability. With all selection criteria and quality cuts applied, 11 likely fundamental mode and 2 likely first overtone Cepheids remain. Figure 5 shows the period-luminosity diagram for these stars. Their locations within M81 are plotted in Figure 1, and they clearly lie on an extension of the inner spiral arm. These final results match well with period-luminosity relations derived from Udalski 1999 with the zero-point adjusted for metallicity and distance modulus to M81. The final fit parameters and light curves are presented in Figures 8 and 9. The full light-curve photometry points are provided in Tables 6 & 7.
4. Period Luminosity Relations and Distance Calculations
We assume the period-luminosity (-) relations and errors for standard and magnitudes derived from recent OGLE Cepheid studies of the LMC (Udalski et al., 1999a)222Updated OGLE Cepheid PL relations can be found at ftp://sirius.astrouw.edu.pl/ogle/ogle2/var_stars/lmc/cep
/catalog/README.PL.. We have several reasons for using the LMC derived - relation over other popular - relations (e.g., Freedman et al., 2001; Sandage et al., 2004; Benedict et al., 2007). First, The OGLE studies include overtone - relations. Second, the OGLE sample is dominated by short-period stars, like those in our study, and it is not clear that - relations derived from long period stars can be accurately extrapolated, as there is a possible discontinuity in the - relation around a period of ten days (Kanbur & Ngeow, 2004). Finally, because our observations are in an outer field of M81, we expect a fairly good match between our Cepheid metallicities and those in the LMC, meaning we only need to make a very small metallicity adjustment to the - relation (§4.2). The major disadvantage in using the OGLE - relation is that our distance determination is explicitly tied to the LMC distance, which becomes our dominant source of uncertainty. The adopted - relations are:
Fundamental Mode - Relations
First Overtone - Relations
4.1. Extinction Correction
The presence of intervening dust along the line of sight causes some Cepheids to appear fainter and redder than they would in the absence of extinction, thereby making them appear to be more distant. Dust attenuates the passband more than the passband making distances calculated using the - relation more distant than the ones calculated using the - relation. This effect was observed when single passband distances were calculated in this study.
The effect of reddening can be corrected using the “Wesenheit reddening-free index” (Madore, 1982),
For and photometry the Wesenheit index is defined as . is taken to be 2.45 based on Cardelli et al. (1989) and as used in Macri et al. (2006). The Wesenheit index then becomes for purposes of error propagation. Using this we can write new - relations for the Wesenheit index:
Fundamental Mode
First Overtone
Udalski et al. (1999c) derive their own Wesenheit corrected - relations from least squares fitting to Wesenheit magnitudes. These could have been used directly in this paper, however, they use a slightly different value for R than we have adopted.
4.2. Metallicity Correction
Many Cepheids seem to show a dependence of absolute brightness on metallicity (Macri et al., 2006; Romaniello et al., 2008; Saha et al., 2006; Sandage & Tammann, 2008), such that metal-rich Cepheids are brighter than metal-poor Cepheids of the same pulsation period. We correct the distance moduli for this effect as follows. Zaritsky et al. (1994) measured a metallicity gradient of -0.120.05 dex/ for M81 with a value of [O/H] = 9.100.11 at r=0.8. Assuming our field is located at , the metallicity for the ANGST M81 deep field is [O/H]=12+log(O/H) 8.6. This is consistent with the metallicities derived from AGB bump and red clump from the same field (Williams et al., 2009). Using the metallicity correction of Macri et al. (2006), our Cepheid distance moduli are corrected by
where the “r” and “s” subscripts denote random and systematic uncertainties respectively.
4.3. Distance Modulus to the LMC
The period luminosity relations shown so far are all relative to the Large Magellanic Cloud. In order to adjust the zero point such that a true absolute magnitude for our Cepheids can be calculated, the distance modulus to the LMC must be adopted and subtracted.
We adopt the water maser relative distance between NGC 4258 and the LMC. The discovery of water masers in the active nucleus of NGC 4258 provides a very accurate distance to that galaxy. Using the orbits of these masers, Herrnstein et al. (1999) found a geometric distance to NGC 4258 of . Macri et al. (2006) subsequently observed 281 Cepheids in NGC 4258 and using the OGLE PL relations above, found a relative distance modulus from NGC 4258 to the LMC . Combining these results gives a distance modulus to the LMC of (Macri et al., 2006), which we adopt here.
4.4. Consistency with Previous Cepheid Observations in M81
Freedman et al. (1994) also present HST observations of Cepheids in M81. In Figure 6 we plot the Freedman et al. (1994) Wesenheit magnitudes along with our fundamental mode Cepheids. When we fit the - relations, holding the slope constant at the OGLE LMC value, we find our sample has a zero-point of m while the long-period Cepheids have a zero point of . The Freedman et al. (1994) observations were of an inner region where we would expect the metallicity of the stars to be much higher, and therefore the inner Cepheids should appear brighter. The metallicity gradient measured in Zaritsky et al. (1994) suggests a metallicity difference between our field and the fields of dex, corresponding to an expected zero-point offset of 0.14 mag. Thus we find that the metallicity corrected zero-point offset between the two observations is , consistent with no offset at the 1- level. We point out that this metallicity correction is based on an extrapolation from a slope observed in inner region HII regions. It is conceivable that the Cepheids we observe at large radius are even more metal poor than our extrapolation guess, which would bring the - zero-points into even better agreement.

4.5. Distance Calculation
Of the 11 fundamental mode and 2 first overtone Cepheids that have passed all selection criteria, individual distance moduli were calculated using the Wesenheit corrected PL relations with adjustments for metallicity () and distance modulus to the LMC (). We list all our known sources of error and how they propagate to the final derived distance modulus for an individual star in Table 3. We propagate random errors using standard techniques for Gaussian errors. Our systematic errors are dominated by the systematic uncertainty in the distance to the LMC. The weighted average of our 13 calculated distance moduli is giving a corresponding distance of 3.73 0.24 Mpc.
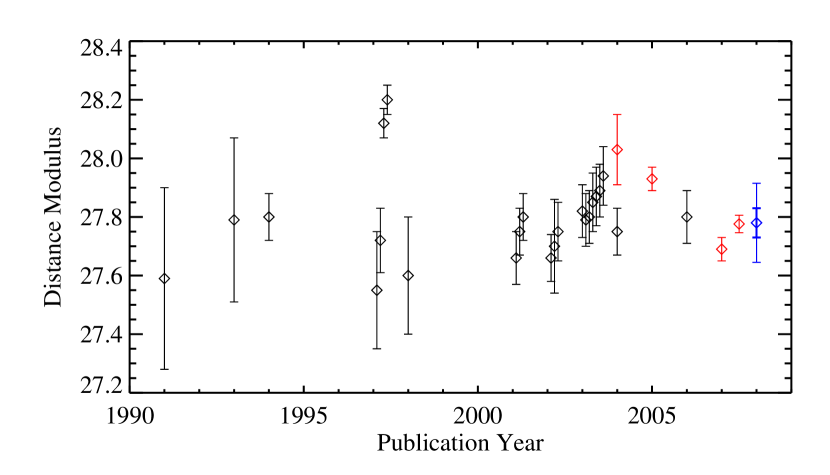
Of the final group of identified Cepheids, 12 out of 13 lie within one standard deviation of the mean distance modulus. Only one fundamental mode Cepheid lies greater than 2 standard deviations from the mean (Figure 5). Clipping this outlier, the final distance calculation results in a distance modulus of and a corresponding distance of Mpc. It is also worth noting that the clipped star (candidate 664.580) has by far the largest error in period resulting from the PCA template fit. This distance agrees well with previous measurements as shown in Figure 7. The agreement with the HST Key Project distance is excellent, in spite of the fact that we use fewer stars and non-optimally sampled light curves. This agreement and comparable accuracy is due to the improved statistical power of using PCA light curve templates.
| Source | Random Error | Random Error | Systematic error |
|---|---|---|---|
| Fitted Periods | 0.1-0.5 days | 0.01-0.09 | |
| Fitted Magnitudes | 0.01-0.02 mags | 0.02-0.05 | |
| - relation slope | 0.04 | ||
| - relation zero point | 0.05 | ||
| Reddening correction | 0 | 0.06 | |
| Metallicity Correction | 0.009 | 0.005 | |
| 0.10 | 0.13 | ||
| Overtone-Fundamental Classification |
5. Summary
1. We have isolated 11 fundamental mode and 2 first overtone Cepheid variables in an M81 deep field consisting of 9 V-band and 11 I-band images.
2. We calculate a distance modulus for M81 of 27.78 with a corresponding distance of Mpc, after removing one of the confirmed Cepheid variables, due to its obvious deviation from the mean distance modulus.
3. The distance modulus derived in this paper is consistent with those derived in previous years (Figure 6). The largest source of error in the final distance calculation is due to the systematic uncertainty in the distance modulus to the LMC () from Macri et al. (2006). The combination of using the appropriate fundamental mode (P days) and first overtone Cepheid templates of Yoachim et al. (2008) and the precision of ACS instrumentation and photometry produces uncertainties that are comparable to previous determinations of M81’s distance using more stars, brighter stars, and a greater number of observed epochs.
References
- Benedict et al. (2007) Benedict, G. F., McArthur, B. E., Feast, M. W., Barnes, T. G., Harrison, T. E., Patterson, R. J., Menzies, J. W., Bean, J. L., & Freedman, W. L. 2007, AJ, 133, 1810
- Berdnikov & Turner (1995) Berdnikov, L. N., & Turner, D. G. 1995, Pis ma Astronomicheskii Zhurnal, 21, 803
- Cardelli et al. (1989) Cardelli, J. A., Clayton, G. C., & Mathis, J. S. 1989, ApJ, 345, 245
- Dalcanton et al. (2009) Dalcanton, J., Williams, B., Seth, A., Dolphin, A., Holtzman, J., Rosema, K., Skillman, E., Cole, A., Girardi, L., Gogarten, S., Karachentsev, I., Olsen, K., Weisz, D., Christensen, C., Freeman, K., Gallart, C. Harris, J., Hodge, P., de Jong, R., Karachentseva, V., Mateo, M., Stetson, P., Tavarez, M., Zaritsky, D., Governato, F., & Quinn, T. 2009, Submitted to ApJS
- Dolphin (2000) Dolphin, A. E. 2000, PASP, 112, 1383
- Freedman et al. (1994) Freedman, W. L., Hughes, S. M., Madore, B. F., Mould, J. R., Lee, M. G., Stetson, P., Kennicutt, R. C., Turner, A., Ferrarese, L., Ford, H., Graham, J. A., Hill, R., Hoessel, J. G., Huchra, J., & Illingworth, G. D. 1994, ApJ, 427, 628
- Freedman et al. (2001) Freedman, W. L., Madore, B. F., Gibson, B. K., Ferrarese, L., Kelson, D. D., Sakai, S., Mould, J. R., Kennicutt, Jr., R. C., Ford, H. C., Graham, J. A., Huchra, J. P., Hughes, S. M. G., Illingworth, G. D., Macri, L. M., & Stetson, P. B. 2001, ApJ, 553, 47
- Herrnstein et al. (1999) Herrnstein, J. R., Moran, J. M., Greenhill, L. J., Diamond, P. J., Inoue, M., Nakai, N., Miyoshi, M., Henkel, C., & Riess, A. 1999, Nature, 400, 539
- Hubble (1929) Hubble, E. 1929, Proceedings of the National Academy of Science, 15, 168
- Kanbur & Ngeow (2004) Kanbur, S. M., & Ngeow, C.-C. 2004, MNRAS, 350, 962
- Macri et al. (2006) Macri, L. M., Stanek, K. Z., Bersier, D., Greenhill, L. J., & Reid, M. J. 2006, ApJ, 652, 1133
- Madore & Steer (2007) Madore, B., & Steer, I. 2007, NASA/IPAC Extragalactic Database Master List of Galaxy Distances, http://nedwww.ipac.caltech.edu/level5/NED1D/, Revision 2.2
- Madore (1982) Madore, B. F. 1982, ApJ, 253, 575
- Madore et al. (1993) Madore, B. F., Freedman, W. L., & Lee, M. G. 1993, AJ, 106, 2243
- Moffett & Barnes (1984) Moffett, T. J., & Barnes, III, T. G. 1984, ApJS, 55, 389
- Rizzi et al. (2007) Rizzi, L., Tully, R. B., Makarov, D., Makarova, L., Dolphin, A. E., Sakai, S., & Shaya, E. J. 2007, ApJ, 661, 815
- Romaniello et al. (2008) Romaniello, M., Primas, F., Mottini, M., Pedicelli, S., Lemasle, B., Bono, G., François, P., Groenewegen, M. A. T., & Laney, C. D. 2008, A&A, 488, 731
- Saha et al. (2006) Saha, A., Thim, F., Tammann, G. A., Reindl, B., & Sandage, A. 2006, ApJS, 165, 108
- Sandage & Tammann (2008) Sandage, A., & Tammann, G. A. 2008, ArXiv e-prints, 803
- Sandage et al. (2004) Sandage, A., Tammann, G. A., & Reindl, B. 2004, A&A, 424, 43
- Sirianni et al. (2005) Sirianni, M., Jee, M. J., Benítez, N., Blakeslee, J. P., Martel, A. R., Meurer, G., Clampin, M., De Marchi, G., Ford, H. C., Gilliland, R., Hartig, G. F., Illingworth, G. D., Mack, J., & McCann, W. J. 2005, PASP, 117, 1049
- Stetson (1996) Stetson, P. B. 1996, PASP, 108, 851
- Tanvir et al. (2005) Tanvir, N. R., Hendry, M. A., Watkins, A., Kanbur, S. M., Berdnikov, L. N., & Ngeow, C. C. 2005, MNRAS, 363, 749
- Tikhonov et al. (2005) Tikhonov, N. A., Galazutdinova, O. A., & Drozdovsky, I. O. 2005, A&A, 431, 127
- Udalski et al. (1999a) Udalski, A., Soszynski, I., Szymanski, M., Kubiak, M., Pietrzynski, G., Wozniak, P., & Zebrun, K. 1999a, Acta Astronomica, 49, 223
- Udalski et al. (1999b) —. 1999b, Acta Astronomica, 49, 437
- Udalski et al. (1999c) Udalski, A., Szymanski, M., Kubiak, M., Pietrzynski, G., Soszynski, I., Wozniak, P., & Zebrun, K. 1999c, Acta Astronomica, 49, 201
- Welch & Stetson (1993) Welch, D. L., & Stetson, P. B. 1993, AJ, 105, 1813
- Williams et al. (2009) Williams, B. F., Dalcanton, J. J., Seth, A. C., Weisz, D., Dolphin, A., Skillman, E., Harris, J., Holtzman, J., Girardi, L., de Jong, R. S., Olsen, K., Cole, A., Gallart, C., Gogarten, S. M., Hidalgo, S. L., Mateo, M., Rosema, K., Stetson, P. B., & Quinn, T. 2009, AJ, 137, 419
- Yoachim et al. (2008) Yoachim, P., McCommas, L., Dalcanton, J., & Williams, B. 2008, submitted to AJ
- Zaritsky et al. (1994) Zaritsky, D., Kennicutt, Jr., R. C., & Huchra, J. P. 1994, ApJ, 420, 87
| ID | R.A. (2000) | Dec. (2000) | Period(days) | /dof | |||
|---|---|---|---|---|---|---|---|
| ANGST C1 | 9:54:17.0 | 69:15:19.2 | 3.11(0.02) | 25.42(0.01) | 24.70(0.01) | 27.79(0.17) | 4.1 |
| ANGST C2 | 9:54:52.1 | 69:15:46.7 | 9.67(0.14) | 24.53(0.01) | 23.55(0.01) | 27.89(0.17) | 5.8 |
| ANGST C3 | 9:54:45.3 | 69:15:23.2 | 3.46(0.06) | 25.13(0.02) | 24.45(0.01) | 27.75(0.17) | 6.1 |
| ANGST C4 | 9:54:48.3 | 69:17:22.8 | 3.30(0.03) | 25.45(0.01) | 24.69(0.01) | 27.80(0.17) | 2.0 |
| ANGST C5 | 9:54:48.7 | 69:18:03.1 | 8.08(0.50) | 25.82(0.02) | 24.77(0.01) | 28.73(0.17) | 5.4 |
| ANGST C6 | 9:54:35.3 | 69:15:23.8 | 2.98(0.03) | 25.57(0.01) | 24.88(0.01) | 27.95(0.17) | 2.3 |
| ANGST C7 | 9:54:53.2 | 69:15:21.2 | 2.39(0.05) | 25.69(0.02) | 24.95(0.02) | 27.64(0.18) | 2.0 |
| ANGST C8 | 9:54:50.6 | 69:16:49.2 | 4.49(0.14) | 25.23(0.03) | 24.53(0.02) | 28.17(0.18) | 1.6 |
| ANGST C9 | 9:54:43.1 | 69:17:32.3 | 1.89(0.02) | 26.00(0.02) | 25.25(0.02) | 27.61(0.18) | 0.6 |
| ANGST C10 | 9:54:36.0 | 69:15:15.9 | 1.92(0.07) | 26.17(0.04) | 25.42(0.03) | 27.80(0.19) | 1.3 |
| ANGST C11 | 9:54:50.5 | 69:17:02.4 | 2.09(0.01) | 26.04(0.02) | 25.24(0.02) | 27.60(0.17) | 1.7 |
| ID | R.A. (2000) | Dec.(2000) | Period(days) | /dof | |||
|---|---|---|---|---|---|---|---|
| ANGST OV1 | 9:54:37.6 | 69:16:19.9 | 2.11(0.02) | 25.10(0.01) | 24.48(0.01) | 27.70(0.17) | 4.5 |
| ANGST OV2 | 9:54:47.4 | 69:17:36.9 | 2.04(0.02) | 25.28(0.01) | 24.62(0.01) | 27.72(0.17) | 2.1 |
| Name | MJD-54055 | Filter | Mag | error | Name | MJD-54055 | Filter | Mag | error |
|---|---|---|---|---|---|---|---|---|---|
| ANGST C1 | 2.9119 | 25.37 | 0.03 | ANGST C8 | 2.9119 | 25.46 | 0.04 | ||
| ANGST C1 | 6.9057 | 25.53 | 0.03 | ANGST C8 | 6.9057 | 25.37 | 0.04 | ||
| ANGST C1 | 4.5758 | 25.63 | 0.03 | ANGST C8 | 4.5758 | 24.87 | 0.08 | ||
| ANGST C1 | 4.9086 | 25.36 | 0.04 | ANGST C8 | 4.9086 | 25.02 | 0.30 | ||
| ANGST C1 | 1.7803 | 25.27 | 0.03 | ANGST C8 | 1.7803 | 25.15 | 0.07 | ||
| ANGST C1 | 1.9162 | 25.13 | 0.03 | ANGST C8 | 1.9162 | 25.33 | 0.03 | ||
| ANGST C1 | 0.7817 | 25.51 | 0.11 | ANGST C8 | 0.7817 | 24.97 | 0.08 | ||
| ANGST C1 | 0.9814 | 25.61 | 0.04 | ANGST C8 | 0.9814 | 24.97 | 0.08 | ||
| ANGST C1 | 2.7788 | 25.35 | 0.03 | ANGST C8 | 2.7788 | 25.40 | 0.04 | ||
| ANGST C1 | 2.8439 | 24.66 | 0.03 | ANGST C8 | 2.8439 | 24.65 | 0.04 | ||
| ANGST C1 | 2.9771 | 24.68 | 0.03 | ANGST C8 | 2.9771 | 24.61 | 0.04 | ||
| ANGST C1 | 6.9714 | 24.87 | 0.04 | ANGST C8 | 6.9714 | 24.61 | 0.04 | ||
| ANGST C1 | 4.6414 | 24.90 | 0.04 | ANGST C8 | 4.6414 | 24.18 | 0.07 | ||
| ANGST C1 | 4.9742 | 24.48 | 0.03 | ANGST C8 | 4.9742 | 24.23 | 0.07 | ||
| ANGST C1 | 4.7089 | 24.80 | 0.04 | ANGST C8 | 4.7089 | 24.27 | 0.07 | ||
| ANGST C1 | 4.7741 | 24.81 | 0.03 | ANGST C8 | 4.7741 | 24.35 | 0.03 | ||
| ANGST C1 | 1.8453 | 24.55 | 0.04 | ANGST C8 | 1.8453 | 24.45 | 0.03 | ||
| ANGST C1 | 1.9813 | 24.67 | 0.05 | ANGST C8 | 1.9813 | 24.62 | 0.05 | ||
| ANGST C1 | 0.8467 | 24.78 | 0.04 | ANGST C8 | 0.8467 | 24.40 | 0.03 | ||
| ANGST C1 | 1.0464 | 24.79 | 0.04 | ANGST C8 | 1.0464 | 24.47 | 0.04 | ||
| ANGST C2 | 2.9119 | 24.64 | 0.02 | ANGST C9 | 2.9119 | 26.28 | 0.05 | ||
| ANGST C2 | 6.9057 | 24.55 | 0.02 | ANGST C9 | 6.9057 | 26.19 | 0.05 | ||
| ANGST C2 | 4.5758 | 24.76 | 0.02 | ANGST C9 | 4.5758 | 26.22 | 0.06 | ||
| ANGST C2 | 4.9086 | 24.72 | 0.02 | ANGST C9 | 4.9086 | 26.28 | 0.06 | ||
| ANGST C2 | 1.7803 | 24.38 | 0.03 | ANGST C9 | 1.7803 | 25.75 | 0.04 | ||
| ANGST C2 | 1.9162 | 24.52 | 0.02 | ANGST C9 | 1.9162 | 25.90 | 0.05 | ||
| ANGST C2 | 0.7817 | 24.38 | 0.19 | ANGST C9 | 0.7817 | 26.19 | 0.05 | ||
| ANGST C2 | 0.9814 | 24.31 | 0.02 | ANGST C9 | 0.9814 | 26.24 | 0.06 | ||
| ANGST C2 | 2.7788 | 24.61 | 0.02 | ANGST C9 | 2.7788 | 26.21 | 0.05 | ||
| ANGST C2 | 2.8439 | 23.59 | 0.02 | ANGST C9 | 2.8439 | 25.40 | 0.06 | ||
| ANGST C2 | 2.9771 | 23.56 | 0.02 | ANGST C9 | 2.9771 | 25.46 | 0.07 | ||
| ANGST C2 | 6.9714 | 23.59 | 0.02 | ANGST C9 | 6.9714 | 25.32 | 0.05 | ||
| ANGST C2 | 4.6414 | 23.73 | 0.02 | ANGST C9 | 4.6414 | 25.29 | 0.06 | ||
| ANGST C2 | 4.9742 | 23.69 | 0.02 | ANGST C9 | 4.9742 | 25.50 | 0.06 | ||
| ANGST C2 | 4.7089 | 23.72 | 0.02 | ANGST C9 | 4.7089 | 25.27 | 0.07 | ||
| ANGST C2 | 4.7741 | 23.73 | 0.03 | ANGST C9 | 4.7741 | 25.44 | 0.06 | ||
| ANGST C2 | 1.8453 | 23.47 | 0.02 | ANGST C9 | 1.8453 | 25.12 | 0.08 | ||
| ANGST C2 | 1.9813 | 23.50 | 0.02 | ANGST C9 | 1.9813 | 25.23 | 0.07 | ||
| ANGST C2 | 0.8467 | 23.42 | 0.02 | ANGST C9 | 0.8467 | 25.46 | 0.06 | ||
| ANGST C2 | 1.0464 | 23.37 | 0.02 | ANGST C9 | 1.0464 | 25.47 | 0.05 | ||
| ANGST C3 | 2.9119 | 25.42 | 0.04 | ANGST C10 | 2.9119 | 26.41 | 0.09 | ||
| ANGST C3 | 6.9057 | 25.41 | 0.03 | ANGST C10 | 6.9057 | 26.35 | 0.09 | ||
| ANGST C3 | 4.5758 | 24.90 | 0.03 | ANGST C10 | 4.5758 | 26.25 | 0.08 | ||
| ANGST C3 | 4.9086 | 25.05 | 0.03 | ANGST C10 | 4.9086 | 26.54 | 0.08 | ||
| ANGST C3 | 1.7803 | 24.88 | 0.03 | ANGST C10 | 1.7803 | 25.62 | 0.07 | ||
| ANGST C3 | 1.9162 | 25.24 | 0.03 | ANGST C10 | 1.9162 | 25.93 | 0.05 | ||
| ANGST C3 | 0.7817 | 24.70 | 0.25 | ANGST C10 | 0.7817 | 26.24 | 0.08 | ||
| ANGST C3 | 0.9814 | 24.87 | 0.03 | ANGST C10 | 0.9814 | 26.34 | 0.10 | ||
| ANGST C3 | 2.7788 | 25.38 | 0.03 | ANGST C10 | 2.7788 | 26.37 | 0.09 | ||
| ANGST C3 | 2.8439 | 24.64 | 0.04 | ANGST C10 | 2.8439 | 25.62 | 0.07 | ||
| ANGST C3 | 2.9771 | 24.64 | 0.04 | ANGST C10 | 2.9771 | 25.58 | 0.08 | ||
| ANGST C3 | 6.9714 | 24.66 | 0.05 | ANGST C10 | 6.9714 | 25.67 | 0.08 | ||
| ANGST C3 | 4.6414 | 24.24 | 0.03 | ANGST C10 | 4.6414 | 25.60 | 0.12 | ||
| ANGST C3 | 4.9742 | 24.31 | 0.04 | ANGST C10 | 4.9742 | 25.37 | 0.08 | ||
| ANGST C3 | 4.7089 | 24.30 | 0.03 | ANGST C10 | 4.7089 | 25.53 | 0.06 | ||
| ANGST C3 | 4.7741 | 24.34 | 0.04 | ANGST C10 | 4.7741 | 25.56 | 0.07 | ||
| ANGST C3 | 1.8453 | 24.46 | 0.04 | ANGST C10 | 1.8453 | 25.20 | 0.07 | ||
| ANGST C3 | 1.9813 | 24.48 | 0.03 | ANGST C10 | 1.9813 | 25.26 | 0.06 | ||
| ANGST C3 | 0.8467 | 24.25 | 0.03 | ANGST C10 | 0.8467 | 25.59 | 0.08 | ||
| ANGST C3 | 1.0464 | 24.25 | 0.03 | ANGST C10 | 1.0464 | 25.49 | 0.07 |
| Name | MJD-54055 | Filter | Mag | error | Name | MJD-54055 | Filter | Mag | error |
|---|---|---|---|---|---|---|---|---|---|
| ANGST C4 | 2.9119 | 25.77 | 0.04 | ANGST C11 | 2.9119 | 25.72 | 0.05 | ||
| ANGST C4 | 6.9057 | 25.68 | 0.04 | ANGST C11 | 6.9057 | 26.13 | 0.06 | ||
| ANGST C4 | 4.5758 | 25.17 | 0.03 | ANGST C11 | 4.5758 | 26.12 | 0.07 | ||
| ANGST C4 | 4.9086 | 25.32 | 0.03 | ANGST C11 | 4.9086 | 25.91 | 0.05 | ||
| ANGST C4 | 1.7803 | 25.31 | 0.03 | ANGST C11 | 1.7803 | 26.03 | 0.05 | ||
| ANGST C4 | 1.9162 | 25.44 | 0.03 | ANGST C11 | 1.9162 | 26.17 | 0.06 | ||
| ANGST C4 | 0.7817 | 25.08 | 0.03 | ANGST C11 | 0.7817 | 25.74 | 0.05 | ||
| ANGST C4 | 0.9814 | 25.02 | 0.03 | ANGST C11 | 0.9814 | 25.76 | 0.05 | ||
| ANGST C4 | 2.7788 | 25.65 | 0.03 | ANGST C11 | 2.7788 | 26.00 | 0.06 | ||
| ANGST C4 | 2.8439 | 24.83 | 0.05 | ANGST C11 | 2.8439 | 25.13 | 0.04 | ||
| ANGST C4 | 2.9771 | 24.88 | 0.05 | ANGST C11 | 2.9771 | 24.98 | 0.04 | ||
| ANGST C4 | 6.9714 | 24.93 | 0.05 | ANGST C11 | 6.9714 | 25.32 | 0.05 | ||
| ANGST C4 | 4.6414 | 24.59 | 0.03 | ANGST C11 | 4.6414 | 25.34 | 0.06 | ||
| ANGST C4 | 4.9742 | 24.55 | 0.03 | ANGST C11 | 4.9742 | 25.06 | 0.05 | ||
| ANGST C4 | 4.7089 | 24.53 | 0.03 | ANGST C11 | 4.7089 | 25.42 | 0.06 | ||
| ANGST C4 | 4.7741 | 24.47 | 0.03 | ANGST C11 | 4.7741 | 25.31 | 0.05 | ||
| ANGST C4 | 1.8453 | 24.67 | 0.04 | ANGST C11 | 1.8453 | 25.27 | 0.04 | ||
| ANGST C4 | 1.9813 | 24.66 | 0.05 | ANGST C11 | 1.9813 | 25.30 | 0.06 | ||
| ANGST C4 | 0.8467 | 24.48 | 0.04 | ANGST C11 | 0.8467 | 25.01 | 0.04 | ||
| ANGST C4 | 1.0464 | 24.41 | 0.04 | ANGST C11 | 1.0464 | 25.11 | 0.05 | ||
| ANGST C5 | 2.9119 | 25.72 | 0.04 | ANGST OV1 | 2.9119 | 25.07 | 0.02 | ||
| ANGST C5 | 6.9057 | 26.26 | 0.06 | ANGST OV1 | 6.9057 | 25.13 | 0.02 | ||
| ANGST C5 | 4.5758 | 25.78 | 0.04 | ANGST OV1 | 4.5758 | 25.22 | 0.03 | ||
| ANGST C5 | 4.9086 | 25.95 | 0.04 | ANGST OV1 | 4.9086 | 25.10 | 0.03 | ||
| ANGST C5 | 1.7803 | 25.42 | 0.04 | ANGST OV1 | 1.7803 | 25.12 | 0.03 | ||
| ANGST C5 | 1.9162 | 25.66 | 0.04 | ANGST OV1 | 1.9162 | 25.20 | 0.03 | ||
| ANGST C5 | 0.7817 | 25.49 | 0.04 | ANGST OV1 | 0.7817 | 25.06 | 0.03 | ||
| ANGST C5 | 0.9814 | 25.58 | 0.06 | ANGST OV1 | 0.9814 | 24.94 | 0.03 | ||
| ANGST C5 | 2.7788 | 25.78 | 0.04 | ANGST OV1 | 2.7788 | 25.15 | 0.02 | ||
| ANGST C5 | 2.8439 | 24.69 | 0.04 | ANGST OV1 | 2.8439 | 24.52 | 0.04 | ||
| ANGST C5 | 2.9771 | 24.70 | 0.04 | ANGST OV1 | 2.9771 | 24.58 | 0.03 | ||
| ANGST C5 | 6.9714 | 24.98 | 0.04 | ANGST OV1 | 6.9714 | 24.57 | 0.03 | ||
| ANGST C5 | 4.6414 | 24.87 | 0.05 | ANGST OV1 | 4.6414 | 24.55 | 0.03 | ||
| ANGST C5 | 4.9742 | 24.75 | 0.03 | ANGST OV1 | 4.9742 | 24.46 | 0.04 | ||
| ANGST C5 | 4.7089 | 24.84 | 0.06 | ANGST OV1 | 4.7089 | 24.59 | 0.03 | ||
| ANGST C5 | 4.7741 | 24.89 | 0.04 | ANGST OV1 | 4.7741 | 24.51 | 0.03 | ||
| ANGST C5 | 1.8453 | 24.56 | 0.03 | ANGST OV1 | 1.8453 | 24.55 | 0.04 | ||
| ANGST C5 | 1.9813 | 24.80 | 0.05 | ANGST OV1 | 1.9813 | 24.53 | 0.04 | ||
| ANGST C5 | 0.8467 | 24.55 | 0.03 | ANGST OV1 | 0.8467 | 24.29 | 0.03 | ||
| ANGST C5 | 1.0464 | 24.54 | 0.04 | ANGST OV1 | 1.0464 | 24.31 | 0.03 | ||
| ANGST C6 | 2.9119 | 25.73 | 0.04 | ANGST OV2 | 2.9119 | 25.18 | 0.03 | ||
| ANGST C6 | 6.9057 | 25.75 | 0.04 | ANGST OV2 | 6.9057 | 25.24 | 0.03 | ||
| ANGST C6 | 4.5758 | 25.17 | 0.03 | ANGST OV2 | 4.5758 | 25.40 | 0.03 | ||
| ANGST C6 | 4.9086 | 25.39 | 0.04 | ANGST OV2 | 4.9086 | 25.34 | 0.03 | ||
| ANGST C6 | 1.7803 | 25.27 | 0.04 | ANGST OV2 | 1.7803 | 25.25 | 0.03 | ||
| ANGST C6 | 1.9162 | 25.48 | 0.04 | ANGST OV2 | 1.9162 | 25.39 | 0.03 | ||
| ANGST C6 | 0.7817 | 25.75 | 0.05 | ANGST OV2 | 0.7817 | 25.23 | 0.04 | ||
| ANGST C6 | 0.9814 | 25.82 | 0.05 | ANGST OV2 | 0.9814 | 25.16 | 0.02 | ||
| ANGST C6 | 2.7788 | 25.65 | 0.05 | ANGST OV2 | 2.7788 | 25.30 | 0.02 | ||
| ANGST C6 | 2.8439 | 24.99 | 0.05 | ANGST OV2 | 2.8439 | 24.60 | 0.03 | ||
| ANGST C6 | 2.9771 | 25.01 | 0.05 | ANGST OV2 | 2.9771 | 24.54 | 0.03 | ||
| ANGST C6 | 6.9714 | 25.14 | 0.06 | ANGST OV2 | 6.9714 | 24.56 | 0.03 | ||
| ANGST C6 | 4.6414 | 24.57 | 0.05 | ANGST OV2 | 4.6414 | 24.70 | 0.03 | ||
| ANGST C6 | 4.9742 | 24.71 | 0.04 | ANGST OV2 | 4.9742 | 24.53 | 0.04 | ||
| ANGST C6 | 4.7089 | 24.70 | 0.05 | ANGST OV2 | 4.7089 | 24.71 | 0.03 | ||
| ANGST C6 | 4.7741 | 24.67 | 0.04 | ANGST OV2 | 4.7741 | 24.71 | 0.03 | ||
| ANGST C6 | 1.8453 | 24.65 | 0.04 | ANGST OV2 | 1.8453 | 24.60 | 0.03 | ||
| ANGST C6 | 1.9813 | 24.86 | 0.05 | ANGST OV2 | 1.9813 | 24.68 | 0.03 | ||
| ANGST C6 | 0.8467 | 25.07 | 0.05 | ANGST OV2 | 0.8467 | 24.58 | 0.03 | ||
| ANGST C6 | 1.0464 | 25.03 | 0.04 | ANGST OV2 | 1.0464 | 24.58 | 0.03 | ||
| ANGST C7 | 2.9119 | 25.32 | 0.04 | ANGST C7 | 2.8439 | 24.92 | 0.05 | ||
| ANGST C7 | 6.9057 | 25.81 | 0.05 | ANGST C7 | 2.9771 | 24.51 | 0.12 | ||
| ANGST C7 | 4.5758 | 25.97 | 0.07 | ANGST C7 | 6.9714 | 25.10 | 0.07 | ||
| ANGST C7 | 4.9086 | 26.14 | 0.07 | ANGST C7 | 4.6414 | 25.06 | 0.06 | ||
| ANGST C7 | 1.7803 | 25.81 | 0.06 | ANGST C7 | 4.9742 | 25.25 | 0.06 | ||
| ANGST C7 | 1.9162 | 26.01 | 0.11 | ANGST C7 | 4.7089 | 25.11 | 0.08 | ||
| ANGST C7 | 0.7817 | 25.30 | 0.04 | ANGST C7 | 4.7741 | 25.21 | 0.07 | ||
| ANGST C7 | 0.9814 | 25.42 | 0.08 | ANGST C7 | 1.8453 | 24.99 | 0.05 | ||
| ANGST C7 | 2.7788 | 25.80 | 0.07 | ANGST C7 | 1.9813 | 25.19 | 0.07 | ||
| ANGST C7 | 0.8467 | 24.78 | 0.05 | ||||||
| ANGST C7 | 1.0464 | 24.69 | 0.05 |