The kinetics and acoustics of fingering and note transitions on the flute
Abstract
Motion of the keys was measured in a transverse flute while beginner, amateur and professional flutists played a range of exercises. The time taken for a key to open or close is typically 10 ms when pushed by a finger or 16 ms when moved by a spring. Delays between the motion of the fingers were typically tens of ms, with longer delays as more fingers are involved. Because the opening and closing of keys will never be exactly simultaneous, transitions between notes that involve the movement of multiple fingers can occur via several possible pathways with different intermediate fingerings. A transition is classified as ‘safe’ if it is possible to be slurred from the initial to final note with little perceptible change in pitch or volume. Some transitions are ‘unsafe’ and possibly involve a transient change in pitch or a decrease in volume. In transitions with multiple fingers, players, on average, used safe transitions more frequently than unsafe transitions. Professionals exhibited smaller average delays between the motion of fingers than did amateurs.
pacs:
43.75.QrI Introduction
In wind instruments, a single transition between two successive notes often requires the coordinated movement of two or more fingers (for simplicity, we shall refer to all digits, including thumbs, as fingers). One of the reasons why players practise scales, arpeggi and exercises is to learn to make smooth, rapid transitions between notes, without undesired transients. For players, this motivation is particularly important for slurred notes, where the transition involves no interruption to the flow of air, and should ideally produce no wrong notes and no detectable silence between the notes.
In practice, finger movements are neither instantaneous nor simultaneous, and it takes a finite time to establish a new standing wave in the instrument bore. Slurred transitions involving the motion of only a single finger can produce transients that result from the finite speed of the finger that pushes a key in one direction, or of the spring that returns it to its rest position. For transitions involving the motion of two or more fingers, there can be an additional transient time due to the time differences between the movements of each finger, which invites the question: how close to simultaneous can flutist finger movements be, and are there preferred finger orders in particular note transitions?
Although previous studies have monitored finger motion on the flute, they have been concerned with the flute as a controller for electronic instruments. The MIDI flute developed at IRCAM initially used optical sensors, but the final version used Hall effect sensors with magnets attached to the keys (Miranda and Wanderley, 2006). The “virtually real flute” (Ystad and Voinier, 2001) used linear Hall effect sensors and could detect the speed of key transitions. The hyper flute (Palacio-Quintin, 2003) employed a large number of sensors, but only two keys had linear Hall effect sensors. Palmer et al. (2007) used infra-red tracers attached to a player’s fingernails and recorded their motion with a video camera. Although suitable for detecting the gestures of a player, this approach does not provide sufficient resolution (in either space or time) to monitor the detailed fingering behaviour occurring in note transitions.
This paper reports explicit measurements of the times taken for keys to open and to close under the action of fingers and springs, and determines the key order and relative timing in transitions involving multiple fingers. The flute was chosen partly because of the similarity in size and construction of most of its keys, which means that keys move with approximately similar speeds, and also that similar sensors could be used for each. These sensors monitored the position of each key using reflected, modulated infra-red radiation and had the advantage that they did not alter the mass of keys nor affect their motion. The flute has the further advantage that measured acoustic impedance spectra are available for all standard fingerings (Wolfe et al., 2001), in addition to acoustical models of all possible fingerings (Botros et al., 2002, 2006).
II Some background in flute acoustics
In most woodwind instruments, the played note is determined in part by the combination of open and closed holes in the side of its bore, which is called a fingering. Each fingering produces a number of resonances (corresponding to extrema in the input impedance), one or more of which can be excited by a vibrating reed or air jet. On many modern woodwinds there are more holes in the instrument than fingers on two hands. Consequently some keys operate more than one tone hole, often using a system of clutches, and some fingers are required to operate more than one key.
The acoustical impedance spectrum of the flute for a particular fingering can be predicted by acoustical models, and important details of its behaviour can be deduced from this. The ’Virtual Flute’ is an example of a web service using such an acoustical model to predict the pitch, timbre and ease of playing (Botros et al., 2002, 2006). This service however does not yet give indications on the playing difficulties associated with transitions between two different fingerings.
The embouchure of the flute is open to the air and so the instrument plays approximately at the minima in the input impedance at the embouchure. The player selects between possible minima by adjusting the speed of the air jet (Coltman, 1976), and consequently a periodic vibration regime is established with fundamental frequency close to that of a particular impedance minimum or resonance. Fine tuning is achieved by rotating the instrument slightly, which has the effect of changing the jet length, the occlusion of the embouchure hole and thus the solid angle available for radiation, thereby modifying the acoustical end effect. Changing from one fingering to another usually changes most of the frequencies of the bore resonances and consequently also the note played. de la Cuadra et al. (2005) discuss flute control parameters in detail.
II.1 The transitions between notes
In some cases, no fingering changes are required: the player can select among different resonances by adjusting the speed and length of the jet at the embouchure. Thus the standard fingering for F4 is used by players to play the notes F4 and F5, (and can also play C6, F6, A6 and C7).
Many of the transitions between two notes separated by one or two semitones involve moving only a single finger. Provided that fingers or springs move the key or keys sufficiently quickly, one would expect no strong transients when slurring such transitions. Small transient effects can always arise because of the fact that the strength of the resonances in the bore of the flute are somewhat reduced when a key is almost, but not completely closed (an example is given later in Fig. 4).
Several mechanisms can produce undesirable transients in note transitions. One of particular interest to us may occur when a slurred transition involves the motion of two or more fingers. The speed of moving keys is limited by the speed of fingers in one direction and of the key springs that move them in the opposite direction. Further, the acoustic effects produced by the motion of a key are not linear functions of key displacement, so it is difficult to define simultaneous motion, particularly for keys moving in opposite directions. In practice, fingers will always move at slightly different times and with different speeds (how different are these times is one of the questions that we address). This means that, between two notes that involve the motion of more than one finger, there are several possible intermediate discrete key configurations, as well as the continuous variations during key motion. Furthermore, these different intermediate states may have quite different acoustic properties, which are not necessarily intermediate between those of the initial and final configurations.
II.2 Safe and unsafe transitions
We divide intermediate fingerings into three categories:
- SAFE.
-
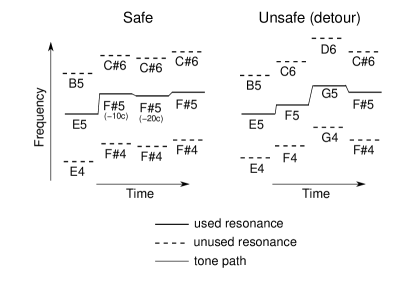
If the minima for lie at frequencies close to (or intermediate between) those of the initial and final states, and have similar magnitudes, then a steady oscillation of the jet can be maintained during a slurred transition. A transition that passes transiently through such a fingering can be called a safe transition and is illustrated schematically in Fig. 1. This result is discussed in more detail in section IV.2.
- UNSAFE (detour).
-
If one of the intermediate states exhibits a minimum in at a frequency unrelated to both notes in the desired transition, it may cause an undesired note to sound briefly during the transition – see Fig. 1.
- UNSAFE (dropout).
-
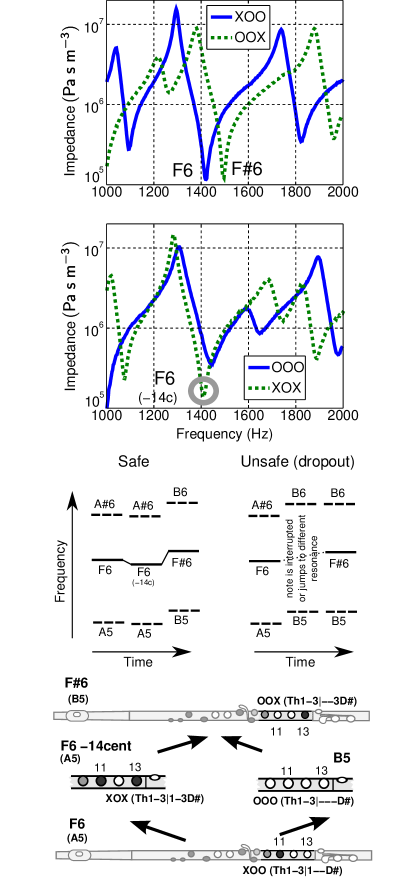
If there are no deep minima for at frequencies close to those of the initial and final states, jet oscillation may not be maintained during a slurred transition, because the jet length and speed are inappropriate for the frequency of the nearest minimum. In this case, the intensity of the tone will decrease substantially. Fig. 2 shows an example of a note transition for which one of the intermediate fingerings has a weak resonance.
We could also define a transition as ‘unsafe (trapped)’ when the second fingering has, as well as the resonance usually used, a strong resonance at a frequency close to that of the first note and so may ‘trap’ the jet. Botros et al. (2003) gives examples of this situation.
In some cases, such as the C6 to D6 transition (also analysed later), there is no safe intermediate fingering so, unless fingers move nearly simultaneously, audible transients are expected. Of course, even for our definition of safe transitions, transients are expected in the flute sound: it takes time for a wave to travel down the bore, to reflect at an open tone hole and to return, and several such reflections may be required to establish a standing wave with a new frequency. Finally, it should be remembered that some transients are an important part of the timbre of wind instruments and may be expected by musicians and listeners.
III Materials and methods
III.1 Monitoring the key positions
An optical method was chosen because, unlike magnetic systems, there was no need to attach magnets or other material to the keys, and thus alter their mass or feeling under the fingers. Mechanical contacts suffer reliability problems and exhibit bounce and/or hysteresis.
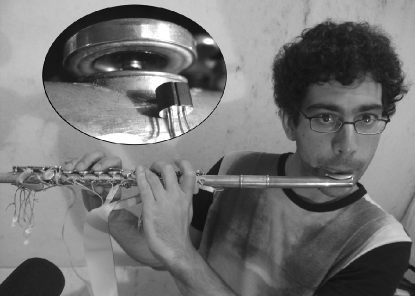
A reflective photosensor was glued below the edge of each key so that the intensity of light reflected from the edge of the key increased monotonically as the key was closed (see Fig. 3). The chosen sensors (Kodenshi SG-2BC) were small (4 mm diameter), low mass (160 mg), and combined an infrared light emitting diode (LED) with a high-sensitivity phototransistor (peak sensitivity at 940 nm). Instead, the sensor signal was distinguished from the background illumination by modulating the output of the LED in the sensor with a 5 kHz sine wave. The phototransistor in the sensor was connected as an emitter follower with an RC stage to filter out DC variations due to changes in lighting conditions. Because the background illumination and degree of shading can vary for each experiment, the DC bias was adjustable to provide adequate dynamic range for the 5 kHz signal without clipping. This was set using a separate 8 element bar LED display for each channel. This procedure removes most, but not all, of the dependence on background illumination: a small component remains because of non-linearities. The sensor signals from 16 keys and the sound were recorded on a computer using two MOTU 828 firewire audio interfaces (24 bit at 44.1kHz). Because the same hardware was used to sample both the sound and the output of the key sensors, we can be certain that any delays in sampling due to latencies and buffering will be identical and consequently will cancel exactly when timing differences are calculated.
The sensor output as a function of position was measured in experiments in which the sensor output was recorded while a key was slowly closed using a micrometer screw. These showed that the amplitude of the modulated output from the sensor was a monotonic, but nonlinear function of key position. In a further series of experiments, the flute was played by a blowing machine while a key was slowly closed by the micrometer. The frequency and intensity are plotted as a function of sensor output in Fig. 4. The shape of this plot is explained by the compressibility of the key pad. Once the pad makes contact with the rim of the tone hole chimney, the playing frequency reaches its lowest value and remains unchanged as the pad is compressed while the key is further depressed. (The sound level is high when the key is fully open and also when the key is closed with the pad compressed. The sound level is lower, however, when the hole is almost closed by the uncompressed pad, which is presumably a consequence of leaks between the pad and the rim, this can be seen in Fig. 5)
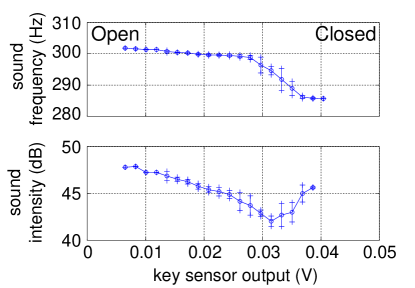
Measurements such as that shown in Fig. 4 cannot be simply used to calibrate measurements made with players rather than blowing machines. The main reason is that, for some players, the tip of the finger occasionally overhangs the key and contributes a small component to the reflection measured by the sensor.
III.2 Recording and analysing the sound
The sound produced by the flute was recorded using a Rhode NT3 microphone placed on a fixed stand and digitized using one input of the MOTU audio interfaces. The midpoint of the flute was approximately 50 cm away from the microphone. The frequency was calculated from the recorded sound file using Praat sound analysis software (Boersma, 1993), using autocorrelation with an analysis window of 15 ms. The time resolution for frequency transitions was estimated to be 8 ms by studying a semitone discontinuity in a sinusoidal signal (i.e. between 1000 Hz and 1059 Hz). The intensity and sound level were also extracted using Praat.
III.3 Characterisation of open/closed states and note transitions
One of the purposes of this study concerns the relative timing of the open/closed transitions, so it is necessary to relate a defined value of sensor output to the effective opening/closing of the associated key. Most of the variation in sound frequency occurs close to the point of key closure, so the saturation point in Fig. 4 was considered as a possible choice. In practice, because of the variations described earlier, this value would be somewhat different for each flutist, key and level of background illumination. Instead, guided by curves such as those shown in Fig. 4, we set the reference value for a key transition between 70% and 85% of the total variation in sensor output, the exact value depending on the key and situation (see Fig. 4).
Determining the duration of effective key opening and closing is also complicated by the saturation of sensor output described above. After examination of a range of traces under different conditions, we chose to measure the time taken between sensor signals of 30% and 70% of the maximum range of the sensor output. This rate of change was then multiplied by a factor of 100/40 to produce a measurement of the effective key closing or opening time. Examples are shown in Fig. 5.
An automated software routine was used to detect and characterise the key movements in each recording. First, it detected each time the output of a key sensor passed through a value midway between neighbouring fully closed and fully open states. These then served as initial starting points to find the nearest times when a key was effectively open or closed. These allowed calculation of the duration of each open/closed or closed/open transition. We estimated an uncertainty in each individual measurement by determining how long it took each key sensor output to vary by 5% around the effective open or closing value. This value, was on average 1.41.4 ms (n=2069) for a closing key and 4.12.6 ms (n=1639) for an opening key.
A single key may be associated with several different note transitions, so the key movements, detected as described above, need to be associated with the note transitions of interest. In order to find note transitions automatically, the detected pitch was quantised to the set of notes used in the exercise. These quantised data were smoothed using a filter which calculates the median value within a window of 50 ms so that only sufficiently long values corresponding to note transitions are detected. For each note transition thus detected, the corresponding nearest transition reference times for key motion are found. The pitch and key position detection are shown for two particular exercises in Fig. 5.
The following parameters were calculated for each key transition associated with a given note transition: the effective duration of the key transition, the offset in time between the key transition and the pitch transition (see Fig. 5) and an estimate of the uncertainty in the key closing or opening time.
III.4 Subjects
The 11 players participating in this experiment were divided into 3 categories according to experience. Professionals (players P1 to P7) are those with more than 8 years experience, and for whom flute playing is a significant part of their current professional life, either as performers or teachers. Amateurs (A1–A3) have between 3 and 8 years of flute playing experience, and regularly play the flute as a non-professional activity. Beginners (B1) have less than 3 years experience.
III.5 Experimental protocol
These experiments were conducted in a room with a low reverberance that was significantly isolated from external noise. All measurements were performed on a specific flute from the laboratory, a C-foot Pearl flute fitted with a sensor near each key. The flute is a plateau or closed key model, i.e. the keys do not have holes that must be covered by the fingers and it has a split E mechanism, which means that there is only one hole functioning as a register hole in the fingering for E6. Players could use their own head joint if desired.
A typical session took about 75 minutes. Each subject was asked to warm up freely for about 15 minutes, in order to become accustomed to the experimental flute, the change in balance and some awkwardness caused by the cables. They also used this time to rehearse the particular exercises in the experimental protocol. The musical exercises, written in standard musical notation, were delivered to the subjects approximately one week before the recording session. Some players did not complete all exercises.
III.6 Experimental exercises
The players were recorded performing a selection of note transitions, scales, arpeggi and musical excerpts. Except for the musical excerpts, each written exercise was performed at least twice, at two different tempi: players were asked to play “fast” (explained to them thus: as fast as possible while still feeling comfortable and sure that all the notes in the exercise were present) and “slow” (in a slow tempo but still comfortable to perform the exercise once in a single breath). In the case of the fast performance, the musician was asked to repeat the exercise as many times as possible (but still comfortable) in a single breath.
IV Results and discussion
The times taken for each key to be effectively depressed or released (i.e. to make the relevent key open or close depending upon its mechanism) are shown in Table 1. In all cases, pressing times are quicker, perhaps because the finger can transfer momentum gained in a motion that may begin before contact with the key, whereas a released key has to be accelerated from rest by a spring. The large variation among the durations for finger activated motion may include the variations in strength and speed of the fingers in the somewhat different positions in which they are used. There is rather less variation among the mechanical release times. However, some keys differ noticeably from the others. Large variation in the latter involves the key mechanism: some keys move alone, others in groups of two or three, because of the clutches that couple their motion. In particular, the left thumb key and the right little finger (D key) have stiffer springs, so their release movement is significantly faster () than for other keys. Overall, slow tempi produce significantly slower () key press times.
| Key | Finger | Press time (ms) | Release time (ms) |
|---|---|---|---|
| 3 | L Index | 11.34.8 (100) | 15.94.9 (100) |
| 4 | L Thumb | 8.71.1 (204) | 9.22.1 (205) |
| 6 | L Medium | 15.26.0 (101) | 16.93.7 (304) |
| 7 | L Ring | 17.09.5 (273) | 22.29.4 (480) |
| 11 | R Index | 11.25.1 (160) | 15.63.3 (185) |
| 12 | R Medium | 8.911.1 (160) | 15.33.1 (181) |
| 13 | R Ring | 8.32.5 (532) | 16.79.4 (524) |
| 14 | R Little | 12.12.6 (179) | 12.99.3 (172) |
IV.1 Single finger transitions
When only one key is involved in a note transition, the pitch change is a direct consequence of the motion of that key. As explained above, the transition from one note to another is not discrete. The frequency of the impedance minimum corresponding to the fundamental of one note is shifted gradually as the opening cross-section of the hole is increased. A relatively small range of key positions, near the fully closed limit is associated with most of the change in pitch (Fig. 4): variations in position near the fully open state have much less effect. The delay between detected key motion and frequency change was 1.93.8 ms (n=1303), which is less than the uncertainties in the measurements: the uncertainty in frequency change is several ms and the experimental uncertainty in key motion a few ms (Fig. 5). (The time for radiated sound from the flute to reach the microphone was only about 1 or 2 ms.)
IV.2 Two finger transitions
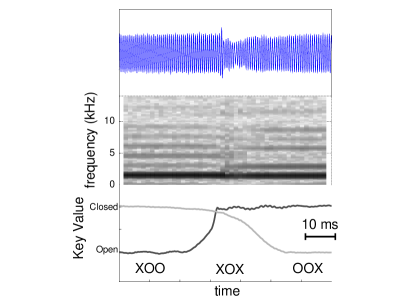
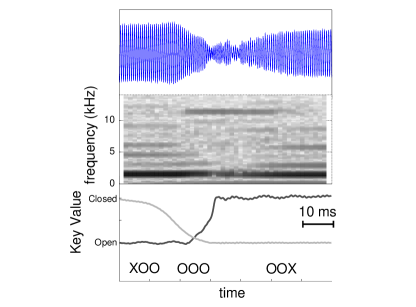
When two keys are involved in a note transition, there are two possible intermediate key configurations due to the non-simultaneous movement of the fingers. Examples involving the index and ring fingers of the right hand moving in opposite directions are the transitions F4 to F4, F5 to F5 and F6 to F6, but only F6/F6 involves an unsafe intermediate. Using X to indicate depressed and O unpressed, and only indicating the first three fingers of the right hand, this transition goes from XOO to OOX, with the possible intermediates being XOX and OOO, as shown in Fig. 2. The fingering with both keys depressed (XOX) plays a note 14 cents flatter than F6. The fingering with neither key depressed (OOO) is more complicated. If the speed of the air jet is well adjusted to play F6 or F6, then this fingering does not play a clear note (see Fig. 6). If the speed of the air jet is somewhat slower than would normally be used to play these notes, then it will play a note near B5. So, apart from the ideal, unrealisable, ‘simultaneous’ finger movement, there can only be one safe path for the transition XOO to OOX and that goes via the fingering XOX (in which both keys are briefly depressed): the slight perturbation in pitch cannot be detected in a rapid transition.
We have also sought to compare intermediate states used during different exercises involving the same transition. Players were asked to rapidly alternate between the two notes as well as play it in the context of a scale. The exercise of rapidly alternating between XOO and OOX fingerings is an artificial exercise. For such rapid altenations, players often use special trill fingerings, in which intonation and/or timbre are sacrificed in return for ease of rapid performance. To perform this trill, a flutist would normally alternate the XOX and OOX fingerings, i.e. transform it into a single finger transition using the ring finger only. Thus the exercise is one that flutists will not have rehearsed before this study. By contrast, the same key transition in the context of a scale (here the B minor scale), is one which experienced flutists will have practised over years.
Considerable differences were found between slow and fast trials (data not shown). The results for all players are presented in Fig. 7.
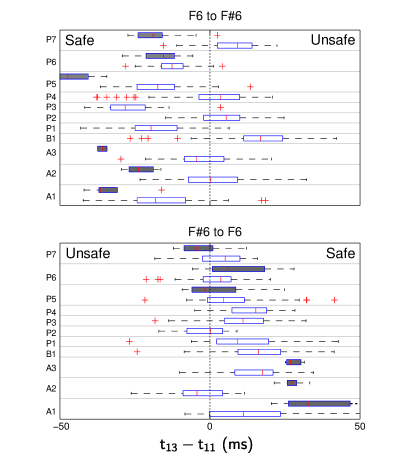
Fig. 7 shows that the descending transition (F6 to F6) has a relatively consistent behaviour. For note alternations, professional musicians used a safe finger order 72% of the times (that is transiting through the XOX state where both keys are depressed). Although they sometimes (48%) use the unsafe finger order in the scale context, was in average 3.89.6 ms (n=210), so that this transition is close to simultaneous.
In the ascending case (F6 to F6) of the alternation exercise professionals used safe transitions in 57% of cases, although the behaviour was less homogeneous among players (p¡0.001 in the F6/F6; p=0.02 in F6/F6), but in the scale context musicians used safe transitions 97% of the time ( = -2617 ms (n=33)).
Although the transition from F4 to F4 uses the same fingerings as F6 to F6, in this case all transition pathways are safe. Interestingly, most of the professionals tend to use the finger order which would be safe for F6 to F6 with similar time differences between keys (p=0.02 for F/F and p=0.13 for F/F), even though there is no unsafe intermediate for F4 to F4. For one professional (P5) and most amateurs, the time differences did change significantly but with no consistent direction (either becoming more or less simultaneous). The finger order remained the same as for the other subjects.
IV.3 Three finger transitions
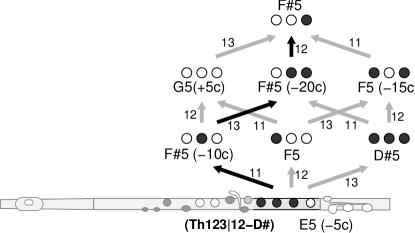
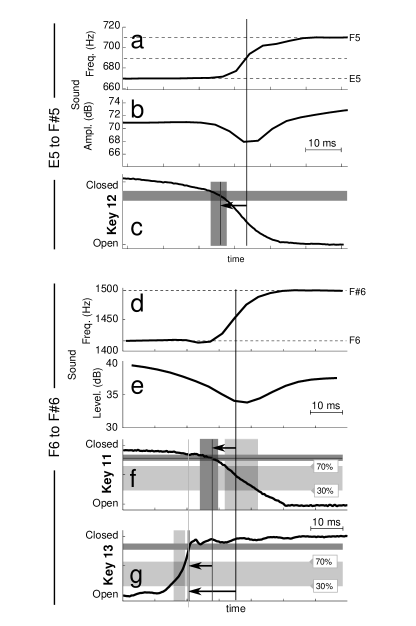
The example we will use is the E5 to F5 transition, which involves three different keys (11, 12 and 13), moved respectively by the index, middle and ring fingers of the right hand, with the little finger remaining depressed throughout. Using the notation described above and neglecting other keys, E5 is played using XXO (Th123—12-D) and F5 is played OOX (Th123—- -3D). Thus the fingers are lifted from the keys 11 (index) and 12 (middle) and key 13 (ring) is depressed.
Discounting the idealised simultaneous movement of the fingers, there are six possible pathways involving discrete transients. From an acoustical point of view, only one of these is safe: key 11 moves first, then key 13 then key 12 (i.e. XXO, OXO, OXX, OOX). This path is safe because OXO and OXX both play slightly flat versions of F5. Conversely, when descending from F5 to E5, the only safe transition is 12, 13 and then 11 (OOX, OXX, OXO, XXO). Any other path involves a fingering that produces a note near G5 (OOO), F5 (XOX or XOO) or D5 (XXX), which may or may not be noticeable depending on the duration of the intermediate. The paths are shown in Fig. 1.
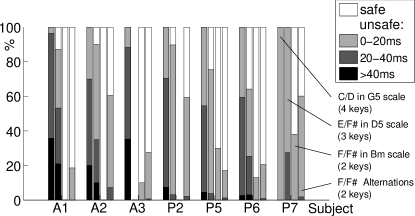
The results for all flutists for this transition are summarised in Fig. 8. For this transition, most professionals are nearly safe, using pathways that are unsafe for only 20 ms. The durations in the intermediate states vary substantially among players. Even though this context (a D major scale) is one that flutists would have practised many times, the delay times are substantially longer here than for the two finger, contrary motion example shown above, which uses two of the same fingers. From examining the average and standard deviations of the inter-key time difference, we also observe that some of the subjects (P2 and P5) have significantly smaller time differences (data not shown). To summarise, professionals spend an average of 13 9 ms (n=225) in unsafe transitions whereas amateurs spend 25 16 ms (n=88), which are significantly different ().
IV.4 Four finger transitions
The three long fingers and the thumb of the left hand move in the transition from C6 (OXOO, or 1- -—- - -D) to D6 (XOOO or Th-23—- - -D), with the index finger releasing a key and the others depressing keys. Here, there is no completely safe path of transient fingerings, because the intermediate states involving a change in position of any two fingers all sound a note different from C6 or D6. There are partially safe paths, for example, starting with C6 and moving first either the middle or ring finger still produces a note very close to C6.
Average times spent in unsafe transitions, measured in the context of a G major scale, are shown in Fig. 8. As with the previous example, most flutists exhibited some preferred paths, but they are not consistent among players, and sometimes the same player may use different finger orders while playing quickly or slowly.
To summarise, all professional players spend less time in unsafe configurations than do the amateurs: unsafe intermediate states last for an average of 34 14 ms (n=65) for amateurs, 21 11 ms (n=133) for professionals. The difference is significant (). Thus, for both professionals and amateurs, the time spent in unsafe configurations is larger when four fingers rather than three are involved.
IV.5 Summary of multi-finger transitions
Typical values of delays between fingers are about 10 to 20 ms for transitions that involve the motion of two or more fingers and significantly longer for amateurs than for professionals. In multi-finger transitions, the most frequent finger orders are often those that avoid or minimise the use of transient fingerings that are unsafe, as defined above. This is particularly true for transitions involving two fingers, but less evident in more complicated transitions.
We can compare the finger motion delays for the four, three and two-finger changes discussed above. (For one finger, the delay by definition is zero, as it does not include the time for key motion.) This is shown in Fig. 8, which summarises the results obtained in the examples studied in this article.
These results can be related to similar studies on repetitive tapping movements in non-musical exercises (Aoki et al., 2003). In these, single finger movements show a variability in inter-tap intervals of about 30 ms, increasing to 60 ms in the most agile fingers when two fingers are involved. When ring and little fingers are involved, this value is increased to 120 ms. These high values suggest that the inaccuracies in multi-tap intervals are mostly due to the duration of the finger motion rather than to synchronisation between the motion of two fingers, but no references were found for measurements of these values.
Some informal tests on our subjects show that when no sound output is involved the standard deviation in delays between keys can increase from approx. 20 to 40 ms, independently of the proficiency. These values suggest that in musicians the sound feedback improves the performance of the gesture.
Finally, delays between fingers are unimportant if their effect on sound cannot be detected. Gordon (1987) studied perceptual attack times in different pairs of instruments. These have variations that range from 6 to 25 ms, but in the flute they are about 10 ms. Minimum durations needed to identify pitch are typically 4 periods (less than 10 ms for flute notes) (Patterson et al., 1983).
V Conclusions
For single key transitions, the transition time is simply determined by the time for a finger to push a key in one direction, typically 10 ms, or of a spring to push it in the other, typically 16 ms. When more than one finger is involved, the delay times between individual key movements must be added to this. For a transition involving only two fingers and thus only two pathways, players in general coordinate their fingers so that the unsafe transition is avoided. For some transitions, there is no safe path. Professionals, unsurprisingly, are more nearly simultaneous than amateurs. For both amateurs and professionals, total delay increases with the number of fingers in contrary motion.
Acknowledgements.
We thank our experimental subjects, The WoodWind Group and the Australian Research Council for their support.References
- Aoki et al. (2003) Aoki, T., Francis, P. R., and Kinoshita, H. (2003). “Differences in the abilities of individual fingers during the performance of fast, repetitive tapping movements”, Experimental Brain Research 152, 270–280.
- Boersma (1993) Boersma, P. (1993). “Accurate short-term analysis of the fundamental frequency and the harmonics-to-noise ratio of a sampled sound”, in Proceedings of the Institute of Phonetic Sciences, volume 17, 97–110.
- Botros et al. (2002) Botros, A., Smith, J., and Wolfe, J. (2002). “The virtual boehm Flute-A web service that predicts multiphonics, microtones and alternative fingerings”, Acoust. Australia 30, 61–66.
- Botros et al. (2003) Botros, A., Smith, J., and Wolfe, J. (2003). “The ’Virtual flute’: acoustics modelling at the service of players and composers”, in Proceedings of the Stockholm music acoustics conference (SMAC 03), 247–250 (Stockholm, Sweeden).
- Botros et al. (2006) Botros, A., Smith, J., and Wolfe, J. (2006). “The virtual flute: an advanced fingering guide generated via machine intelligence”, Journal of New Music Research 35, 183–196.
- Coltman (1976) Coltman, J. W. (1976). “Jet drive mechanisms in edge tones and organ pipes”, The Journal of the Acoustical Society of America 60, 725–733.
- de la Cuadra et al. (2005) de la Cuadra, P., Fabre, B., Montgermont, N., and Ryck, L. D. (2005). “Analysis of flute control parameters: A comparison between a novice and an experienced flautist”, in Proceedings of Forum Acusticum 2005, Budapest (Budapest, Hungary).
- Gordon (1987) Gordon, J. W. (1987). “The perceptual attack time of musical tones”, The Journal of the Acoustical Society of America 82, 88–105.
- Miranda and Wanderley (2006) Miranda, E. R. and Wanderley, M. (2006). New Digital Musical Instruments: Control And Interaction Beyond the Keyboard, 1st edition (A-R Editions, Inc.).
- Palacio-Quintin (2003) Palacio-Quintin, C. (2003). “The hyper-flute”, in Proceedings of the 2003 conference on New interfaces for musical expression, 206–207 (National University of Singapore, Montreal, Quebec, Canada).
- Palmer et al. (2007) Palmer, C., Carter, C., Koopmans, E., and Loehr, J. D. (2007). “Movement, planning, and music: Motion coordinates of skilled performance”, in Proceedings of the inaugural conference on music communication science (Sydney, Australia).
- Patterson et al. (1983) Patterson, R. D., Peters, R. W., and Milroy, R. (1983). “Threshold duration for melodic pitch”, Hearing: Physiological Bases and Psychophysics, edited by R. Klinke and R. Hartmann (Springer-Verlag, Berlin) 321––325.
- Wolfe et al. (2001) Wolfe, J., Smith, J., Tann, J., and Fletcher, N. H. (2001). “Acoustic impedance of classical and modern flutes”, Journal of Sound and Vibration 243, 127––144.
- Ystad and Voinier (2001) Ystad, S. and Voinier, T. (2001). “A virtually real flute”, Computer Music Journal 25, 13–24.