Effect of concentration on the thermodynamics of sodium chloride aqueous solutions in the supercooled regime
Abstract
Molecular Dynamics simulations are performed on two sodium chloride solutions in TIP4P water with concentrations and upon supercooling. The isotherms and isochores planes are calculated. The temperature of maximum density line and the limit of mechanical stability line are obtained from the analysis of the thermodynamic planes. The comparison of the results shows that for densities well above the limit of mechanical stability, the isotherms and isochores of the sodium chloride aqueous solution shift to lower pressures upon increasing concentration while the limit of mechanical stability is very similar to that of bulk water for both concentrations. We also find that the temperature of maximum density line shifts to lower pressures and temperatures upon increasing concentration. Indications of the presence of a liquid-liquid coexistence are found for both concentrations.
pacs:
65.20.Jk,De,64.60.MyI Introduction
The properties of aqueous ionic solutions besides being of undoubtful importance in chemical physicsAngell and electrochemistry Anderko , are relevant in many other fields of science including biology and biophysics Leckband , geophysics Sherman , and even atmospheric modeling. Archer In the supercooled region, thermodynamic properties of solutions are also of interest for the cryopreservation of organs and food. Urrutia ; pablobook ; franksbook From a more fundamental point of view an improved understanding of the thermodynamics of these systems upon supercooling, can help to shed light on the open questions on bulk liquid water. Angell2
It is well known that water presents, in the supercooled region, peculiar thermodynamic behavior. phystoday ; Debenedetti ; Genegroup ; Angell3 ; Angell4 In particular, the most striking effects are the existence of a temperature of maximum density (TMD) line and the divergence of the isothermal compressibility , of the isobaric specific heat and of the coefficient of thermal expansion . The origin of this anomalous behavior is still a matter of large interest and debate in the literature. Debenedetti Several theoreticalRoberts ; Cervantes ; Widom ; Franzese ; Kumar2 ; Truskett ; Grande ; Jefferey and computer simulationGene ; Poole ; Paschek ; Paschek2 ; Tanaka ; Brovchenko ; Vallauri ; Mossa ; Sciortino papers have shown the presence in the supercooled region of water of a liquid-liquid (LL) critical point. Experimental signatures of this critical point have been also found. Mishima The second critical point of water would be the end point of the coexistence line between a low density liquid (LDL) and a high density liquid (HDL). In this framework, the anomalous properties of water arise as a consequence of the presence of the LL critical point. Furthermore in this picture, the limit of mechanical stability (LMS) is non-reentrant and the TMD line is knee-shaped and avoids to cross the LMS line.
Aqueous ionic solutions have been extensively studied at ambient temperature. Their structural properties are the main focus of most papers, with particular emphasis on the hydration structure. leberman ; degreve ; koneshan ; bruni ; chowduri ; hribar ; chandra ; jardon ; patra ; botti ; du ; mancinelli ; panag Many studies in the supercooled regime deal with the glass transition phenomenon (see Ref. Angell, and references therein) while the detailed comparison of the thermodynamic behavior of the aqueous solutions with respect to bulk water in the mild supercooled regime still lacks a thorough investigation. Calorimetric experiments have shown that from low to moderate concentration of ions several thermodynamic properties of aqueous solutions are dominated by the solvent.Archer ; Archer2
In this paper, we present a Molecular Dynamics (MD) simulation study of the thermodynamics of two sodium chloride aqueous solutions, in the following denoted also as NaCl(aq), in the supercooled regime. This work is an extension of a previous study performed on bulk water and on a NaCl(aq) solution with low salt concentration. mio
The concentrations of salt in the solutions studied in the present work are and . For both systems we study the isotherms in the plane and the isochores in the plane. The analysis of those thermodynamic planes leads to the determination of the LMS and TMD lines. Moreover we present the trend of the potential energy as a function of density, at a low temperature. We will compare the results of the present simulations with results on bulk water and NaCl(aq) studied in our previous work. mio We also perform a comparison of the results with what found for water confined in a hydrophobic environment of soft spheres. gallorovere
II Model and simulation details
Two aqueous sodium chloride solutions with concentrations, given in moles of solute per mass of solvent, and are simulated by means of MD technique. In the case of the solution the system is composed by 244 water molecules, 6 ions and 6 ions, while in the case of the solution, it is composed by 238 water molecules, 9 ions and 9 ions.
The particles interact via the sum of coulombic and Lennard-Jones (LJ) potentials. The analytical expression of the interaction potential is given by
| (1) |
where is the electric charge and and are LJ parameters. Water molecules are modeled employing the TIP4P potential. tip4p Ion-ion and ion-water LJ parameters are derived from Pettit and Rossky rossky parameters for the Huggins-Mayer potential, via the reparametrization made by Koneshan and Rasaiah koneshan for LJ potential. The ion-water and ion-ion LJ interaction parameters are summarized in Table 1.
| Atom pair | ||
|---|---|---|
| Na-O | 0.56014 | 2.720 |
| Na-H | 0.56014 | 1.310 |
| Cl-O | 1.50575 | 3.550 |
| Cl-H | 1.50575 | 2.140 |
| Na-Na | 0.11913 | 2.443 |
| Cl-Cl | 0.97906 | 3.487 |
| Na-Cl | 0.35260 | 2.796 |
Periodic boundary conditions are applied. The cutoff radius is fixed at Å. Usually cutoff radius is fixed in simulations between and Å vega . Long range electrostatic interactions are taken into account by the Ewald summation method with convergence parameter set to , where is the edge of the cubic simulation box.
The systems are equilibrated by controlling the temperature with the Berendsen thermostat. berendsen Production runs are done in the ensemble. The integration timestep used is 1 fs.
For both systems we studied the densities . For each density, a starting configuration is produced distributing the particles on a face centered cubic lattice, with random orientation of water molecules. The crystal is then melted at K and the temperature is stepwise reduced during the equilibration runs. The lowest temperature investigated is K. Equilibration runs become very long for the lowest temperatures investigated. Each equilibration run is followed by a production run in which the thermodynamic averages are calculated. Production runs are always done with the same length of the equilibration runs. The longest equilibration and production runs last up to 10 ns each.
The simulations are carried out using the DL_ POLY package. dlpoly The pressures extracted are calculated with the virial equation allen .
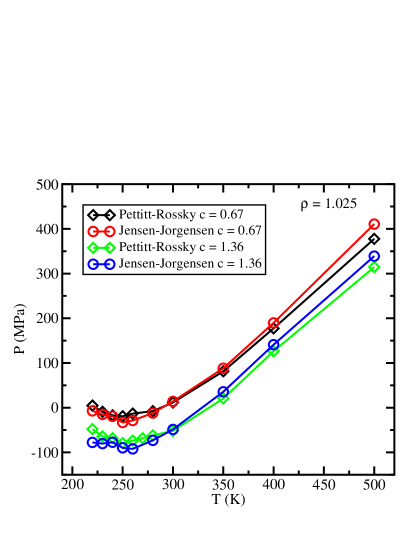
The choice of the force field is very important in the case of ionic aqueous solutions patra ; cheatham since for example in KCl recent studies have evidenciated possible problems that are water model independent kclpot . However the NaCl behavior seems to show an weaker dependence on the specific force field since it shows a lower tendency to form clusters kclpot . For the solution and at K we have an internal energy value of . This value can be compared with a simular value of obtained for a solution and at K for a ionic potential with SPC flexible water potential lyu . In order to stringently test the robustness of our potential we have run simulations along a isochore with a recent ionic potential by Jensen and Jorgensen JJ tailored for TIP4P water. In Fig. 1 we show, for the two different concentrations, the isochore calculated with both potentials. We can see that the two potentials produce similar results.
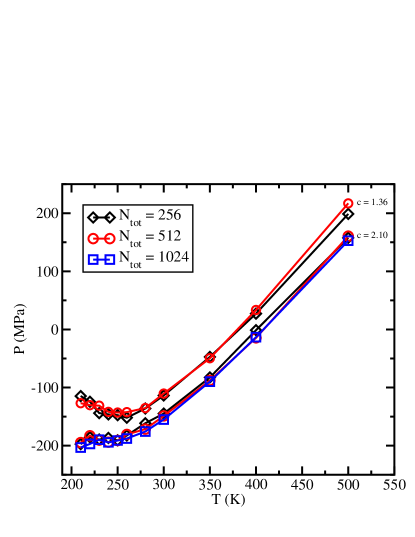
We have also conducted a test to verify that our data do not depend significatively on the size of the box. Results are reported in Fig. 2. For we compare the isochore calculated for 244 water molecules and 6 ion pairs, and for 488 water molecules and 12 ion pairs. The simulation box of these systems is Årespectively. For we compare the isochore calculated for 238 water molecules and 9 ion pairs, for 476 water molecules and 18 ion pairs and for 952 water molecules and 36 ion pairs. The simulation box of these systems is Årespectively. We note that the curves corresponding to the same concentrations are very similar and that their minimum does not show any significant shift.
III Thermodynamic Results
The simulated thermodynamic state points have been reported in the (isotherms) plane and in the (isochores) plane. The analysis of those planes allows the determination of the LMS line and TMD line, respectively. Both curves can be derived using thermodynamic relations.
By considering the isothermal compressibility
| (2) |
the LMS line is defined by the locus of the points for which diverges. The line that joins the minima of the isotherms corresponds to the LMS line. The TMD line is defined as the locus of the points where the coefficient of thermal expansion is zero.
| (3) |
Therefore the line joining the minima of the isochores yields the TMD line.
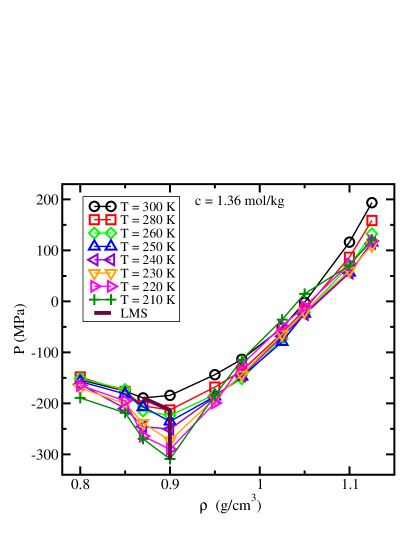
In Fig. 3 and Fig. 4 we report the isotherms of the two solutions in the plane as given by our simulations. In both cases we display only the curves that show minima and thus contribute to the calculation of the LMS line.
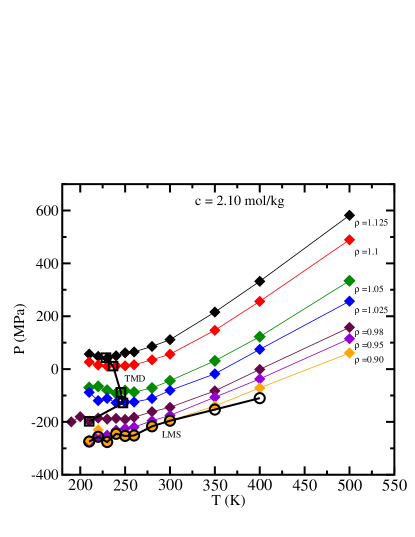
Fig. 3 refers to the solution. We show the isotherms in the range and the corresponding LMS line. K is the highest temperature isotherm which shows a minimum. The LMS line starts at at K and shifts to for all the lower temperature curves. The lowest temperature isotherms, K and K, show inflections that cross the higher temperature isotherms for densities in the range .
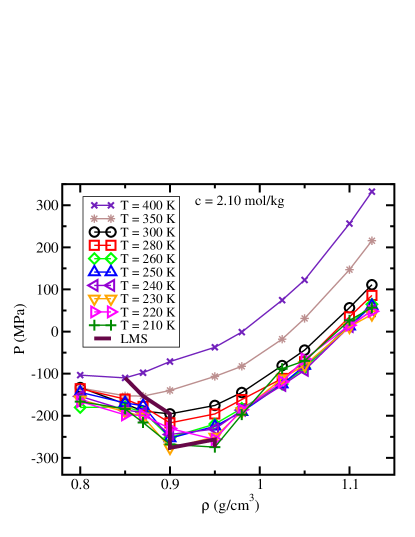
Fig. 4 refers to the solution. We report the isotherms in the range and the corresponding LMS line. At this concentration, minima of the isotherms can be found up to the K isotherm. The LMS line gradually shifts toward higher densities upon decreasing the temperature. In this case the only isotherm showing an inflection is the one at K. This inflection spans the density range .
Upon comparing the isotherms planes of the two solutions we note that, at high densities, the isotherms of the higher concentration solution are shifted by about 50 MPa toward lower pressures, with respect to the isotherms of the lower concentration solution. This shift decreases at densities close to the minima of the isotherms and it almost disappears for very low densities. This behavior of the isotherms is analogous to what found in the comparison between bulk water and the solution. mio A similar pressure shift can be seen also when comparing the and the solutions (not shown). Therefore upon increasing ions concentration the isotherms progressively shift toward lower pressures.
For the solution the LMS line in the isotherms plane (Fig. 3) is monotonic as already found for bulk water Gene ; Spinodal ; Mossa , confined water gallorovere and NaCl(aq). mio In the solution (Fig. 4) it does not decrease on going from the K to the K isotherm.
An important feature of the isotherms planes of the two solutions is the presence of inflections of the low temperature isotherms. It has been previously shown for bulk water that those inflections in the isotherms are a signature of the approach of the systems to liquid-liquid (LL) coexistence. Gene ; Spinodal ; Mossa As already noted for the solution mio , this behavior is maintained in the NaCl(aq). Therefore we can infer that the HDL/LDL coexistence, possibly terminating in a second critical point, is present in the NaCl(aq) solutions, at least up to concentration. Nonetheless the shrinkage of the density range of inflections in the isotherms seems to indicate a gradual disappearance of the coexistence upon increasing salt content.
These findings are consistent with what found by Archer and Carter Archer in their experimental paper. They found that the anomalous behavior of supercooled water, and in particular the divergence of isobaric specific heat and the existence of a TMD line are maintained in NaCl(aq) up to concentrations of about . Thus, in the framework of the second critical point scenario, it could be proposed that those anomalies are a consequence of a second critical point in the NaCl(aq) system, shifted toward lower pressures with respect to bulk water.
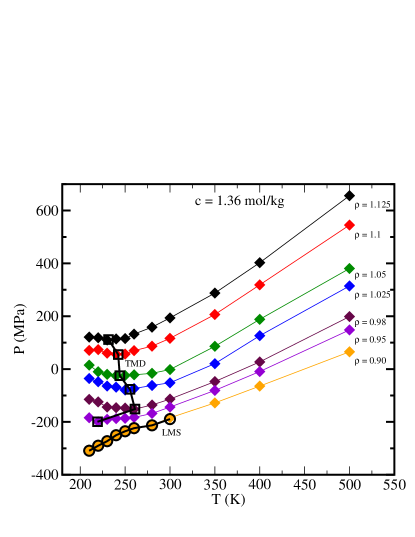
In Fig. 5 and Fig. 6 the isochores planes of the two solutions are reported. The isochores are presented along with the LMS lines and the TMD lines. For both systems the isochores lying below the LMS line are not reported. The minima are obtained by fitting the isochores with fourth degree polynomial functions.
In Fig. 5 we show the isochores in the range , the LMS line and the TMD line for the solution. The range of temperatures spanned is . All the isochores above display a minimum, while the isochore is almost completely coincident with the LMS line. Such LMS line is entirely in the region of negative pressure and it is nonre-entrant down to the lowest temperature we simulated. This behavior has been already found in bulk water Poole ; Gene ; Spinodal ; Mossa ; hpss ; Netz , confined water gallorovere and NaCl(aq). mio
In Fig. 6 the isochores in the range , the LMS line and the TMD line for the solution are displayed. Also in this case the range of temperatures spanned is . The isochores above the show a minimum. At this concentration some oscillations can be found in the LMS line at low temperatures. This line approximately follows the trend found for the isochore.
The comparison of the two isochores planes shows that also the isochores of the solution are shifted toward lower pressures by roughly 50 MPa, with respect to the solution, as already noted for the isotherms of the systems. This pressure shift decreases at low densities and at it almost vanishes.
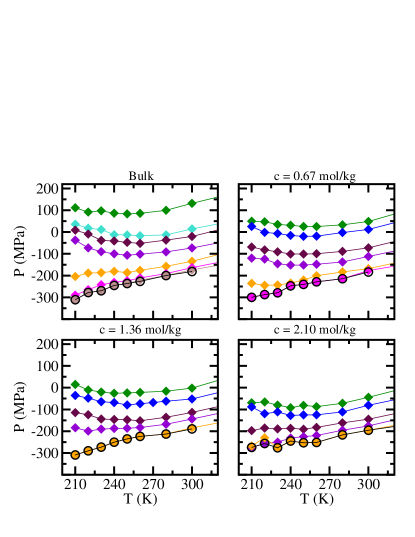
In order to have a direct comparison of the two aqueous solutions studied here with both bulk water and the solution, we report in Fig. 7 the isochores for bulk water, , and solutions in the temperature range and for densities and . In this picture it is more evident that the increase in concentration leads to a downward pressure shift of the corresponding isochores. This shift is quite consistent at high densities while it tends to reduce at low densities, close to the LMS line. To best show the overall packing of the isochores upon increasing salt content in Fig. 8 we show the blow-up of the plane in the temperature range for all systems in the same density range. On going from bulk water to the solution we observe a decrease by about 50% of the spanned range of pressures.
It has been previously observed in the literature that at constant pressure, ions have an effect on the structure of liquid water equivalent to the application of an external pressure. leberman ; botti ; mancinelli ; pasch ; pasch2 This effect is consistent with our findings since we see that the bulk isochores at a certain density coincide with higher density isochores of the aqueous solution.
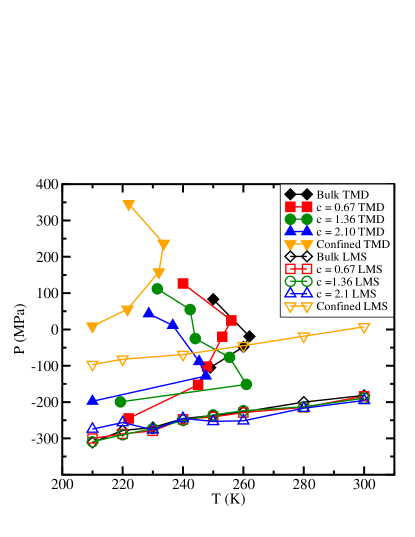
In Fig. 9 we show the comparison of TMD and LMS lines in the plane among different systems: the two solutions studied in the present paper, the NaCl(aq) and bulk water mio and TIP4P water confined in a hydrophobic environment of soft spheres. gallorovere The temperature range spanned here is . We note that the LMS line appears not to be significantly affected by the presence of ions. For the and the solutions the LMS line is almost identical to the bulk LMS. Only at the highest concentration, , it shows minor differences. In the case of water in hydrophobic matrix, which behaves similarly to a solution of small apolar solutes gallorovere , the LMS line is similar in shape to that of bulk water and NaCl(aq) solutions but presents a significant shift, circa 200 MPa, in the direction of higher pressures due to excluded volume effects caused by the strong solute solvent repulsive strength.
At variance with the LMS line, the TMD line is markedly influenced by the presence of ions. Upon increasing concentration, in fact, it shifts to lower temperatures and pressures. Moreover in all our solutions the TMD line extends to lower densities with respect to bulk water. Also the shape is modified by the ions and this effect appears to be influenced by concentration. For the solution the TMD line is much broader than for bulk water. For the and the solutions, the TMD narrows, remaining broader than that of bulk water. In the case of the hydrophobic solute, the TMD line is broadened with respect to bulk water in a way similar to the case of NaCl(aq), but it is shifted by roughly 200 MPa (upwards) in pressure and 40 K (to the left) in temperature with respect to the bulk. A similar shift in temperature was found also by Kumar et al. in TIP5P water confined between hydrophobic plates. Kumar
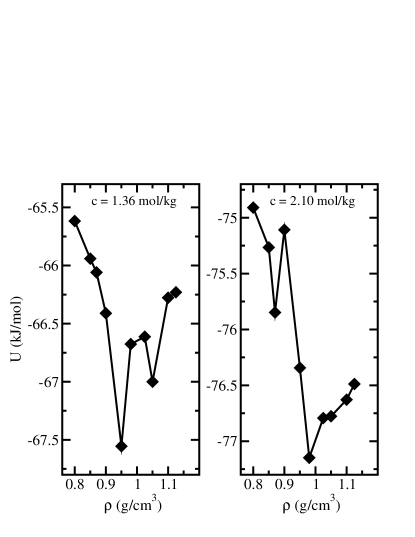
Now we further inquire on the possibility of a LL coexistence in our solutions. In Fig. 10 we show the potential (or configurational) energy per molecule of the two solutions, , at K, as a function of the density. For both solutions, shows two minima. For the solution, these minima are in correspondence with densities and . For the solution, minima can be found in correspondence with densities and . The existence of minima in the potential energy as a function of the density, at low temperatures, can be related to the presence of LDL/HDL coexistence, as shown by Kumar et al. Kumar for water in hydrophobic confinement at K. Therefore the presence of two minima in the potential energy, at low temperature, in our solutions confirms the indication of the existence of a LL coexistence inferred from the inflections of low temperatures isotherms that we observed.
We can thus infer that, up to the highest concentration we studied, the anomalous behavior of supercooled water is maintained in the NaCl(aq) solutions. The presence of the ions does not seem to hinder the mechanism of emergence of this anomalous behavior. On the other hand the shift and the packing in the thermodynamic plane and the gradual weakening of the inflection in the isotherms, upon increasing salt content, are signatures of a progressive disappearance of the anomalies for higher concentrations of ions.
IV Conclusions
We performed MD simulations on two sodium chloride aqueous solutions in TIP4P water, with concentrations and , extending our previous work on bulk water and NaCl(aq). mio Using the simulated state points, we drew the isotherms and the isochores planes of the systems. The analysis of those planes allowed the determination of the LMS line and of the TMD line, respectively.
By comparing the results obtained for the solutions studied here and in previous work, we can observe that the presence of minima in the isotherms, determining the presence of a LMS line, is preserved in all the NaCl(aq) solutions analyzed. Importantly, also the inflections for low temperatures isotherms, at high densities, are maintained in the solutions. Nonetheless, they become less pronounced upon increasing concentration. As previously shown for bulk water Gene ; Spinodal ; Mossa , those inflections signal the presence of phase coexistence between LDL and HDL in the systems. Being the LL coexistence still present up to the highest concentration we studied, we can hypothesize that whether a second critical point exists for bulk water, it is preserved in the NaCl(aq) solution. Also the existence of a TMD line, determined by the presence of minima in the isochores plane, is maintained in the NaCl(aq) solutions. Experimental results have shown that the TMD at ambient pressure is still present for a solution and disappears for . Archer In our results we note that the minima of the isochores become less pronounced for the solution and correspondingly the TMD narrows.
Although the overall thermodynamic behavior of the NaCl(aq) solution is similar to that of bulk water, some differences can be noted. In fact, for densities high with respect to the LMS line, both the isotherms and the isochores shift to lower pressures upon increasing concentration. This behavior results in a significant packing of the curves, as it is particularly evident in the isochores plane. The difference of pressure between the highest density isochore and the LMS line is in fact much broader in bulk water than in solutions and it is reduced upon increasing concentration. The LMS line is not influenced by the presence of ions. In fact both the position in the plane and the shape remains similar to bulk water, with some minor differences appearing for the highest concentration studied. The TMD line is instead modified in shape and shifted toward lower pressures and temperatures upon increasing concentration.
The results for the LMS line and TMD line were also compared to those for water confined in a hydrophobic environment of soft spheres. gallorovere For this system the LMS line is similar in shape to that of bulk water but it is shifted to higher pressures. The TMD line is instead similar to that of NaCl(aq) in shape but it is shifted to higher pressures and lower temperatures.
The existence of two minima in the curves of the potential energy as function of density indicates that LL coexistence is present in the the NaCl(aq) solutions studied here, in analogy with what found for water confined between two hydrophobic plates. Kumar This result strengthen the hypothesis of a LL coexistence deduced from the observation of inflections in the low temperature isotherms.
We note on passing that signatures of LL coexistence have been experimentally found in LiCl(aq) solutions. Mishima2
We have shown that various anomalous features of supercooled water are preserved in aqueous solutions of sodium chloride up to the highest concentration investigated. Interestingly the TMD can be even followed down to lower densities with respect to bulk. From the thermodynamic features investigated we hypothesize that the LL critical point would be slightly shifted in temperature and more markedly shifted in pressure with respect to bulk water. Therefore an experimental observation of the LL critical point in aqueous solutions, for which crystallization is more easily avoided than in the bulk phase Angell2 , could be possible.
ACKNOWLEDGMENTS
The authors gratefully acknowledge the computational support of the Democritos National Simulation Center, at SISSA, Trieste and of the Roma Tre INFN-GRID.
References
- (1) C. A. Angell, Chem. Rev. 102, 2627 (2002).
- (2) A. Anderko, P. Wang and M. Rafal, Fluid Phase Equil. 194-197, 123 (2002).
- (3) D. Leckband and J. Israelachvili, Q. Rev. Biophys. 34, 105 (2001).
- (4) D. M. Sherman, M. D. Collings, Geophys Trans. 3, 102 (2002).
- (5) D. G. Archer and R. W. Carter, J. Phys. Chem. B 104, 8563 (2000).
- (6) G. Urrutia et al., Journal of Food Engineering, 87, 293 (2007).
- (7) P. G. Debenedetti,Metastable liquids, Princeton University Press (1996).
- (8) F. Franks, Water, a matrix for life, Royal Society of Chemistry (2000).
- (9) C. A. Angell, J. E. Sare, J. Chem. Phys. 52, 1058 (1970).
- (10) P. G. Debenedetti and H. E. Stanley, Physics Today 56, 40 (2003).
- (11) P. G. Debenedetti, J. Phys.: Condens. Matt. 15, R1670 (2003) and references therein.
- (12) H. E. Stanley, P. Kumar, L. Xu, Z. Yan, M. G. Mazza, S. V. Buldyrev, S.-H. Chen and F. Mallamace, Physica A 386, 729 (2007).
- (13) C. A. Angell, Annu. Rev. Phys. Chem. 34, 593 (1983).
- (14) C. A. Angell, in Water: A Comprehensive Treatise, edited by F. Franks (Plenum, New York, 1981), chap. 1.
- (15) C. J. Roberts and P. G. Debenedetti, J. Chem. Phys. 105, 658 (1996)
- (16) L. A. Cervantes, A. L. Benavides and F. del Río, J. Chem. Phys. 126, 084507 (2007).
- (17) G. Franzese and H. E. Stanley, J. Phys.: Condens. Matter 19, 205126 (2007).
- (18) G. Franzese, M. I. Marqués and H. E. Stanley, Phys. Rev. E 67, 011103 (2003).
- (19) P. Kumar, G. Franzese and H. E. Stanley, J. Phys.: Condens. Matter 20, 244114 (2008).
- (20) T. M. Truskett, P. G. Debenedetti, S. Sastry and S. Torquato, J. Chem. Phys. 111, 2647 (1999).
- (21) P. H. Poole, F. Sciortino, T. Grande, H. E. Stanley and C. A. Angell, Phys. Rev. Lett. 73, 1632 (1994).
- (22) C. A. Jefferey. P. H. Austin, J. Chem. Phys. 110, 484 (1999).
- (23) P. H. Poole, F. Sciortino, U. Essman and H. E. Stanley, Nature 360, 324 (1992).
- (24) P. H. Poole, I. Saika-Voivod and F. Sciortino, J. Phys.: Condens. Matter 17, L431 (2005).
- (25) D. Paschek, Phys. Rev. Lett. 94, 217802 (2005).
- (26) D. Paschek and A. Geiger, arXiv:cond-mat/0512199v1.
- (27) H. Tanaka, J. Chem. Phys. 105, 5099 (1996).
- (28) I. Brovchenko, A. Geiger and A. Oleinikova, J. Chem. Phys. 123, 044515 (2005).
- (29) P. Jedlovszky and R. Vallauri, J. Chem. Phys. 122, 081101 (2005).
- (30) M. Yamada, S. Mossa, H.E. Stanley, F. Sciortino, Phys. Rev. Lett. 88, 195701 (2002).
- (31) F. Sciortino, P .H. Poole, U. Essmann and H. E. Stanley, Phys. Rev. E 55, 727 (1997).
- (32) O. Mishima and H. E. Stanley, Nature 392, 164 (1998); ibid. 396, 329 (1998).
- (33) R. Leberman and A. K. Soper, Nature 378, 364 (1995).
- (34) L. Degrève, F. L. B. da Silva, J. Chem. Phys. 111 5150 (1999).
- (35) S. Koneshan and J. C. Rasaiah, J. Chem. Phys. 113, 8125 (2000).
- (36) F. Bruni, M. A. Ricci and A. K. Soper, J. Chem. Phys. 114, 8056 (2001).
- (37) S. Chowduri and A. Chandra, J. Chem. Phys. 115 3732 (2001).
- (38) B. Hribar, N. T. Southall, V. Vlachy and K. A. Dill, J. Am. Chem. Soc. 124 12302 (2002).
- (39) S. Chowduri and A. Chandra, J. Chem. Phys. 118 9719 (2003).
- (40) E. Jardón-Valadez, M. E. Costas, J. Mol. Struct. (Theochem) 677 227 (2004).
- (41) M. Patra, M. Karttunen, J. Comput. Chem. 25 678 (2004).
- (42) A. Botti, F. Bruni, S. Imberti, M. A. Ricci and A. K. Soper, J. Chem. Phys. 120, 10154 (2004).
- (43) H. Du, J. C. Rasaiah and J. D. Miller, J. Chem. Phys. 111 209 (2007).
- (44) R. Mancinelli, A. Botti, F. Bruni, M. A. Ricci and A. K. Soper, Phys. Chem. Chem. Phys. 9, 2959 (2007).
- (45) P. J. Lenart, A. Jusufi and A. Z. Panagiotopoulos , J. Chem. Phys. 126 044509 (2007).
- (46) R. W. Carter and D. G. Archer, Phys. Chem. Chem. Phys. 2 5138 (2000).
- (47) D. Corradini, P. Gallo and M. Rovere, J. Chem. Phys. 128, 244508 (2008).
- (48) P. Gallo and M. Rovere, Phys. Rev. E 76, 061202 (2007).
- (49) W. L. Jorgensen, J. Chandrasekhar, J. D. Madura, R. W. Impey and M. L. Klein, J. Chem. Phys. 79, 926 (1983).
- (50) B. M. Pettitt, P. J. Rossky, J. Chem. Phys. 84, 5836 (1984).
- (51) C. Vega, E. Sanz, J. L. F. Abascal, J. Chem. Phys. 122, 114507 (2005).
- (52) H. J. C. Berendsen, J. P. M. Postma, W. F. van Gunsteren, A. DiNola and J. R. Haak, J. Chem. Phys. 81, 3684 (1984).
- (53) W. Smith, T. R. Forester and I. T. Todorov, The DL_ POLY_ 2.0 User Manual (Daresbury Laboratory, Daresbury, UK, 2006).
- (54) M. P. Allen, D. J. Tildesley, Computer simulation of liquids (Clarendon, Oxford, 1987).
- (55) I. S. Joung, T. E. Cheatham, III, J. Phys. Chem. B 112, 9020 (2008).
- (56) P. Auffinger, T. E. Cheatham, III, A. C. Vaiana, J. Chem. Theory Comput. 3, 1851 (2007).
- (57) K. P. Jensen, W. L. Jorgensen, J. Chem. Theory Comput. 2, 1499 (2006).
- (58) A. P. Lyubartsev, A. Laaksonen, Phys. Rev. E 52, 3730 (1995).
- (59) P. H. Poole, F. Sciortino, U. Essman and H. E. Stanley, Phys. Rev. E 48, 3799 (1993).
- (60) S. Harrington, P. H. Poole, F. Sciortino and H. E. Stanley, J. Chem. Phys 107 7443 (1997).
- (61) P. A. Netz, F. W. Starr, H. E. Stanley and M. C. Barbosa, J. Chem. Phys. 115, 344 (2001).
- (62) J. Holzmann, R. Ludwig, D. Paschek and A. Geiger, Angew. Chem. Int. Ed. 46 8907 (2007).
- (63) J. Holzmann, R. Ludwig, A. Geiger and D. Paschek, Chem. Phys. Chem. 9 2722 (2008).
- (64) P. Kumar, S. V. Buldyrev, F. W. Starr, N. Giovambattista and H. E. Stanley, Phys. Rev. E 72, 051503 (2005).
- (65) O. Mishima, J. Chem. Phys. 123, 154506 (2005); ibid. 126, 244507 (2007).