HE 1327-2326, an unevolved star with
III. Does Its Atmosphere Reflect Its Natal Composition?
Abstract
Based on spectroscopic constraints derived from NLTE line formation, we explore the likely range of stellar parameters ( and log ) for the hyper-metal-poor (HMP) star HE 13272326. Combining the constraints from Balmer line profiles and the Ca i/ii ionization equilibrium, a subgiant stage of evolution is indicated. This result is further supported by spectrophotometric observations of the Balmer jump. If a higher value was used (as favoured by some photometric calibrations), the spectroscopic analysis would indicate a turnoff-point stage of evolution.
Using a stellar-structure code that treats the effects of atomic diffusion throughout the star in detail, we evolve a low-mass model star to reach the HR-diagram position of HE 13272326 after roughly 13 Gyr. While the surface abundances are modified significantly (by more than 1 dex for the case of uninhibited diffusion), such corrections can not resolve the discrepancy between the abundance inferred from the non-detection of the Li i resonance line at 6707 Å and the WMAP-based primordial lithium abundance. As there are numerous processes that can destroy lithium, any cosmological interpretation of a lower-than-expected lithium abundance at the lowest metallicities will have to await sample sizes of unevolved hyper-metal-poor stars that are one order of magnitude larger. The situation remains equally inconclusive concerning atomic-diffusion corrections. Here, attempts have to be made to better constrain internal mixing processes, both observationally and by means of sophisticated modelling. With constraints on additional mixing processes taken from a recent globular-cluster study, the likeliest scenario is that HE 13272326’s surface abundances have undergone mild depletion (of order 0.2 dex).
1 Introduction
The most metal-poor stars provide us with chemical information about the early Universe and the onset of the cosmic chemical evolution. This is based on the assumption that the surface abundances of these old stars indeed reflect the composition of their birth cloud, and have not changed during the long lifetimes. In principle, there are several internal and external processes which may have an impact on the surface composition of old stars, such as internal pollution of the outer layers by nuclear burning products from the stellar interior (in the case the star is sufficiently evolved) or accretion of interstellar gas during Gyr of orbiting though the Galactic potential (the latter process was recently shown to be rather inefficient, see Frebel et al. (2008b)).
HE 13272326 is a low-mass star with extreme properties: its excessively low metallicity in terms of iron ([Fe/H] , Frebel et al. (2005)) is accompanied by large (3 – 4 dex) over-abundances of the elements C, N and O relative to iron, a property shared by the other two stars known in this metallicity regime (Christlieb et al. (2002), Norris et al. (2007)). What these stars can tell us about the properties of the first generation of stars (metal-free Population III) is still debated. The abundance pattern has been interpreted to reflect the nucleosynthetic yields of a single Pop III supernova (Iwamoto et al. (2005); Meynet et al. (2006)), but see Venn and Lambert (2008) for an alternative scenario potentially explaining the abundance peculiarities of hyper-metal-poor (HMP) stars.
Apart from these interpretative uncertainties, our ability to read the chemical fingerprints encoded in the spectra of these stars is limited by the technical challenge to properly model the line-formation process taking place in their atmospheres. For the most part, the chemical abundances have been inferred using one-dimensional (1D) hydrostatic model atmospheres in local thermodynamic equilibrium (LTE) with rough (estimated) corrections for departures from LTE (so-called NLTE effects). In the case of calcium, the only element observed in two ionization stages, 1D LTE leads to a clear mismatch for the abundances derived from Ca i and Ca ii: the abundance from the Ca i resonance line at 4226 Å gives an abundance 0.57 dex below the abundance derived from the Ca ii K line at 3934 Å (Aoki et al., 2006). This may reflect the shortcomings of classical 1D LTE analyses when applied to HMP stars. Explorations using three-dimensional (3D) hydrodynamic model atmospheres have modified the abundance ratios (bringing down the large over-abundances by typically 0.7 dex for the CNO elements), but have been unable to resolve the above-mentioned discrepancy (reported by Frebel et al. (2008a) to be 0.46 dex in 1D-LTE and 0.47 dex in 3D-LTE).
The LTE assumption is particularly questionable when analysing (hyper-)metal-poor stars, as their atmospheres are UV-transparent leading to strong photo-ionization. Furthermore, electronic collisions are less efficient due to the reduced number of electron donors like Fe and Mg. Both these effects will drive the statistical equilibrium away from LTE. It is thus worthwhile to check whether NLTE can solve the obvious mismatch for the case of calcium.
HE 13272326 is either an evolved main-sequence (MS) or early subgiant (SG) star at 6200 K, i.e., HE 13272326 is a star on the Spite plateau of lithium (Spite and Spite, 1982) formed by stars with K and [Fe/H] (Charbonnel and Primas, 2005). Despite the uncertainty in the evolutionary status of HE 13272326, the relatively unevolved nature of this old star makes it an ideal target for a Li measurement. Other unevolved metal-poor stars have been used to infer the primordial Li abundance. However, the Li doublet at 6707 Å could not be detected in HE 13272326. The upper limit111The customary logarithmic 12-scale is used here: is , in contrast to the Spite-plateau value of found in other stars. This finding currently lacks a satisfying explanation.
In search for a solution, one can question the assumption that the surface abundances of old stars are constant over time. Even for single MS or SG stars, processes may be at work which systematically alter the chemical surface composition. For solar-type stars, stellar-structure models allowing the atoms to move freely inside the star under the prevailing forces predict sizeable effects in particular for old metal-poor stars. Such processes (gravitational settling and radiative levitation, to name two prominent ones) are collectively referred to as atomic diffusion and require billions of years to alter the abundances of solar-type stars. Convection can suppress their efficiency, but atomic diffusion seems capable of depleting the thin low-mass convective envelopes of metal-poor stars appreciably (see e.g. Richard et al. (2002)), unless extra mixing processes stir up the boundary layer between the convective and the radiative zone.
Observational evidence in favour of atomic diffusion in the presence of some extra mixing was recently presented (Korn et al., 2006, 2007; Lind et al., 2008) for stars in NGC 6397 ([Fe/H] ). Based on observed abundance trends between stars from the turn-off point (TOP) to the red-giant branch (RGB), the mixing efficiency needed in the stellar-structure models was empirically determined. This mixing falls in the range expected from observational constraints set by the Spite plateau (Richard et al., 2005); surface-abundance alterations due to atomic diffusion are then limited to dex and help to harmonize the inferred lithium abundances with the predictions from WMAP-based Big-Bang nucleosynthesis calculations (Korn et al., 2006).
In this article, we thus explore to which extent the surface abundances of HE 13272326 may be affected by atomic diffusion. After describing the observational material (Sect. 2) we derive stellar parameters using spectrophotometry and NLTE diagnostics (Sect. 3). Based on these, we present upper limits on the abundance variations induced by atomic diffusion and discuss their consequences (Sect. 4). In Sect. 5, we summarize our conclusions.
2 Observations
We combine data obtained in 2004 and 2005 with Subaru/HDS and VLT/UVES, respectively. The UVES spectra (, Frebel et al. (2006)) are used for the Balmer lines (H and H) and the Ca IR triplet lines. The HDS spectra (, Aoki et al. (2006)) cover Ca K 3933 Å and the Ca i resonance line 4226 Å. In all cases, the signal-to-noise ratio exceeds 200:1. The limiting factor for an abundance analysis of HE 13272326 is thus not to be sought in the quality of the input data.
Spectrophotometric observations of HE 13272326 were obtained with the Double Beam Spectrograph (DBS) on the 2.3m telescope at Siding Springs Observatory, Australia. In June 2006, a 600B’ spectrum from 3200 Å to 5200 Å was obtained. In January 2009, a 300B’ spectrum was taken covering the wavelength range from 3200 Å to 6200 Å. The spectra were taken with the atmospheric dispersion along the slit to ensure that the relative absolute fluxes were accurately measured. The spectra were corrected for continuous atmospheric extinction and wavelength calibrated using Ne-Ar arc exposures. They were also divided by a continuous white dwarf spectrum to remove the spectrograph and dichroic response as described by Bessell (1999, 2007). The spectra were then scrunched and flux corrected using more than five spectrophotometric standards selected each night from the Next Generation Stellar Library STIS observations of Michael Gregg 222http://www.stsci.edu/hst/HST_overview/documents/calworkshop/workshop2005/papers/gregg.pdf as re-reduced by Heap and Lindler 333http://archive.stsci.edu/prepds/stisngsl/index.html . The relative absolute fluxes of the NGSL stars are precise to within two percent. The 300B and 600B spectra show excellent agreement.
3 Stellar parameters
A crucial ingredient in this investigation is the knowledge of HE 13272326’s evolutionary status. So far, it has not been possible to distinguish whether HE 13272326 is an MS or an SG star. Luckily, this has no significant impact on the abundances derived from minority species (like Ca i and Fe i) and only a small one for majority ones (like Ca ii, dex). For C, N and O, however, there are differences of up to dex between the two cases, as these abundances are exclusively derived from molecular features. Since the CNO abundances with respect to iron are extremely high in this star, these differences have not greatly hampered the interpretation of the overall abundance pattern. But with increasing sophistication of the modelling it is crucial to determine the evolutionary status of this star. This is also the case when comparing to predictions from stellar-structure models.
3.1 Effective temperature
From four broad-band indices calibrated on the infrared-flux method (IRFM) of Alonso et al. (1996), a mean effective temperature of = 6180 K was derived (Frebel et al., 2005; Aoki et al., 2006). Balmer lines in LTE seemed to favour a somewhat lower effective temperature, 6000 K, irrespective of the broadening theory applied (see Table 7 of Aoki et al. (2006)).
We have performed NLTE calculations for H i using the method described in Mashonkina et al. (2008). In brief, the model atom includes levels with principal quantum numbers up to = 19. Collisional rates include inelastic collisions with electrons and hydrogen atoms. For the latter, we use the formula of Steenbock and Holweger (1984). Since it provides only an order of magnitude estimate, we apply it with a scaling factor SH = 2 as favoured by the consistency of the effective temperatures derived from two Balmer lines, H and H, in four metal-poor ([Fe/H] ) stars (Mashonkina et al., 2008).
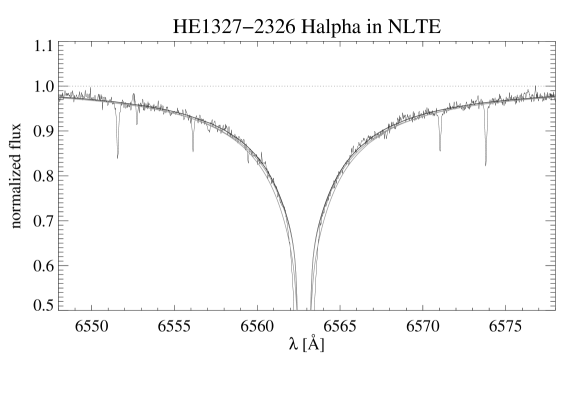
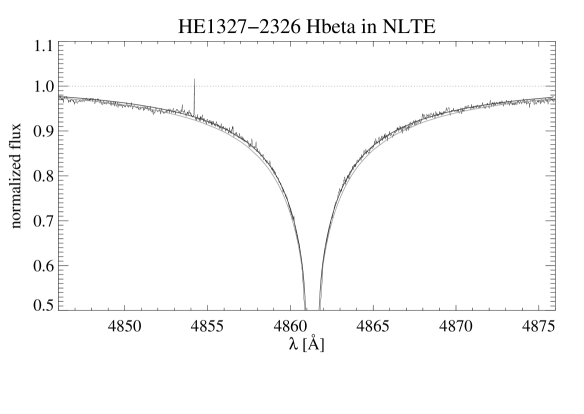
For the model atmospheres investigated in this study, the ground state and the level keep their thermodynamic-equilibrium level populations throughout the atmosphere. Fig. 1 shows the behaviour of the departure coefficients of the relevant levels of H i as a function of continuum optical depth referring to Å in the model with /log /[Fe/H] of 6180/3.7/4.34. Here, and are the statistical-equilibrium and thermal (Saha-Boltzmann) number densities, respectively. Departures from LTE for the level are controlled by H. In the layers where the continuum optical depth drops below unity H serves as the pumping transition resulting in an over-population of the upper level. For instance, around where the core-to-wing transition is formed. Starting from and further out, photon losses from the wings of Hα cause an under-population of the level. We obtain weak NLTE effects for the H profile beyond the core (which is not considered in the analysis), independent of the applied scaling factor for hydrogen collisions. For H, NLTE leads to a weakening of the core-to-wing transition compared to the LTE case. Exactly this part of profile is sensitive to variations.
Table 1 summarizes our determination. In NLTE, both H and H indicate an effective temperature close to = 6120 K (see Figs. 2 and 3) putting the new spectroscopic effective temperatures in much better agreement with the photometric estimates. For reasons of consistency with previous publications in this series, we adopt = 6180 K as our current best estimate (a significantly higher effective temperature seems possible using different calibrations of the IRFM (Ramírez and Meléndez, 2005) and we briefly discuss the impact of this scenario below).
3.2 Surface gravity

| star | H | H | erroraaestimated total error budget including observational uncertainties |
|---|---|---|---|
| HE 13272326 | 6120 K | 6120 K | 150 K |
| Sun | 5780 K | 5780 K | K, K |
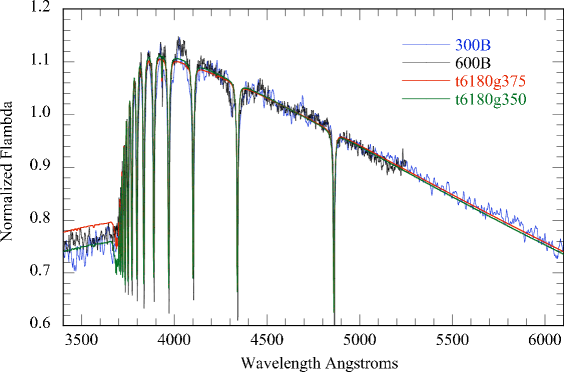

The surface gravity of hyper-metal-poor stars is, generally speaking, difficult to constrain observationally. The Balmer jump can serve as a photometric surface-gravity indicator (see, e.g., Önehag et al. (2008)). Figure 4 shows comparisons between the two DBS observations and model fluxes of two MARCS models (Gustafsson et al., 2008) with = 6180 K, [Fe/H] = and log between 3.5 and 3.75 ( was assumed). As the recent ‘300B’ spectrum was obtained in bright time, higher weight is given to the ‘600B’ observations. A spectrophotometric surface gravity of close to log = 3.65 is derived.
Ionization equilibria are a standard spectroscopic method of constraining log . The typical attainable precision is 0.3 dex when line-to-line scatter is of order 0.1 dex. The accuracy can be increased by considering NLTE effects. The present investigation of Ca i/ii in NLTE is based on our earlier work (Mashonkina et al., 2007) where atomic data and the problems of calcium line formation were considered in detail. The model atom used is up-to-date and includes effective collision strengths for Ca ii transitions from recent matrix calculations of Meléndez et al. (2007). Inelastic collisions with neutral H particles are accounted for using the formula of Steenbock and Holweger (1984) with a scaling factor = 0.1 as empirically determined from their different influence on Ca i and Ca ii lines in Solar and stellar spectra. As in the case of H, such a scaling is warranted, as the Steenbock and Holweger (1984) recipe yields collisional rates with large systematic uncertainties.
Non-LTE calculations are performed for two MAFAGS (Fuhrmann et al., 1997) model atmospheres with effective temperature = 6180 K and iron abundance [Fe/H] = 4.34, but with different surface gravities, log = 3.7 and 4.5 (the input calcium abundance is iteratively adjusted to match the derived value). The behaviour of the departure coefficients and the line source functions is similar for both models. In the first place, we are interested in the behaviour of the lower and upper levels from which the investigated lines, Ca i 4226 Å, Ca ii 3933 Å and Ca ii 8498 Å, arise. Figure 5 shows the departure coefficients of the selected levels as a function of continuum optical depth in the model 6180/3.7/4.34.
For the minority species Ca i, the main NLTE effect is over-ionization. It is caused by superthermal radiation of non-local origin below the thresholds of the Ca i ground state ( = 2028 Å) and the low-excitation levels ( = 2930 Å) and ( = 3450 Å). The Ca i resonance line is weaker relative to its LTE strength not only due to the general over-ionization but also due to the larger departure coefficient of the upper level compared to that for the lower one resulting in a line source function and diminished line absorption. The NLTE abundance correction = +0.31 dex and +0.25 dex for the models 6180/3.7/4.34 and 6180/4.5/4.34, respectively.
In the line formation layers, Ca ii dominates the element number density. No process seems to affect the Ca ii ground state population and keeps its thermodynamic-equilibrium value. Ca ii resonance-line pumping produces a slightly enhanced excitation of the level in the atmospheric layers between = 0.3 and 1.3. In the very metal-poor atmosphere of HE 13272326, the metastable level is only weakly coupled to the ground state and follows until photon losses in the Ca ii 8498 line start to become important. Departures from LTE for Ca ii 8498 are weak resulting in = 0.02 dex and 0.01 dex for the models 6180/3.7/4.34 and 6180/4.5/4.34, respectively. Because of the larger line strength (and thus shallower formation depth) of Ca ii 3933, this line suffers from somewhat larger NLTE effects: 0.15 dex and 0.06 dex for the subgiant and dwarf model, respectively.
| line | aaas determined from the the theoretical spectra after profile fitting | in NLTE | in LTE | in NLTE | in LTE |
|---|---|---|---|---|---|
| @ log = 3.7 | @ log = 3.7 | @ log = 4.5 | @ log = 4.5 | ||
| 3933 Å | 128.9 mÅ | 1.17 | 1.32 | 1.29 | 1.35bbIn this analysis, the fit is based on the wings, as the wings and core cannot be fitted simultaneously. |
| 4226 Å | 2.7 mÅ | 1.22 | 0.91 | 1.15 | 0.90 |
| 8498 Å | 9.6 mÅ | 1.27 | 1.29 | 1.56 | 1.57 |
| all lines 1 | 1.17cccorresponds to [Ca/Fe] = 0.47 on the scale of Aoki et al. (2006) 0.05 | 1.17 0.23 | 1.33ddcorresponds to [Ca/Fe] = 0.62 on the scale of Aoki et al. (2006) 0.21 | 1.27 0.34 |
We note that NLTE effects for Ca i/ii in 3D line formation calculations are currently unexplored. For the minority species Li i in metal-poor stellar atmospheres, Barklem et al. (2003) concluded that 3D + NLTE is not greatly different from 1D + NLTE with 1D + NLTE results overestimating the Li abundance by up to 0.1 dex. Similar effects can be expected for Ca i. For Ca ii, the departures from LTE are likely to be small, similar to the 1D case.
Table 2 summarizes the results concerning calcium. Good agreement (within 0.05 dex) is obtained for the three different lines when NLTE and a surface gravity of log = 3.7 are used (numerically, a slightly lower log value is indicated which we disregard for reasons explained in Sect. 4). At the dwarf-like surface gravity, the log -sensitive line Ca ii 8498 is more than 0.4 dex discrepant from Ca i 4226. From this and the line-to-line scatter we derive an uncertainty for log of 0.2 dex.
A rigourous NLTE modelling of Ca i/ii in 1D is thus capable of fully accounting for the Ca i/ii abundance discrepancy seen in previous analyses. HE 13272326 is therefore a subgiant, a conclusion in accord with indications from Balmer lines (see Aoki et al. (2006)). The [Ca/Fe] ratio is +0.47 dex which is not an unusual value for a halo star. HE 13272326 is a benchmark case for future NLTE studies for Ca i/ii in 3D model atmospheres.
We estimate the effects of crucial atomic data on the accuracy of the NLTE Ca abundances derived from Ca i 4226 and Ca ii 8498 (the two most critical lines for our purpose) using the model 6180/3.7/4.34. The largest effects are found upon disregarding hydrogenic collisions altogether. But even in that case, none of the line abundances changes by more than 0.1 dex and our conclusion about HE 13272326 being a subgiant holds.
4 Stellar-structure model predictions
4.1 Model description
The stellar evolutionary models used here are calculated with the physics of particle transport that is known from first principles. In radiative zones this implies taking into account atomic diffusion including gravitational settling, thermal diffusion and radiative accelerations, in addition to the purely diffusive term. The diffusion velocity of each species is computed with the equations as developed in Burgers (1969) which take into account the interactions between all diffusing species.
The detailed treatment of atomic diffusion is described in Turcotte et al. (1998). In these models, the Rosseland opacity and radiative accelerations are computed in each layer for the exact local chemical composition using OPAL monochromatic opacities and for each time step during the evolution. The radiative accelerations are from Richer et al. (1998) with corrections for redistribution from Gonzalez et al. (1995) and LeBlanc et al. (2000). Convection and semi-convection are modelled as diffusion processes as described in Richer et al. (2000) and Richard et al. (2001).
In one set of models, additional mixing is included in the diffusion equation by adding an effective diffusion coefficient as in Richer et al. (2000) and Richard et al. (2001). The parameters specifying this effective diffusion coefficients are indicated in the name assigned to the model, which are the same as those used in the Korn et al. (2007) study on NGC 6397. This additional mixing is introduced in an ad-hoc manner: here no attempt is made to connect it to physical processes like rotation. As shown by Richer et al. (2000), the most important factor is the radial extent of the mixed layers. All models considered here were assumed to be chemically homogeneous on the pre-main sequence with Solar relative mass fractions as given in Table 3. To mimic the abundance peculiarities of HE 13272326, the relative concentrations of the CNO elements were increased by +4 dex compared with the scaled Solar mixture. As the most abundant metals in HE 13272326, they have structural effects on the models.
4.2 Best-fitting models
| Element | Note | Mass fraction | |
|---|---|---|---|
| [Fe/H]=5.61, T6.0 | [Fe/H]=7.11, diffusive | ||
| H | 7.642 | 7.645 | |
| 4He | 2.354 | 2.354 | |
| 7Li | 2.0 | 2.0 | |
| 12C | aaincreased by +4 dex relative to the assumed solar mixture | 8.633 | 2.763 |
| N | aaincreased by +4 dex relative to the assumed solar mixture | 2.647 | 8.471 |
| O | aaincreased by +4 dex relative to the assumed solar mixture | 2.409 | 7.708 |
| Ne | 4.927 | 1.577 | |
| Na | 9.989 | 3.197 | |
| Mg | 1.875 | 6.002 | |
| Al | 1.623 | 5.194 | |
| Si | 2.023 | 6.473 | |
| P | 1.748 | 5.594 | |
| S | 1.056 | 3.380 | |
| Cl | 2.248 | 7.192 | |
| Ar | 2.697 | 8.631 | |
| K | 9.989 | 3.197 | |
| Ca | 1.873 | 5.994 | |
| Ti | 9.989 | 3.197 | |
| Cr | 4.994 | 1.598 | |
| Mn | 2.747 | 8.791 | |
| Fe | 3.586 | 1.147 | |
| Ni | 2.223 | 7.112 | |
| Z | 3.545 | 1.135 | |
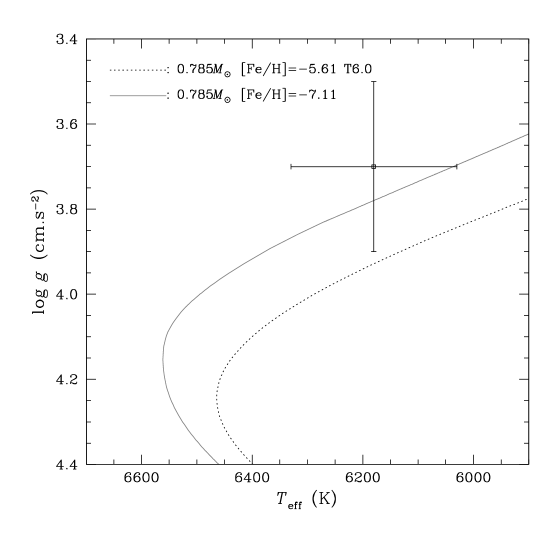
We computed a variety of models with masses around M⊙ for this study, both purely diffusive ones and ones including additional mixing. The mass and initial composition of each model was varied to roughly meet the observational constraints of HE 13272326: the surface abundance of iron should be within a factor of two of [Fe/H] = (the average of the 1D and 3D LTE abundances derived by Aoki et al. (2006) and Frebel et al. (2008a)) when the model star reaches the error ellipse of HE 13272326 on the subgiant branch after roughly 13 Gyr (see Figure 6).
Two models of 0.785 M⊙ fulfilled these a-posteriori requirements. The first one has an initial [Fe/H] of [Fe/H]i = and was computed with atomic diffusion and radiative accelerations, but without additional transport processes in the radiative zone. As shown by Richard et al. (2002) for higher metallicities (between and ), such a star is expected to display strong surface abundance variations close to and past the TOP. The second one ([Fe/H] = ) additionally includes additional transport as needed to explain abundance variations of NGC 6397 (Korn et al., 2006, 2007).
4.3 Birth-cloud vs. present-day abundances
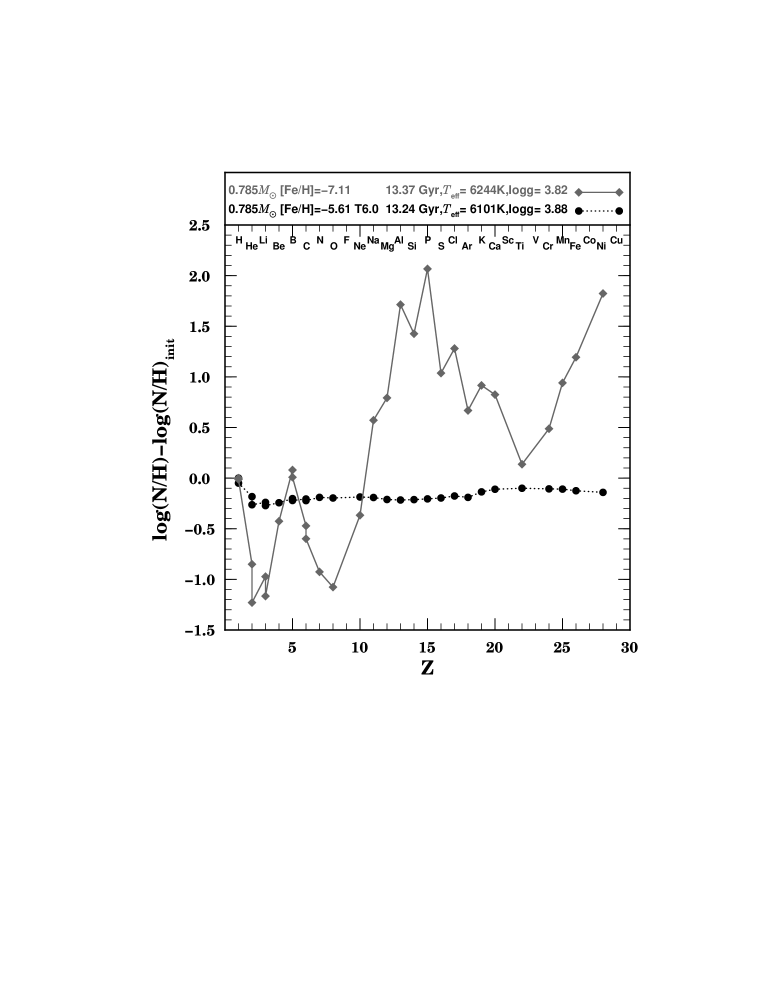
As can be seen from Figure 7, abundance corrections are large for the model with uninhibited diffusion: after 13.4 Gyr the M⊙ [Fe/H]i = model has reached the subgiant branch and its surface lithium is depleted by almost 1.2 dex. Simultaneously, radiative levitation has increased its convection-zone abundances of iron by 1.2 dex. Other elements, e.g. aluminium and nickel, are affected by an even larger amount. We compared the diffusion-corrected abundance pattern of HE 13272326 to that of HE 01075240 and find that the abundance patterns of the two stars do not become more similar. When additional mixing is introduced into the model, the surface-abundance changes are largely moderated: helium and lithium only settle by 0.3 dex (incidentally, the same amount as predicted for NGC 6397, Korn et al. (2007)), iron by only 0.1 dex.
If HE 13272326 turned out to be significantly hotter ( = 6450 K), then a surface gravity of log 4.0 would be derived in the framework of this analysis. From the stellar-structure point of view, this is a meaningful combination of stellar parameters (see Figure 6), albeit not supported by our understanding of the formation of Balmer lines. The same diffusion models could be used to predict corrections to the surface abundances and these would turn out to be quite similar within a given set of model assumptions. This is owed to the fact that the change in stellar parameters effectively moves the star along its fast early post-TOP evolutionary track.
Given our present ignorance of the extent of the additional mixing (and how it scales with, e.g., metallicity), it is difficult to draw firm conclusions about which of the two diffusion scenarios is more realistic. It is conceivable that the mixing efficiency declines towards lower metallicities, as the convective envelope decreases in extent and mass. Nonetheless, even in the absence of mixing the correction is not large enough to reconcile the upper limit on the lithium abundance () with the WMAP-based primordial lithium-abundance prediction of Big-Bang nucleosynthesis (, Spergel et al. (2007)). If the low lithium content of HE 13272326 turned out to be the rule among unevolved HMP star, then this may tell us something specific about the environment these stars were able to form in. More work is needed to identify similar stars in the outer halo.
Until better constraints can be set on the mixing efficiency, we recommend to use the abundance corrections based on the model with extra mixing. These corrections are moderate and generally negative. The birth cloud from which HE 13272326 formed was somewhat more metal-rich than the surface abundances of HE 13272326 show at the present time.
As discussed in Korn et al. (2007)), helium diffusion has a structural effect on the atmosphere of a star and can be mapped as a shift in the surface-gravity scale. The gravitational settling of helium entails a shift of the surface gravity of dex. This correction was considered when deriving our best current estimate of log = 3.7 0.2.
5 Conclusions
We have derived spectroscopic stellar parameters for HE 13272326 using 1D NLTE techniques: Balmer lines profiles in NLTE yield = 6120 150 K confirming the photometrically determined effective temperature of = 6180 K. The calcium ionization equilibrium in NLTE points towards a subgiant surface gravity of log = 3.7 0.2, as does spectrophotometry of the Balmer jump. Using an effective temperature of 6450 K (as favoured by a revision of the IRFM, Ramírez and Meléndez (2005)), results in a surface gravity typical for turn-off stars. While this is also a sensible stellar-parameter combination from the point of view of stellar evolution and the Ca i/ii ionization equilibrium, it finds no support from Balmer-line analyses.
The exploratory investigations into how much HE 13272326’s surface abundances may be affected by atomic diffusion show that large (more than 1 dex) corrections are in principle possible. The material from which HE 13272326 formed would then have been more metal-poor ([Fe/H]i ) and significantly more lithium-rich (). However, there is no compelling evidence in favour of uninhibited diffusion in stars that have convective envelopes. If additional mixing below the convective envelope is postulated (as needed to explain abundance trends in NGC 6397, Korn et al. (2007)), then the abundance corrections are limited to a factor of two. Assuming the additional-mixing efficiency to be independent of metallicity, the corrections are thus moderate given the uncertainties associated with present-day 1D-(N)LTE or 3D-LTE abundances of HE 13272326 and other HMP stars.
It is too early to draw firm conclusions about our ability to reliably read the chemical fingerprints in the atmospheres of stars like HE 13272326 and their nucleosynthetic significance as such. More such stars need to be identified in deep wide-angle surveys to leave the realm of low-number statistics. Efforts in this direction are under way. Systematic comparisons between chemical abundances in HMP dwarfs, subgiants and giants may then reveal the efficiency of mixing moderating atomic diffusion. Simultaneously, the modelling has to be improved. This will mean replacing the hydrostatic approximation with full radiation hydrodynamics, both in stellar-structure and stellar-atmosphere modelling. A similar transition is required for photospheric line-formation calculations in terms of statistical equilibria rather than LTE, as documented by the successes of this NLTE study.
References
- Alonso et al. (1996) Alonso, A., Arribas, S., and Martinez-Roger, C., 1996, A&A 313, 873
- Aoki et al. (2006) Aoki, W., Frebel, A., Christlieb, N., Norris, J. E., Beers, T. C., Minezaki, T., Barklem, P. S., Honda, S., Takada-Hidai, M., Asplund, M., Ryan, S. G., Tsangarides, S., Eriksson, K., Steinhauer, A., Deliyannis, C. P., Nomoto, K., Fujimoto, M. Y., Ando, H., Yoshii, Y., and Kajino, T., 2006, ApJ 639, 897
- Barklem et al. (2003) Barklem, P. S., Belyaev, A. K., and Asplund, M., 2003, A&A 409, L1
- Bessell (1999) Bessell, M. S., 1999, PASP 111, 1426
- Bessell (2007) Bessell, M. S., 2007, PASP 119, 605
- Charbonnel and Primas (2005) Charbonnel, C. and Primas, F., 2005, A&A 442, 961
- Christlieb et al. (2002) Christlieb, N., Bessell, M. S., Beers, T. C., Gustafsson, B., Korn, A., Barklem, P. S., Karlsson, T., Mizuno-Wiedner, M., and Rossi, S., 2002, Nature 419, 904
- Frebel et al. (2005) Frebel, A., Aoki, W., Christlieb, N., Ando, H., Asplund, M., Barklem, P. S., Beers, T. C., Eriksson, K., Fechner, C., Fujimoto, M. Y., Honda, S., Kajino, T., Minezaki, T., Nomoto, K., Norris, J. E., Ryan, S. G., Takada-Hidai, M., Tsangarides, S., and Yoshii, Y., 2005, Nature 434, 871
- Frebel et al. (2006) Frebel, A., Christlieb, N., Norris, J. E., Aoki, W., and Asplund, M., 2006, ApJ 638, L17
- Frebel et al. (2008a) Frebel, A., Collet, R., Eriksson, K., Christlieb, N., and Aoki, W., 2008a, ApJ 684, 588
- Frebel et al. (2008b) Frebel, A., Johnson, J. L., and Bromm, V., 2008b, MNRAS pp L137+
- Fuhrmann et al. (1997) Fuhrmann, K., Pfeiffer, M., Frank, C., Reetz, J., and Gehren, T., 1997, A&A 323, 909
- Gonzalez et al. (1995) Gonzalez, J.-F., LeBlanc, F., Artru, M.-C., and Michaud, G., 1995, A&A 297, 223
- Gustafsson et al. (2008) Gustafsson, B., Edvardsson, B., Eriksson, K., Jørgensen, U. G., Nordlund, Å., and Plez, B., 2008, A&A 486, 951
- Iwamoto et al. (2005) Iwamoto, N., Umeda, H., Tominaga, N., Nomoto, K., and Maeda, K., 2005, Science 309, 451
- Korn et al. (2006) Korn, A. J., Grundahl, F., Richard, O., Barklem, P. S., Mashonkina, L., Collet, R., Piskunov, N., and Gustafsson, B., 2006, Nature 442, 657
- Korn et al. (2007) Korn, A. J., Grundahl, F., Richard, O., Mashonkina, L., Barklem, P. S., Collet, R., Gustafsson, B., and Piskunov, N., 2007, ApJ 671, 402
- LeBlanc et al. (2000) LeBlanc, F., Michaud, G., and Richer, J., 2000, ApJ 538, 876
- Lind et al. (2008) Lind, K., Korn, A. J., Barklem, P. S., and Grundahl, F., 2008, A&A 490, 777
- Mashonkina et al. (2007) Mashonkina, L., Korn, A. J., and Przybilla, N., 2007, A&A 461, 261
- Mashonkina et al. (2008) Mashonkina, L., Zhao, G., Gehren, T., Aoki, W., Bergemann, M., Noguchi, K., Shi, J. R., Takada-Hidai, M., and Zhang, H. W., 2008, A&A 478, 529
- Meléndez et al. (2007) Meléndez, M., Bautista, M. A., and Badnell, N. R., 2007, A&A 469, 1203
- Meynet et al. (2006) Meynet, G., Ekström, S., and Maeder, A., 2006, A&A 447, 623
- Norris et al. (2007) Norris, J. E., Christlieb, N., Korn, A. J., Eriksson, K., Bessell, M. S., Beers, T. C., Wisotzki, L., and Reimers, D., 2007, ApJ 670, 774
- Önehag et al. (2008) Önehag, A., Gustafsson, B., Eriksson, K., and Edvardsson, B., 2008, ArXiv e-prints
- Ramírez and Meléndez (2005) Ramírez, I. and Meléndez, J., 2005, ApJ 626, 465
- Richard et al. (2001) Richard, O., Michaud, G., and Richer, J., 2001, ApJ 558, 377
- Richard et al. (2002) Richard, O., Michaud, G., and Richer, J., 2002, ApJ 580, 1100
- Richard et al. (2002) Richard, O., Michaud, G., and Richer, J., 2002, 580, 1100, Paper III
- Richard et al. (2005) Richard, O., Michaud, G., and Richer, J., 2005, ApJ 619, 538
- Richer et al. (1998) Richer, J., Michaud, G., Rogers, F., Iglesias, C., Turcotte, S., and LeBlanc, F., 1998, 492, 833
- Richer et al. (2000) Richer, J., Michaud, G., and Turcotte, S., 2000, 529, 338
- Richer et al. (2000) Richer, J., Michaud, G., and Turcotte, S., 2000, ApJ 529, 338
- Spergel et al. (2007) Spergel, D. N., Bean, R., Doré, O., Nolta, M. R., Bennett, C. L., Dunkley, J., Hinshaw, G., Jarosik, N., Komatsu, E., Page, L., Peiris, H. V., Verde, L., Halpern, M., Hill, R. S., Kogut, A., Limon, M., Meyer, S. S., Odegard, N., Tucker, G. S., Weiland, J. L., Wollack, E., and Wright, E. L., 2007, ApJS 170, 377
- Spite and Spite (1982) Spite, M. and Spite, F., 1982, Nature 297, 483
- Steenbock and Holweger (1984) Steenbock, W. and Holweger, H., 1984, A&A 130, 319
- Turcotte et al. (1998) Turcotte, S., Richer, J., Michaud, G., Iglesias, C. A., and Rogers, F. J., 1998, ApJ 504, 539
- Venn and Lambert (2008) Venn, K. A. and Lambert, D. L., 2008, ApJ 677, 572