Max-Planck-Institut für extraterrestrische Physik, Giessenbachstraße, 85748 Garching, Germany
11email: jsantos@oats.inaf.it
European Southern Observatory, Karl Schwarzschild Strasse 2, Garching bei Muenchen, D-85748, Germany
European Southern Observatory, Alonso de Cordova 3107, Casilla 19001, Santiago, Chile
E.O. Lawrence Berkeley National Laboratory, 1 Cyclotron Rd., Berkeley, CA 94720
Wachovia Corporation, NC6740, 100 N. Main Street, Winston-Salem, NC 27101
Astrophysikalisches Institut Potsdam (AIP), An der Sternwarte 16, D-14482 Potsdam, Germany
Department of Physics and Astronomy, Johns Hopkins University, Baltimore, MD21218, USA
Multi-wavelength observations††thanks: Based on observations carried out using the Advanced Camera for Surveys at the Hubble Space Telescope under Program ID 10496; the Very Large Telescope at the ESO Paranal Observatory under Program IDs 176.A-0589(A), 276.A-5034(A) and the New Technology Telescope at the ESO La Silla Observatory under Program ID 078.A-0265(B) of a rich galaxy cluster at z 1:
Abstract
Context. XMMU J1229+0151 is a rich galaxy cluster with redshift =0.975, that was serendipitously detected in X-rays within the scope of the XMM-Newton Distant Cluster Project. HST/ACS observations in the and passbands, as well as VLT/FORS2 spectroscopy were further obtained, in addition to follow-up Near-Infrared (NIR) imaging in J- and Ks-bands with NTT/SOFI.
Aims. We investigate the photometric, structural and spectral properties of the early-type galaxies in the high-redshift cluster XMMU J1229+0151.
Methods. Source detection and aperture photometry are performed in the optical and NIR imaging. Galaxy morphology is inspected visually and by means of Sersic profile fitting to the 21 spectroscopically confirmed cluster members in the ACS field of view. The - colour-magnitude relation (CMR) is derived with a method based on galaxy magnitudes obtained by fitting the surface brightness of the galaxies with Sersic models. Stellar masses and formation ages of the cluster galaxies are derived by fitting the observed spectral energy distributions (SED) with models based on Bruzual & Charlot 2003. Star formation histories of the early-type galaxies are constrained through the analysis of the stacked spectrophotometric data.
Results. The structural Sersic index obtained with the model fitting is in agreement with the visual morphological classification of the confirmed members, indicating a clear predominance of elliptical galaxies (15/21). The - colour-magnitude relation of the spectroscopic members shows a very tight red-sequence with a zero point of 0.860.04 mag and intrinsic scatter equal to 0.039 mag. The CMR obtained with the galaxy models has similar parameters. By fitting both the spectra and SED of the early-type population we obtain a star formation weighted age of 4.3 Gyr for a median mass of 7.4 M☉. Instead of an unambiguous brightest cluster galaxy (BCG), we find three bright galaxies with a similar magnitude, which are, in addition, the most massive cluster members, with 2 M☉. Our results strengthen the current evidence for a lack of significant evolution of the scatter and slope of the red-sequence out to z 1.
Key Words.:
galaxies: clusters: individual: XMMU J1229+0151 - galaxies: high-redshift1 Introduction
Distant (z1) galaxy clusters are unique astrophysical laboratories particularly suited to witness and study galaxy formation and evolution.
Detailed studies of the properties of galaxies in large samples of high-redshift clusters are required to distinguish the two main galaxy formation scenarios, which have been under discussion for more than 30 years. In the monolithic picture (Eggen et al. (1962); Larson (1974)), massive galaxies are expected to be formed early from a single progenitor. In contrast, the hierarchical scenario (Toomre (1977); White & Rees (1978)) predicts that elliptical galaxies should form later, through mergers. The behavior of early-type galaxies (ETGs), which are found to comprise both the most massive oldest systems, is the main cause for this debate. Indeed, it is now established that the star formation histories of ellipticals are mass-dependent from both observational (Thomas et al. (2005), van der Wel et al. (2005)) and theoretical studies (e.g. De Lucia et al. (2004), Menci et al. (2008)), such that low mass galaxies have more extended star formation histories than massive ones. This implies that the less massive galaxies have a lower formation redshift than the more massive systems, whose star formation histories are predicted to peak at z5 (De Lucia et al. (2006)). This scenario is commonly referred to as “” (Cowie et al. (1996)). Supporting this picture, there is strong observational evidence for the bulk of the stars in massive ellipticals to be already formed at redshift (van Dokkum (2005), Holden et al. (2005)).
The colour-magnitude relation (CMR, Visvanathan & Sandage (1977), Sandage & Visvanathan (1978)) is a fundamental scaling law used to assess the evolution of galaxy populations. The CMR of local clusters shows the existence of a tight Red Sequence (RS, Bower et al. (1992), de Propris et al. (1998)) (Gladders & Yee (2000), Baldry et al. (2004)) formed of massive red elliptical galaxies undergoing passive evolution, and the analysis of its main parameters (zero point, scatter and slope) provides a means to quantify the evolution of the galaxies properties with redshift. It remains, nevertheless, unclear to what degree the CMR is determined by age and metallicity effects.
The study of high- samples of galaxies is also important to provide information for the modelling of physical processes in semi-analytical techniques. Semi-analytical modelling (SAM) employing AGN feedback to prevent the overproduction of blue galaxies have recently succeeded in predicting a large amount of massive old galaxies (De Lucia et al. (2006), Bower et al. (2006), Menci et al. (2006), Croton et al. (2006), Somerville et al. (2008)), however, several issues remain yet to be solved, such as the incapability to reproduce quantitatively the colour-bimodality in the colour-magnitude diagram and the scatter of the red-sequence, which is overestimated by a factor 2-3 (e.g. Menci et al. (2008)).
The exceptional high-resolution provided by the Advanced Camera for Surveys (ACS) at the Hubble Space Telescope (HST) has greatly contributed to the current knowledge on the evolution of galaxies in dense environments. Results on the eight z1 clusters of the ACS Intermediate Redshift Cluster Survey (Blakeslee et al. (2003); Mei et al. (2007), Holden et al. (2005), Mei et al. (2009) and references therein), and studies of individual distant clusters (RDCS 1252.9-2927 at =1.235: Lidman et al. (2004), Demarco et al. (2007); XMMU J2235.3-2557 at =1.393: Rosati et al. (2009), Lidman et al. (2008); XMMXCS J2215.9-1738 at z=1.45, Stanford et al. (2006)) point toward the prevalence of a tight RS up to =1.4, where the CMR slope and scatter are observed to have a negligible increase with redshift.
In this paper we provide a detailed analysis of the galaxy properties in XMMU J1229+0151 (hereafter, XMM1229), an X-ray selected, optically rich and distant cluster (=0.975 corresponding to a lookback time of 7.6 Gyr). We derive accurate colour measurements from the high-resolution ACS data, and characterize the galaxy morphology via visual inspection and by fitting Sersic profiles. Stellar masses, ages and star formation histories of the cluster’s early-types are derived by fitting the coadded spectrophotometric data with Bruzual & Charlot (2003) templates.
The paper is organized as follows: in Sect. 2 we present the imaging and spectroscopic data, as well as reduction procedures. The ACS morphological analysis is introduced in Sect. 3. In Sect. 4 we derive the CMR, and the results from the SED fitting are presented in Section 5. In Sect. 6 we investigate the properties of the brightest cluster galaxies. We conclude in Sect. 7.
The cosmological parameters used throughout the paper are =70 km/s/Mpc, =0.7 and =0.3. Filter magnitudes are presented in the AB system unless stated otherwise.
2 Observations and data reduction
2.1 XMM-Newton data
The cluster XMM1229 was initially detected in a serendipitous cluster survey of the XMM-Newton archive, the XMM-Newton Distant Cluster Project (XDCP, Böhringer et al. (2005), Fassbender (2008)). Our target was observed in 25 XMM-Newton pointings of the bright radio loud quasar 3C 273 at an off-axis angle of approximately 13 arcmin. We selected only observations whose exposure time, after cleaning for high background periods, was larger than 10 ks. Unfortunately, XMM1229 was not observed by the EPIC-pn camera, since the pn was always operated in Small Window Mode (except for Obs_Id=0126700201, having a clean exposure time of only ks). Therefore, we used only the data from the two XMM/MOS CCDs. The 11 observations selected for our analysis are listed in Table LABEL:log-xmm. The information given is the following: observation date (column 1), XMM-Newton observation identification number (column 2) and revolution (column 3), filter (M=medium, T=thin) and mode (F=full window, S=small window) used (column 4), good exposure time of XMM/MOS1+MOS2, after cleaning for high particle background periods (column 5).
Data were processed using the XMM-Newton Science Analysis Software (SAS v7.0.0). Light curves for pattern=0 events in the keV band were produced to search for periods of background flaring, which were selected and removed by applying a 3 clipping algorithm. Light curves in the keV band were visually inspected to remove residual soft-proton induced flares. We selected events with patterns 0 to 12 (single, double and quadruple) and further removed events with low spectral quality (i.e. FLAG=0). We obtained total exposure times of and ks for the XMM/MOS1 and XMM/MOS2, respectively.
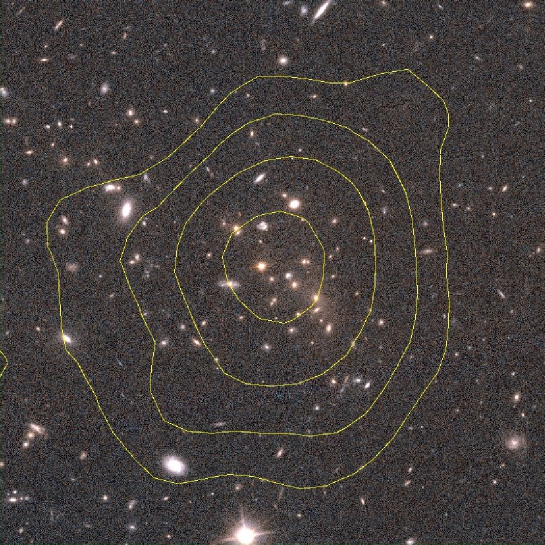
The spectra of the cluster were extracted from a circular region of radius arcsec centered at RA=12:29:29.2, Dec=+01:51:26.4. The background was estimated from a circular region on the same chip of radius arcmin centered at RA=12:29:21.2, Dec=+01:51:55.4, after removing cluster and point sources.
We corrected vignetting effects using the SAS task EVIGWEIGHT (Arnaud et al. (2001)) to calculate the emission weighted effective area, by assigning a weight to each photon equal to the ratio of the effective area at the position of the photon with respect to the on-axis effective area. Redistribution matrices were generated using the SAS task RMFGEN for each pointing, filter, and detector.
Time averaged spectra for the source and the background were obtained by adding the counts for each channel. Since different filters were used for the observations, we weighted each instrument effective area (ARF) and redistribution matrix (RMF) with the exposure time of the observation. In order to use the minimization in the spectral fitting we binned the spectra with a minimum number of 20 counts per bin.
| Date | Obs. Id. | Rev. | Filt./Mode | Texp [ks] |
|---|---|---|---|---|
| (1) | (2) | (3) | (4) | (5) |
| 2000-06-13 | 0126700201 | 0094 | M/F | 11.7+11.6 |
| 2000-06-14 | 0126700301 | 0094 | M/F | 56.4+56.1 |
| 2000-06-15 | 0126700601 | 0095 | M/S | 24.0+23.7 |
| 2000-06-16 | 0126700701 | 0095 | M/S | 17.5+17.8 |
| 2000-06-18 | 0126700801 | 0096 | M/S | 40.8+41.1 |
| 2001-06-13 | 0136550101 | 0277 | T/S | 40.1+40.1 |
| 2003-07-07 | 0159960101 | 0655 | T/S | 51.3+54.6 |
| 2004-06-30 | 0136550801 | 0835 | T1-M2/S | 14.3+47.7 |
| 2005-07-10 | 0136551001 | 1023 | M/S | 26.9+26.7 |
| 2007-01-12 | 0414190101 | 1299 | M/S | 57.3+55.5 |
| 2007-06-25 | 0414190301 | 1381 | M/S | 26.8+26.2 |
2.1.1 Spectral analysis
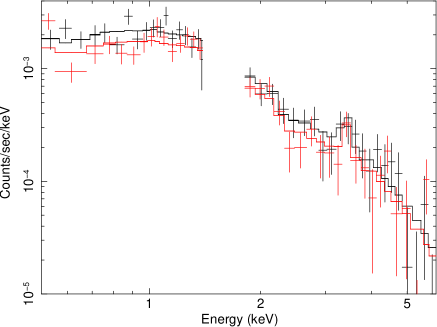
The two XMM/MOS spectra were analyzed with XSPEC v11.3.1 (Arnaud (1996)) and were fitted with a single-temperature mekal model (Kaastra (1992); Liedahl et al. (1995)). We modeled Galactic absorption with tbabs (Wilms et al. (2000)). We always refer to values of solar abundances as in Anders & Grevesse (1989).
The fits were performed over the keV band. We excluded energies below 0.5 keV, due to calibration uncertainties, and above 6 keV, where the background starts to dominate. Furthermore, due to the relatively low S/N of the observations, we notice that instrumental K emission lines111http://xmm.vilspa.esa.es/external/xmm_user_support/documentation /uhb/node35.html from Al (at keV) and Si (at keV) may affect the spectral analysis significantly. Therefore, we also excluded photons in the energy range keV from our spectral analysis. In the selected energy bands we have a total of and net counts for the XMM/MOS1 and XMM/MOS2, respectively.
The free parameters in our spectral fits are temperature, metallicity, redshift and normalization, although we also performed the fit freezing the redshift to 0.975, the median spectroscopic redshift of the confirmed galaxies. Local absorption is fixed to the Galactic neutral hydrogen column density, as obtained from radio data (Dickey & Lockman (1990)).
| Detector | kT [keV] | ZFe [Z⊙] | z | /d.o.f. |
|---|---|---|---|---|
| (1) | (2) | (3) | (4) | (5) |
| MOS1 | ||||
| MOS2 | ||||
| MOS1+2 | ||||
| MOS1+2 |
-
1 fixed redshift
The results of the spectral analysis are listed in Table LABEL:xmm-results, where the quoted errors are at the 1- confidence level. The information provided is the following: detector used, (column 1), temperature (column 2), iron abundance (column 3), redshift (column 4), and number of degrees of freedom (column 5). The last line of the table refers to the spectral fit with the redshift set to 0.975.
The rest-frame luminosity corrected for Galactic absorption in the keV range is erg s-1, for an aperture of 30 arcsec radius, which corresponds to a physical size of 240 kpc. To obtain the total cluster luminosity we resort to extrapolating the measured aperture luminosity to a radius of 2 Mpc, assuming an isothermal -model (Cavaliere & Fusco-Femiano (1976)), a well-known analytical formula dependent on a slope and a core radius , that describes to a good degree the surface brightness profile of regular clusters. Unfortunately, the signal-to-noise ratio is not good enough to fit a -model, therefore we assume that XMM1229 is a cluster with a standard X-ray morphology i.e., without signs of merging or a strong cool core, and we use the typical values =0.7 and =250 kpc, obtaining LX (r2 Mpc) erg s-1.
2.2 HST/ACS and band imaging
In the framework of the Supernova Cosmology Project (Dawson et al., (2009)) we obtained the HST/ACS Wide Field Camera (WFC) data. Images in the F775W () and F850LP () passbands centered on the cluster X-ray centroid were acquired in December 2006, with total exposures of 4110 sec and 10940 sec respectively. The and are the most efficient filters in supernova searches and, although they are not optimal for a cluster at this redshift, the encloses the D4000 break, which is redshifted to 7920 Å at the cluster redshift. ACS has a field of view (FoV) of 3.3 x 3.3 arcmin and a pixel scale of 0.05”/pix. The images were processed using the ACS GTO pipeline (Blakeslee et al. (2003)), with a interpolation kernel. The photometric zero points are equal to 34.65 and 34.93 in the and bands respectively, following the prescription of Sirianni et al. (2005). To account for the galactic extinction we applied to our photometric catalog the correction factor =0.017 retrieved from the NASA Extragalactic Database222http://nedwww.ipac.caltech.edu/ and using the dust extinction maps from Schlegel et al. (1998). The corresponding correction in the optical bands is E(-)=0.010 mag.
2.3 VLT/FORS2 spectroscopy
Spectroscopic observations were carried out with Focal Reducer and Low Dispersion Spectrograph (FORS2: Appenzeller et al. (1998)) on Antu (Unit 1 of the ESO Very Large Telescope (VLT)) as part of a program to search for very high redshift Type Ia supernova in the hosts of early type galaxies of rich galaxy clusters (Dawson et al., (2009)). In this respect, the field XMMU J1229+0151 was very rich in candidates, with three candidates occurring during the three months monitoring. One candidate was identified as a Type Ia supernova at the cluster redshift (Dawson et al., (2009)).
FORS2 was used with the 300I grism and the OG590 order sorting filter. This configuration has a dispersion of 2.3 Angstroms per pixel and provides a wavelength range starting at 5900 Å and extending to approximately 10000 Å. Since the observations had to be carried out at short notice (the SN had to be observed while it was near maximum light), most of the observations were done with the multi-object spectroscopic (MOS) mode of FORS2. The MOS mode consists of 19 moveable slits (with lengths that vary between 20” and 22”) that can be inserted into the focal plane. The slit width was set to 1”. On one occasion, when the MOS mode was unavailable because of technical reasons, the field was observed with the MXU mode of FORS2. The MXU mode consists of precut mask that is inserted into the FORS2 focal plane once the field has been acquired. Since the length of the slit can be made much shorter in the MXU mode than in the MOS mode, the number of targets that could be observed in the MXU mode was a factor of two larger than the number of targets that could be observed in the MOS mode. However, the time to prepare, cut and insert a mask is usually a couple of days, whereas the MOS observations can be done with a few hours notice.
The field of XMMU J1229+0151 was observed with four different configurations, 4 MOS and one MXU. The details of the observations are given in Table LABEL:forslog. The MOS configurations were used when the supernovae (there were three supernova visible in the field of XMMU J1229+0151 at the same time) were near maximum light. The MXU mask was used several months later when the supernovae were significantly fainter. In all masks, slits were placed on the supernova, thus spectra of the supernovae together with their hosts and spectra of the hosts without the supernovae were obtained. The other slits were placed on candidate cluster galaxies or field galaxies. For each MOS setup, between 4 and 9 exposures of 700 to 900 seconds were taken. Between each exposure, the telescope was moved a few arc seconds along the slit direction. These offsets, which shift the spectra along detector columns, allow one to remove detector fringes, as described in Hilton et al. (2007), which also details how the FORS2 data was processed.
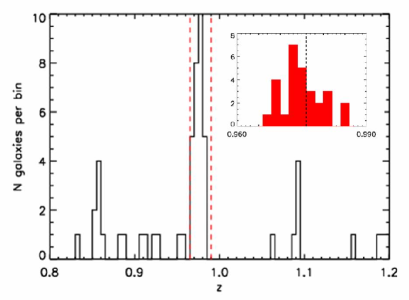
A total of 100 slits over four masks were used to observe 74 individual targets. The targets were selected by colour and magnitude, using the R- and z-band pre-imaging. Priority 1 targets had (R-z)1.8 and z23. Priority 2 targets had 1.8(R-z)1.6 and z23. Some cluster members were observed in more than one mask. From these 74 targets, 64 redshifts were obtained, and 27 of these are cluster members - the redshift distribution of the targets in shown in Fig. 3. A total of 21 confirmed galaxies are within the FoV of ACS.
| Mask | Type | Slits | Grism & Filter | Texp | Airmass | Date |
|---|---|---|---|---|---|---|
| (s) | (UT) | |||||
| 1 | MOS | 12 | 300I+OG590 | 8 x 750 | 1.3 | 2006 Jan 01 |
| 2 | MOS | 18 | 300I+OG590 | 8 x 700 | 1.2 | 2006 Jan 30 |
| 3 | MOS | 18 | 300I+OG590 | 4 x 700 | 1.1 | 2006 Jan 31 |
| 4 | MOS | 18 | 300I+OG590 | 4 x 700 | 1.2 | 2006 Feb 01 |
| 5 | MXU | 34 | 300I+OG590 | 9 x 900 | 1.3 | 2006 Jun 20-21 |
Cluster membership was attributed by a reasonable selection of galaxies within 2000 km/s relative to the peak of the redshift distribution, or 3-. We assign the mean value of the redshift distribution of the 27 cluster members to the cluster redshift, =0.975 and assume a conservative redshift error =10-3. The cluster velocity dispersion was determined with the 27 galaxy redshifts, using the software ROSTAT of Beers et al. (1990). We obtained =68362 km/s, where the error refers to the formal bootrap error obtained with 1000 samples. This value is in perfect agreement with the result obtained using the methodology proposed by Danese et al. (1980).
Even though we have a limited number of cluster members which could introduce a bias in our computation of due to the presence of substructures we, nevertheless, investigate the connection between the state of the hot intra-cluster medium (ICM) and the cluster galaxy population by means of the well-known Temperature- relation (e.g. Wu et al. (1999)). The observed T- relation for high- clusters (e.g. Rosati et al. (2002)) implies that we would expect a higher velocity dispersion of about 900300 km/s for the cluster temperature. We note however that there is a significant scatter in the T- relation, and our value is within the 30% scatter.
In Table LABEL:spec we list the cluster members. The information provided is the following: galaxy ID (column 1); RA (column 2) and DEC (column 3); redshift (column 4); spectral classification (column 5) and morphological type (column 6). The spectral classification is done according to the scheme proposed in Dressler et al. (1999), based on the strength of the [OII] and Hδ lines. The k class refers to passive (no [OII] emission) galaxies. This class is subdivided in two types, depending on the strength of the Hδ lines: k+a have moderate (3 EW Hδ 8) Hδ absorption, and a+k show strong (EW Hδ 8) Hδ absorption. The e spectral class refers to galaxies with [OII] emission and is subdivided into three types: e(a) present strong Balmer absorption, e(c) have weak or moderate Balmer absorption, and e(b) show very strong [OII] lines.
| ID | RA (J2000) | DEC (J2000) | z | Class | Type |
|---|---|---|---|---|---|
| (1) | (2) | (3) | (4) | (5) | (6) |
| 5417 | 187.3857875 | 1.8712528 | 0.977 | a+k | S0 |
| 3428 | 187.3793000 | 1.8563222 | 0.984 | a+k | S0 |
| 3430 | 187.3720375 | 1.8560639 | 0.974 | k | Ell |
| 3025 | 187.3771333 | 1.8363889 | 0.979 | e(c) | Ell |
| 4055 | 187.3573750 | 1.8601056 | 0.968 | k | Sb |
| 3301 | 187.3466250 | 1.8502667 | 0.969 | e(c) | Ell |
| 4155 | 187.3885500 | 1.8644889 | 0.969 | k+a | Ell |
| 5411 | 187.3718958 | 1.8717778 | 0.974 | k | Ell |
| 20008 | 187.3734583 | 1.8726667 | 0.973 | e(a) | Irr |
| 3497 | 187.3724875 | 1.8579083 | 0.982 | a+k | Ell |
| 20010 | 187.3726625 | 1.8579944 | 0.977 | k | Ell |
| 4126 | 187.3900292 | 1.8628750 | 0.973 | k | Ell |
| 3507 | 187.3716250 | 1.8571444 | 0.976 | k | Ell |
| 20013 | 187.3684167 | 1.8559167 | 0.979 | k | Ell |
| 20014 | 187.3654583 | 1.8485556 | 0.969 | k | S0 |
| 3949 | 187.3696083 | 1.8602611 | 0.976 | k | Ell |
| 30004 | 187.3697875 | 1.8601389 | 0.970 | k | S0/Ell |
| 3495 | 187.3715708 | 1.8582111 | 0.980 | k | Ell |
| 3524 | 187.3807000 | 1.8676667 | 0.969 | a+k | Ell |
| 5499 | 187.3844542 | 1.8683722 | 0.973 | k | Ell |
| 3205 | 187.3747292 | 1.8461806 | 0.984 | a+k | Ell |
| 4661a | 187.3631292 | 1.8977194 | 0.975 | k+a | – |
| 5001a | 187.3500083 | 1.8870944 | 0.973 | k | – |
| 4956a | 187.3367208 | 1.8890611 | 0.978 | k | – |
| 4794a | 187.3342500 | 1.8927333 | 0.974 | k | – |
| 4910a | 187.3213042 | 1.8925528 | 0.976 | e(b) | – |
| 4800a | 187.3186708 | 1.8948944 | 0.976 | k | – |
-
a galaxy outside the FoV of ACS
2.4 NTT/SOFI J- and Ks-band imaging
NIR imaging in the J- and Ks-bands were acquired using SOFI (Moorwood et al. (1998)) at the New Technology Telescope (NTT) at the ESO/La Silla observatory. The observations were taken in March 2007, as part of the NIR follow-up of the XDCP survey programme. The instrument was operated in the Large field mode, corresponding to a 5x5 arcmin FoV, with a pixel scale of 0.288 arsec/pix. Since the NIR background is generally highly variable, a large dithering pattern has to be applied, thus we set the automatic jitter box to a width of 30 arcsec. Total exposure times amount to 1hr in Ks and 45 min in J. The J-band data have a seeing of 0.98” whereas the Ks-band have an image quality of 0.69”.
Photometric calibration standards (Persson et al. (1998)) were acquired several times during the observation run. The zero points (ZP) were computed using the reduced standards (background subtracted, count rate image) with the following relation:
| (1) |
where refers to the standard star magnitude, and refers to the wavelength dependent atmospheric correction. The stellar flux was measured within circular apertures with 6” radius; such a large radius ensures that we account for the bulk of the flux. The background was estimated with a 3 clipping algorithm. The scatter of the zero points is 0.015 mag and 0.04 mag for the J and Ks filter, respectively. We converted VEGA magnitudes to the AB photometric system with the ESO web-tool available at .
3 Structural analysis
3.1 Surface brightness profile fitting
The radial surface brightness profiles of galaxies can be described by the Sersic law (Sersic (1968)),
| (2) |
where is the surface brightness at radius , the Sersic index, , characterizes the degree of concentration of the profile; and the effective radius, , corresponds to the projected radius enclosing half of the galaxy light.
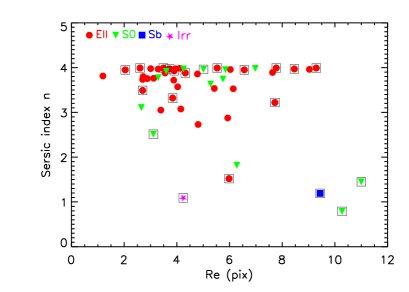
Using the ACS and data we made a 2D bulge/disk galaxy decomposition with the software GIM2D (Simard et al. (2002)). The galaxy model is the sum of a bulge component (Sersic profile) and an exponential disk, depending on a total of eleven parameters. Of these parameters, three describe the shape of the Sersic profile, including the index , which we constrained to 04. The upper bound is introduced because =4 corresponds to the de Vaucouleurs profile, a purely empirical fit to the profiles of elliptical galaxies and bulges (de Vaucouleurs (1961)). Allowing larger values of usually does not improve the fit, however the covariance between and can lead to an overestimation of for large (Blakeslee et al. (2006)). The median Sersic index of the spectroscopically confirmed galaxies is 3.9 and the median effective radius is 5.5 pixel (0.28”).
The distribution of is consistent in both bands within the 1- errors, with an average error of 0.77 and 0.53 pix in the and band respectively. The comparison between the effective radii obtained in the two bands () - () is shown in Fig. 5. This difference is useful to assess an imperfect matching of the PSFs or the presence of colour gradients. However, we find a very good agreement between the two radii therefore we do not expect those effects. In this figure we also present the results of fitting a ”red-sequence” sample of early-type galaxies which is introduced in Sect. 4.2. The reduced of the best-fit models is 1 for the majority of the galaxies, emphasizing the good quality of the fit.

3.2 Visual morphological classification
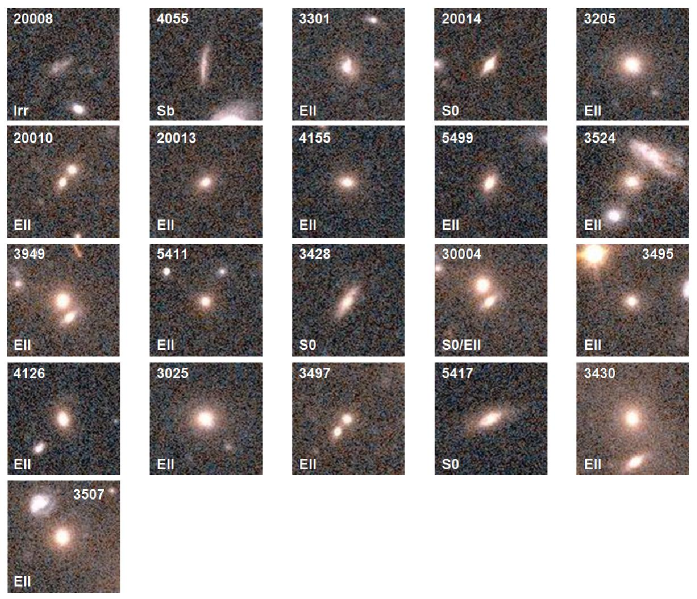
In addition to the profile fitting, we made a visual classification of the spectroscopic members using morphological templates from Postman et al. (2005). In Fig. 4 we show postage stamps of the cluster members in the passband labelled with the morphological type. We note two red galaxy pairs (ID=20010/3497, 30004/3949). In Fig. 6 we show the distribution of the fit parameters and of both the spectroscopic and ”red-sequence” samples (see Sect. 4.2 for details on the latter), complemented with the visual classification.
The morphology of the spectroscopic galaxies in XMM1229 is clearly dominated by elliptical galaxies (15/21) with only one galaxy classified as spiral (ID=4055) and one irregular (ID=20008), unlike other distant clusters (see for eg. the EDisCS high-redshift sample, 0.8, De Lucia et al. (2004)). The remaining four cluster members are classified as S0s. We stress that we targeted red galaxies for spectroscopy, hence this was a colour, not a morphological selection, therefore we do not expect to have a bias on ellipticals with respect to S0s.
4 The colour-magnitude relation
4.1 Galaxy photometry
We use SExtractor in dual image mode to perform the source detection in the band, and the photometry in both bands. The image quality of the band is sightly better than the band, with a Point Spread Function (PSF) FWHM of 0.085“, as opposed to 0.095” in the . The effect of the PSF broadening has been investigated in other works (e.g. Mei et al. (2006)) and is attributed to the long-wavelength halo of the ACS/WFC (Sirianni et al. (2005)). This effect, although small, bears implications on the galaxy colour measurement and has to be accounted for. Thus, for each passband we constructed empirical PSFs by computing the median profile of a handful of stars in the science images for which we measure growth curves normalized to the central intensity. We obtain a differential (-) median radial profile that shows a steep behavior for radii smaller than 3 pix - see Fig. 7.

The colour is determined in small apertures to avoid intrinsic galaxy colour gradients (see e.g. Scodeggio (2001) for a discussion on the effect of internal colour gradients). We choose a fixed aperture of 5 pix (0.25”) since at this radius the steep and uncertain PSF broadening is no longer dominant (see Fig. 7), and we apply a correction of 0.034 mag to the band in order to match the poorer seeing of the band. Total band magnitudes are obtained with SExtractor parameter MAGAUTO.
4.2 Colour-magnitude relation
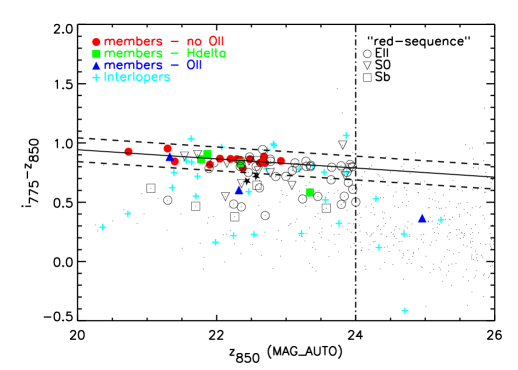
The colour-magnitude relation is presented in Fig 8. We flag the 35 confirmed interlopers in the ACS field (cyan crosses), since nearly a fourth of them (9/35) are located on the red-sequence.
We perform a robust linear fit using bi-square weights (Tuckey’s Biweight) to the CMR of the confirmed passive members. The bi-square weights are calculated using the limit of 6 outlier-resistant standard deviations. The process is performed iteratively until the standard deviation changes by less than the uncertainty of the standard deviation of a normal distribution. The linear fit has a slope of -0.0390.013 and a zero point CMRZP=0.860.04, which was determined with a bi-weighted mean. The quoted uncertainty on the slope corresponds to the estimated standard deviation of the fit coefficient. The scatter of the CMR including only the passive galaxies is 0.039 mag.
Since the spectroscopic sample does not populate well the faint end of the red-sequence, we selected a ”red-sequence” sample, based on a combination of morphological and colour criteria. We applied a generous colour cut of 0.5 1.3 for 20 24, based on the properties of the bluest star forming cluster galaxies and the magnitude limit set by Postman et al. (2005) to ensure a reliable morphological classification. In addition, we constrained the search radius to 1’ from the cluster X-ray center, corresponding to 478 kpc at the cluster redshift. This is a reasonable area to search for cluster members, and avoids contamination of non-members. We can also express this radius as a fraction of the fiducial radius which was estimated using the X-ray scaling relations of Arnaud et al. (2005). Thus, we determine the search radius of 478 kpc to be equal to 0.4.
We found 58 galaxies in this region which were visually classified using the templates from Postman et al. (2005). The selection of the red-sequence galaxies was based on the 3- clipping of the linear fit to the confirmed passive members. Thirty-one galaxies are the region delimited by the 3- clipping, for a magnitude cut at 24 mag. Again the fraction of ellipticals, 22/31, is much larger than the fraction of S0s, 9/31. The scatter of the red-sequence combining the two samples (spectroscopic and ”red-sequence”) is equal to 0.048 mag.
4.3 Model colour-magnitude relation
Traditionally, galaxy colours are measured either using aperture magnitudes with corrections which take into account PSF differences, or by using aperture magnitudes after deconvolving the PSF as, for e.g., in Blakeslee et al. (2003). Instead, in this work we explored a method to derive galaxy colours based on model magnitudes, as commonly used in the Sloan Digital Sky Survey (e.g. Blanton et al. (2005)). In this method, the PSFs of the 2 filters (which are estimated independently in the two bands as described in the previous section) are convolved with the galaxy profile models. Hence, this is a direct method were convolution and deconvolution is performed. We therefore use the surface brightness best-fit models with additional gaussian noise to measure aperture and total magnitudes. Similarly to the ”data” CMR (Sect. 4.2), the colour measurements are performed in fixed apertures with r=5 pix. An alternative approach would be to measure aperture magnitudes over the individual galaxy effective radius, however this strategy proved unreliable since for many galaxies is smaller than 3 pix (0.15”), which is really too small to make a proper colour measurement. Total magnitudes were derived using apertures with radius of 10 instead of using SExtractor MAGAUTO, which we found to be inaccurate in comparison with large aperture magnitudes. These discrepancies are visible in the total magnitude of the brightest galaxies in the two CMR’s represented in Figs. 8 and 9.
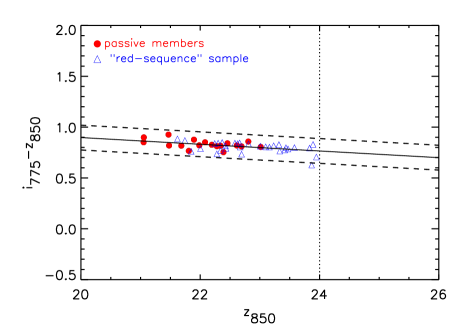
The procedure to fit the CMR and obtain its zero point is identical to the method described earlier in Sect. 4.2, only that now we use both the early-type cluster members and the ”red-sequence” sample. If we consider only the confirmed passive members to perform the linear fit we obtain a zero point CMRZP=0.830.04, a slope of -0.0310.016 and a scatter equal to 0.0420.011. The error of the scatter is estimated with 100 Monte Carlo simulations of the galaxy models, varying the Sersic index and the effective radius within the 1- confidence errors. The uncertainty associated with the scatter is estimated by fitting a gaussian to the distribution of the scatter measured in the models and assigning the standard deviation of the distribution to the error. In order to perform a composite linear fit to both the spectroscopic and ”red-sequence” samples we applied a magnitude cut at =24 mag, a limit that ensures a reliable visual classification of the ”red-sequence” sample (see for e.g. Postman et al. (2005)). We obtain a CMR zero point equal to 0.810.04, the total intrinsic scatter slightly increases to 0.050 mag and the slope, -0.0310.008, remains nearly unchanged.
We would like to remark that the scatter of the colour-magnitude relations derived from SAM is a factor 2-3 larger than the observational scatter (see for e.g. Menci et al. (2008)). In semi-analytical modelling the scatter is obtained by computing the total galaxy magnitudes, which is precisely known in simulations. A possible reason for the discrepancy between the observational scatter and the one obtained with simulations is the existence of colour gradients which are taken into account in the total galaxy magnitudes used in SAM to measure the scatter, whereas in the observations we limit the colour measurement to a small central aperture, thus minimizing the effect of such gradients. To investigate this effect we measured the colour of the passive members using the galaxy models, increasing the fixed colour aperture to r=10,15 pix, respectively 0.5”, 0.75” - going beyond these radii would produce noisy measurements since we would run into the background. The corresponding scatter is then 0.068, 0.088, respectively. This result suggests the presence of colour gradients in the galaxy sample.
5 Analysis of the spectral energy distributions
The observed spectral energy distribution of a galaxy is a record of its stellar population history. The SED fitting method relies on the comparison of the observed SED with synthetic SED’s. The latter are then convolved with the transmission curves of the filters used in the observations and the output magnitudes are compared with the observed magnitudes. Galaxy SED’s were determined by measuring the flux within a fixed aperture of 3 arcsec in the four available passbands.
Given the large disparity in the resolution of the ground- and space-based data, a careful matching of the different PSFs must be done, when constructing the multi-wavelength catalog for sampling the galaxies’ SEDs. The method we used to derive aperture corrections is the following: we smoothed the , and Ks-band images with gaussian kernels to match the seeing of the J-band (1”) and made growth curves of stars in the original and degraded (smoothed) images. We then obtained a differential median radial profile for each band with which we derive corrections at a given radius. In the multi-colour catalog we use galaxy magnitudes corrected to match the fluxes to the worst seeing image (J-band), measured within 0.5” radius apertures for the ACS bands, and 1.16” for the NIR data. We opted to work with magnitudes extrapolated to 3” radius, which safely enclose the bulk of the galaxy flux.
A total of 20 spectroscopic members are common to the FoV of SOFI and ACS, four of which constitute two red galaxy pairs that are not properly resolved in the NIR data. For this reason we had to exclude them from the spectral analysis. Only four of the remaining 16 studied galaxies show [OII] emission lines (IDs: 3025, 3205, 3301, 4055) signaling ongoing star formation, and the first two also present [OIII] lines. The first three galaxies have been visually classified as ellipticals, although galaxy 3301 has a low Sersic index, =1.5. Galaxy ID=4055 is an edge-on spiral which is reflected in the low Sersic index (=1.2).
Additionally, we also fitted the SEDs of the ETGs in the ”red-sequence” sample lying on the ACS CMR red-sequence. As mentioned earlier, we find 31 ETG in the locus of the red-sequence. The poorer quality of the NIR data can only resolve 18 of these galaxies.
5.1 Spectrophotometric properties: masses, ages
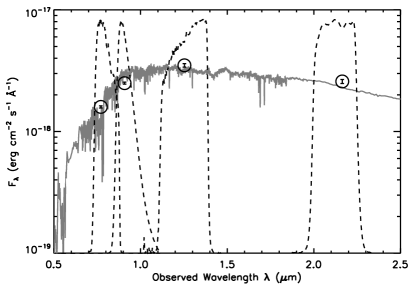
Stellar masses, ages and star formation histories are derived from the synthetic galaxy fluxes, assuming solar metallicity and a Salpeter (Salpeter (1955)) initial mass function (IMF), with a mass cut off [0.1-100] M☉. We perform a three parameter (age T, , mass) fit to the SEDs using a grid of Bruzual & Charlot (2003) models characterized by a delayed exponential star formation rate: , performing a minimization of the . The parameter spans a range of [0.2- 5.8] Gyr, where 5.8 Gyr is the age of Universe at the cluster redshift. As an example, in Fig. 10 we present the fit to the SED of 3025, one of the three brightest galaxies (see Sect.6), together with the filter transmission curves.
The star formation (SF) weighted age represents the mean age of the bulk of the stars in a galaxy (depending on the parameter), and is defined as:
| (3) |
where is the star formation rate expressed as
| (4) |
The parameter A refers to the amplitude of an instantaneous burst at time , as described in Gobat et al. (2008). Galaxy SF weighted ages do not change significantly if other models (Maraston (2005)) and different IMF’s are used (Chabrier (2003), Kroupa & Weidner (2003)), however the stellar masses are dependent on the chosen IMF.


| Galaxy ID | Mass ( M☉) | tSFR Age (Gyr) |
|---|---|---|
| (1) | (2) | (3) |
| 3301 | 5.3 | 4.09 |
| 4055 | 1.8 | 3.94 |
| 20014 | 2.4 | 1.18 |
| 20013 | 4.9 | 4.18 |
| 5411 | 6.4 | 4.55 |
| 3507 | 26 | 5.74 |
| 3495 | 7.4 | 4.46 |
| 3430 | 23 | 5.74 |
| 3205 | 8.3 | 3.86 |
| 3524 | 18 | 5.99 |
| 3428 | 6.5 | 4.27 |
| 3025 | 20 | 4.85 |
| 5417 | 8.9 | 3.49 |
| 5499 | 8.3 | 4.27 |
| 4155 | 6.8 | 4.43 |
| 4126 | 6.8 | 2.50 |
The spectroscopic cluster members form a fairly old population, with a median SF weighted age of 4.3 Gyr, and with stellar masses in the range 4-2.3 M☉, see Table LABEL:sed for the listing of the fitted masses (column 2) and ages (column 3). The ”red-sequence” sample, which allows us to probe fainter galaxies, appears to be less massive, with a median stellar mass of 5.5 M☉. However, since we do not have redshifts for these galaxies, we cannot draw strong conclusions about their masses and formation ages.
In Fig. 11 we investigate the correlation between the star formation weighted age and stellar mass content in both the spectroscopic (filled circles) and ”red-sequence” samples (open circles). We find a strong mass-age correlation which is confirmed with a Spearman rank of 0.61 with a significance of 1.410-4 ( is a value lying in the range [0.0 - 1.0], where =0 indicates a very significant correlation and =1 means no correlation). This mass-age correspondence evidences a well-known anti-hierarchical behavior (), where the most massive galaxies are also the oldest.
We also investigate the dependence of the galaxy radial distance to the cluster center with mass and SF weighted age. We find that the most massive elliptical galaxies populate the cluster core, and conversely the four late-type galaxies are situated at the periphery of the cluster, at about 1 arcmin from the center, indicating star formation taking place in these regions. This morphological segregation is well established at lower redshifts (e.g. Biviano et al. (2002)), nonetheless it is interesting to note that at redshift 1, the late type galaxies are already settled at the outskirts of the cluster. This segregation was also found by Demarco et al. (2005) and Homeier et al. (2005) in the study of a cluster with z=0.837, as well as in RDCS 1252.9-2927 at z=1.234 (Demarco et al. (2007)). The dependence of the star formation weighted age with the cluster centric distance (Fig. 12) shows that the galaxy age scatter increases at larger radii. This is indicative of younger/more diverse SF histories for galaxies located in the outer regions of the cluster, which have presumably accreted later onto the cluster. This result has also been found in other work, e.g. Mei et al. (2009).
Finally, we analyze the relation between the colour and the mass (Fig. 13) and we observe the expected trend of the most massive galaxies being redder.
5.2 Star formation histories
The spectra of 12 confirmed passive members were coadded to obtain the stacked spectrum. However, four (ID=3428, 3524, 4155 and 5417) of these 12 galaxies have strong Hδ absorption, EW(Hδ) 3 (these are a+k/k+a spectral types, see Table LABEL:spec) and therefore we removed them from the stacking procedure. Three of these galaxies are at about 1 arcmin from the X-ray cluster center and only galaxy (ID=3428) is closer to the core, at 0.5 arcmin from the center. In Fig. 14 we present the coadded spectrum of 8 spectroscopic passive members with weak or no Hδ absorption. The best-fit SED is shown in green and the spectral fit is shown in red.
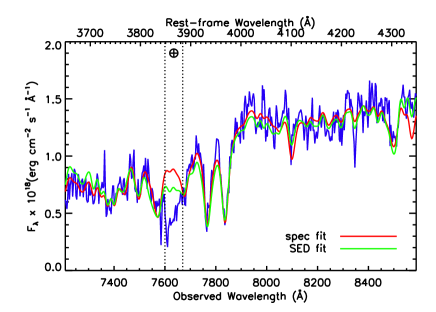
Star formation histories were derived only for the eight galaxies which do not have significant Hδ absorption. The star formation weighted age and formation redshift obtained by the best fitting models (i.e. those within the 3- confidence), is 3.7 Gyr and = 3.0 0.5 respectively, when using the combined spectrophotometric data. It is not surprising that there is discrepancy between the average age obtained by fitting the individual SEDs (4.3 Gyr) and that derived from the composite spectrophotometric data, as we are using the spectrum and SED to place complementary constraints on the star formation histories (the former has resolution but poor wavelength coverage, while the latter has coverage but poor resolution). This discrepancy can stem from the fact that the SED unfortunately does not probe the rest-frame UV and would be thus somewhat insensitive to recent star formation.
6 Is there a Brightest Cluster Galaxy?
The cores of rich galaxy clusters most often host a massive and bright giant elliptical galaxy - the brightest cluster galaxy (BCG). In XMM1229, instead of one prominent BCG, we find three bright galaxies within 0.5 mag. The total z850-band magnitudes are derived by integrating the best-fit surface brightness model to a large radius, r=10. In Table LABEL:tbcg we summarize the most relevant characteristics of these galaxies: total z850 magnitude from best-fit model (column 2), distance to the X-ray cluster center (column 3), photometric mass (column 4), star formation weighted age (column 5). As expected, the three bright galaxies are the most massive galaxies, with masses of the order of 2 M☉. The galaxy ID=3025 located at 1.3“ from the cluster center shows strong [OII] emission, indicating ongoing star formation which is confirmed by a lower star formation weighted age of 4.85 Gyr, approximately 1 Gyr younger than the other two brightest galaxies. In addition, this galaxy is fainter by 0.2 mag in Ks and 0.15 mag in J, with respect to the other two bright galaxies.
| ID | z850 mag | dist [”] | Mass [ M☉] | Age [Gyr] |
|---|---|---|---|---|
| (1) | (2) | (3) | (4) | (5) |
| 3025 | ||||
| 3430 | ||||
| 3507 |
7 Discussion and conclusions
XMMU J1229+0151 is a rich, X-ray luminous galaxy cluster at redshift =0.975, that benefited from a good multi-wavelength coverage and is therefore an adequate laboratory for studying galaxy evolution. The high quality ACS imaging data combined with the FORS2 spectra allowed us to derived accurate galaxy photometry, and the with the additional NIR J- and Ks-bands we performed an SED analysis.
-
•
From the X-ray spectral analysis we obtained a global cluster temperature of 6.4 keV and a luminosity =1.3 erg s-1, indicating that XMM1229 is a massive cluster. Fixing the redshift to the spectroscopic value we obtain the metal abundance Z/Z☉ = 0.34 .
-
•
We measured the cluster velocity dispersion using the 27 galaxy redshifts obtained with FORS2, =68362 km/s. The velocity dispersion is below the one expected from the mean T- relation (Rosati et al. (2002)) for the cluster temperature, however it is still within the large scatter of the relation.
-
•
Using the morphological templates of M. Postman we made a visual classification of the cluster galaxies. This evaluation indicates a predominance of ellipticals (15/21), with only four members classified as S0, one irregular galaxy and one late-type Sb galaxy. In order to investigate whether the shortage of S0s and also to populate the faint end of the cluster red-sequence, we constructed a ”red-sequence” sample, based on the galaxies morphology, colour and total magnitude. We find that the fraction of ellipticals in the locus of the red-sequence pertaining to the latter galaxy sample, 22/31, is a factor three larger than the the number of S0s in the spectroscopic sample (9/31). Furthermore, there are two pairs of red galaxies in the spectroscopic sample.
-
•
In addition to the visual assessment we also fitted Sersic models to the surface brightness profiles of the two galaxy samples. The distribution of the best-fit structural parameters peaks at 3.9 suggesting a majority of bulge dominated galaxies. The median effective radius is 0.275”, approximately the radius chosen for measuring the - colour (r=0.25”).
-
•
Two methods were explored to measure the scatter of the CMR: in a first approach, as standard in the literature, we correct the different PSFs of the and bands to measure accurate galaxy aperture magnitudes, and in an alternative approach, we use the best-fit galaxy model magnitudes obtained by fitting the surface brightness profiles. The CMR at this high redshift is found already to be very tight, with an intrinsic scatter of 0.04 mag when taking into account only the passive members, a spread which is similar to the local clusters, thus confirming that the cluster ETGs assembled early on and in short timescales. The scatter of the red-sequence is essentially the same from these two independent methods, showing that the second method is robust against uncertainties arising from PSF corrections. The slope of the red-sequence including only the cluster members is -0.0310.016, and slightly decreases to -0.0220.008 when accounting also for the ”red-sequence” galaxies.
These results are in agreement with the conclusions drawn from the ACS Intermediate Redshift Cluster Survey (see e.g., Mei et al. (2006), Blakeslee et al. (2003), Mei et al. (2009)), where no significant redshift evolution was found in the CMR scatter and slope. It is worth noting that in the referred papers, galaxy colours were measured in apertures of variable size corresponding to the effective radius.
-
•
The spectrophotometric analysis shows a red-sequence populated by moderately massive galaxies, with a median stellar mass of 7.4 M☉. The combined SED + spectral fit to the stacked spectrum of the passive members allowed us to constrain the ages of the ETGs to 3.7 Gyr, corresponding to a formation redshift , similarly to other z 1 clusters (e.g Gobat et al. (2008))
-
•
The inferred star formation histories imply that the cluster galaxies have completed most of the chemical enrichment, which is consistent with the high metal abundance of the ICM, Z 1/3 Z☉, as derived from our X-ray analysis (see Table LABEL:xmm-results).
- •
Acknowledgements.
We acknowledge the excellent support provided by the staff at the Paranal observatory. In particular, we wish to acknowledge their assistance in setting up the observations with the MXU mode of FORS2 when technical problems prevented us from using the MOS mode. We thank M. Postman for providing us with his templates for the galaxy morphological classification. JSS would like to thank D. Pierini, M. Nonino, S. Borgani and M. Girardi for useful discussions. JSS acknowledges support by the Deutsche Forschungsgemeinschaft under contract BO702/16-2. RG acknowledges support by the DFG cluster of excellence “Origin and Structure of the Universe” (www.universe-cluster.de). This research has made use of the NASA/IPAC Extragalactic Database (NED) which is operated by the Jet Propulsion Laboratory, California Institute of Technology, under contract with the National Aeronautics and Space Administration.References
- Appenzeller et al. (1998) Appenzeller, I., et al. 1998, The Messenger, 94, 1
- Anders & Grevesse (1989) Anders, E., & Grevesse, N. 1989, Geochim. Cosmochim. Acta., 53, 197
- Arnaud (1996) Arnaud, K. A. 1996, Astronomical Data Analysis Software and Systems V, 101, 17
- Arnaud et al. (2001) Arnaud, M., Neumann, D. M., Aghanim, N., Gastaud, R., Majerowicz, S., & Hughes, J. P. 2001, A&A, 365, L80
- Arnaud et al. (2005) Arnaud, M., Pointecouteau, E., & Pratt, G. W. 2005, A&A, 441, 893
- Baldry et al. (2004) Baldry, I. K., Glazebrook, K., Brinkmann, J., Ivezić, Ž., Lupton, R. H., Nichol, R. C., & Szalay, A. S. 2004, ApJ, 600, 681
- Beers et al. (1990) Beers, T. C., Flynn, K., & Gebhardt, K. 1990, AJ, 100, 32
- Bertin & Arnouts (1996) Bertin, E., & Arnouts, S. 1996, A&AS, 117, 393
- Biviano et al. (2002) Biviano, A., Katgert, P., Thomas, T., & Adami, C. 2002, A&A, 387, 8
- Blakeslee et al. (2003) Blakeslee, J. P., et al. 2003, ApJ, 596, L143
- Blakeslee et al. (2003) Blakeslee, J. P. et al. 2003, in ASP Conf. Ser. 295, Astronomical Data Analysis Software and Systems XII, ed. G. Piotto, G. Meylan, S. G. Djorgovski, & M. Riello (San Francisco: ASP), 257
- Blakeslee et al. (2006) Blakeslee, J. P., et al. 2006, ApJ, 644, 30
- Blanton et al. (2005) Blanton, M. R., Eisenstein, D., Hogg, D. W., Schlegel, D. J., & Brinkmann, J. 2005, ApJ, 629, 143
- Böhringer et al. (2005) Böhringer, H., Mullis, C., Rosati, P., Lamer, G., Fassbender, R., Schwope, A., & Schuecker, P. 2005, The Messenger, 120, 33
- Bower et al. (1992) Bower, R. G., Lucey, J. R., & Ellis, R. S. 1992, MNRAS, 254, 589
- Bower et al. (2006) Bower, R. G., Benson, A. J., Malbon, R., Helly, J. C., Frenk, C. S., Baugh, C. M., Cole, S., & Lacey, C. G. 2006, MNRAS, 370, 645
- Bruzual & Charlot (2003) Bruzual, G., & Charlot, S. 2003, MNRAS, 344, 1000
- Chabrier (2003) Chabrier, G. 2003, PASP, 115, 763
- Cavaliere & Fusco-Femiano (1976) Cavaliere, A., & Fusco-Femiano, R. 1976, A&A, 49, 137
- Cowie et al. (1996) Cowie, L. L., Songaila, A., Hu, E. M., & Cohen, J. G. 1996, AJ, 112, 839
- Croton et al. (2006) Croton, D. J., et al. 2006, MNRAS, 365, 11
- Danese et al. (1980) Danese, L., de Zotti, G., & di Tullio, G. 1980, A&A, 82, 322
- Dawson et al., (2009) Dawson, K., et al. in prep (2009).
- De Lucia et al. (2004) De Lucia, G., Kauffmann, G., & White, S. D. M. 2004, MNRAS, 349, 1101
- De Lucia et al. (2006) De Lucia, G., Springel, V., White, S. D. M., Croton, D., & Kauffmann, G. 2006, MNRAS, 366, 499
- De Lucia & Blaizot (2007) De Lucia, G., & Blaizot, J. 2007, MNRAS, 375, 2
- de Vaucouleurs (1961) de Vaucouleurs, G. 1961, ApJS, 5, 233
- Demarco et al. (2005) Demarco, R., et al. 2005, A&A, 432, 381
- Demarco et al. (2007) Demarco, R., et al. 2007, ApJ, 663, 164
- de Propris et al. (1998) de Propris, R., Eisenhardt, P. R., Stanford, S. A., & Dickinson, M. 1998, ApJ, 503, L45
- Dressler et al. (1999) Dressler, A., Smail, I., Poggianti, B. M., Butcher, H., Couch, W. J., Ellis, R. S., & Oemler, A. J. 1999, ApJS, 122, 51
- Dickey & Lockman (1990) Dickey, J. M., & Lockman, F. J. 1990, ARA&A, 28, 215
- Eggen et al. (1962) Eggen, O. J., Lynden-Bell, D., & Sandage, A. R. 1962, ApJ, 136, 748
- Fassbender (2008) Fassbender, R. 2008. ArXiv e-prints, 806.
- Gladders & Yee (2000) Gladders, M. D., & Yee, H. K. C. 2000, AJ, 120, 2148
- Gobat et al. (2008) Gobat, R., Rosati, P., Strazzullo, V., Rettura, A., Demarco, R., & Nonino, M. 2008, A&A, 488, 853
- Hilton et al. (2007) Hilton, M., et al. 2007, ApJ, 670, 1000
- Holden et al. (2005) Holden, B. P., et al. 2005, ApJ, 626, 809
- Homeier et al. (2005) Homeier, N. L., et al. 2005, ApJ, 621, 651
- Kaastra (1992) Kaastra, J., 1992, Internal SRON-Leiden Report, updated version 2.0
- Kauffmann & Charlot (1998) Kauffmann, G., & Charlot, S. 1998, MNRAS, 294, 705
- Kodama et al. (2004) Kodama, T., et al. 2004, MNRAS, 350, 1005
- Kroupa & Weidner (2003) Kroupa, P., & Weidner, C. 2003, ApJ, 598, 1076
- Larson (1974) Larson, R. B. 1974, MNRAS, 166, 585
- Lidman et al. (2004) Lidman, C., Rosati, P., Demarco, R., Nonino, M., Mainieri, V., Stanford, S. A., & Toft, S. 2004, A&A, 416, 829
- Lidman et al. (2008) Lidman, C., et al. 2008, A&A, 489, 981
- Liedahl et al. (1995) Liedahl, D. A., Osterheld, A. L., & Goldstein, W. H. 1995, ApJ, 438, L115
- Maraston (2005) Maraston, C. 2005, MNRAS, 362, 799
- Mei et al. (2006) Mei, S., et al. 2006, ApJ, 644, 759
- Mei et al. (2007) Mei, S., et al. 2007, ApJ, 655, 144
- Mei et al. (2009) Mei, S., et al. 2009, ApJ, 690, 42
- Menci et al. (2006) Menci, N., Fontana, A., Giallongo, E., Grazian, A., & Salimbeni, S. 2006, ApJ, 647, 753
- Menci et al. (2008) Menci, N., Rosati, P., Gobat, R., Strazzullo, V., Rettura, A., Mei, S., & Demarco, R. 2008, ApJ, 685, 863
- Moorwood et al. (1998) Moorwood, A., Cuby, J.-G., & Lidman, C. 1998, The Messenger, 91, 9
- Persson et al. (1998) Persson, S. E., Murphy, D. C., Krzeminski, W., Roth, M., & Rieke, M. J. 1998, AJ, 116, 2475
- Postman et al. (2005) Postman, M., et al. 2005, ApJ, 623, 721
- Press & Schechter (1974) Press, W. H., & Schechter, P. 1974, ApJ, 187, 425
- Rosati et al. (2002) Rosati, P., Borgani, S., & Norman, C. 2002, ARA&A, 40, 539
- Rosati et al. (2009) Rosati, P. et al. 2009, in preparation
- Salpeter (1955) Salpeter, E. E. 1955, ApJ, 121, 161
- Sandage & Visvanathan (1978) Sandage, A., & Visvanathan, N. 1978, ApJ, 225, 742
- Scodeggio (2001) Scodeggio, M. 2001, AJ, 121, 2413
- Schlegel et al. (1998) Schlegel, D. J., Finkbeiner, D. P., & Davis, M. 1998, ApJ, 500, 525
- Sersic (1968) Sersic, J. L. 1968, Cordoba, Argentina: Observatorio Astronomico, 1968,
- Simard et al. (2002) Simard, L., et al. 2002, ApJS, 142, 1
- Sirianni et al. (2005) Sirianni, M., et al. 2005, PASP, 117, 1049
- Somerville et al. (2008) Somerville, R. S., Hopkins, P. F., Cox, T. J., Robertson, B. E., & Hernquist, L. 2008, MNRAS, 391, 481
- Stanford et al. (2006) Stanford, S. A., et al. 2006, ApJ, 646, L13
- Thomas et al. (2005) Thomas, D., Maraston, C., Bender, R., & Mendes de Oliveira, C. 2005, ApJ, 621, 673
- Toomre (1977) Toomre, A. 1977, Evolution of Galaxies and Stellar Populations, 401
- van der Wel et al. (2005) van der Wel, A., Franx, M., van Dokkum, P. G., Rix, H.-W., Illingworth, G. D., & Rosati, P. 2005, ApJ, 631, 145
- van Dokkum (2005) van Dokkum, P. G. 2005, AJ, 130, 2647
- Vandame (2004) Vandame, B. 2004, Ph.D thesis, Nice University, France
- Visvanathan & Sandage (1977) Visvanathan, N., & Sandage, A. 1977, ApJ, 216, 214
- White & Rees (1978) White, S. D. M., & Rees, M. J. 1978, MNRAS, 183, 341
- Wilms et al. (2000) Wilms, J., Allen, A., & McCray, R. 2000, ApJ, 542, 914
- Wu et al. (1999) Wu, X.-P., Xue, Y.-J., & Fang, L.-Z. 1999, ApJ, 524, 22