Probing the mass loss history of the yellow hypergiant IRC+10420
Abstract
We have used the sub-millimeter array to image the molecular envelope around IRC+10420. Our observations reveal a large and clumpy expanding envelope around the star. The molecular envelope shows a clear asymmetry in 12CO J=2–1 emission in the South-West direction. The elongation of the envelope is found even more pronounced in the emission of 13CO J=2–1 and SO JK=65–54. A small positional velocity gradient across velocity channels is seen in these lines, suggesting the presence of a weak bipolar outflow in the envelope of IRC+10420. In the higher resolution 12CO J=2–1 map, we find that the envelope has two components: (1) an inner shell (shell I) located between radius of about 1”-2”; (2) an outer shell (shell II) located between 3” to 6” in radius. These shells represent two previous mass-loss episodes from IRC+10420. We attempt to derive in self-consistent manner the physical conditions inside the envelope by modelling the dust properties, and the heating and cooling of molecular gas. We estimate a mass loss rate of 9 10-4 M⊙ yr-1 for shell I and 7 10-4 M⊙ yr-1 for shell II. The gas temperature is found to be unusually high in IRC+10420 in comparison with other oxygen-rich envelopes. The elevated gas temperature is mainly due to higher heating rate, which results from the large luminosity of the central star. We also derive an isotopic ratio 12C/13C = 6.
1 Introduction
Yellow hypergiants are rare objects which are post-red supergiants rapidly evolving in blue-ward loops in the Hertzsprung-Russell diagram (de Jager 1998). A few of such objects are found to have prodigous mass loss, leading to the formation of thick circumstellar envelopes. The study of the circumstellar envelope around them is very important to provide insight into the mass loss process from these massive stars and the evolution of stars themselves.
The star IRC+10420 is classified as yellow hypergiant (de Jager 1998). Based on spectroscopic monitoring, the star initially classified as spectral type F8 I in 1973 (Humphreys et al. 1973), has evolved into spectral type A in 1990 (Oudmaijer et al. 1996, Klochkova et al. 1997). Strong emission lines such as the Balmer series and Ca II triplets are seen in its optical spectrum (Oudmaijer 1998). Broad wings seen in H and Ca II triplets suggest a large outflow velocity in a massive wind close to the stellar surface. High resolution optical images of IRC+10420 (Humphreys et al. 1997) revealed a complex circumstellar environment with many features such as knots, arcs or loops. Lacking kinematic information, however, the real three dimensional structure of the envelope can not be inferred. Recently, through integral-field spectroscopy of H emission line, Davies et al. (2007) show strong evidence for axi-symmetry in the circumstellar envelope.
The molecular envelope around IRC+10420 is very massive and is a rich source of molecular lines (Quintana-Lacaci et al. 2007). The mass loss rate estimated from CO observations is at the upper end seen toward evolved stars, up to a few times 10-4 M⊙ yr-1 (Knapp & Morris 1985, Oudmaijer et al. 1996). High denisty tracers such as ammonia (NH3) and HCN lines have been detected (Menten & Alcolea, 1995). Molecules typical of oxygen-rich envelope such as SO and SO2 (Sahai & Wannier 1992, Omont et al. 1993) are known to be present. IRC+10420 is also a strong OH maser source, exhibiting both the main lines (1665 MHZ and 1667 MHz) maser and the satelite line (1612 MHz) maser. By comparison with typical OH/IR stars, IRC+10420 has the warmest envelope harboring OH masers (Humphreys et al. 1997). High angular resolution imaging of the OH masers by Nedoluha & Bowers (1992) shows that the maser emissions are distributed in an oblate expanding shell measuring 1″.5 in radius. Recently, Castro-Carrizo et al. (2007) presented high angular resolution (3″ and 1″.4) mapping of the envelope around IRC+10420 in 12CO J=1–0 and J=2–1 lines. Their observations reveal an expanding but complex molecular envelope with an inner cavity around the central star, implying a recent dramatic decrease in the mass loss from IRC+10420. In addition, the shell shows some elongation in the North-East to South-West direction, suggesting a non-spherical symmetry in the mass loss process. From excitation analysis of 12CO lines, Castro-Carrizo et al. (2007) show the presence of two separate shells with mass loss in the range 1.2 10-4 to 3 10-4M⊙ yr-1. Interestingly, the gas temperature in shells derived from their model fitting is unusually high, 100 K even at the large radial distance of 2 1017 cm.
The distance to IRC+10420 is still uncertain. From analysis of photometric and polarimetric data, Jones et al. (1993) conclude that IRC+10420 is located at a large distance, between 4 to 6 kpc. Here we adopt a distance to IRC+10420 of 5 kpc, similar to that adopted in Castro-Carrizo et al. (2007).
In this paper we present high angular resolution observations of the molecular envelope around IRC+10420. We also perform detailed modelling to derive in a self-consistent manner the dust properties and molecular gas temperature profile in the envelope.
| Table 1: Basic data of IRC+10420 and its molecular envelope | ||
| R.A. (J2000) | 19h26m4803 | (1) |
| Dec. (J2000) | 1121167 | (1) |
| Distance | 5 kpc | (2) |
| Angular scale | 1 5000 AU 7.5 1016 cm | |
| Luminosity L∗ | 6 105 L⊙ | (2) |
| Spectral Type | mid-A type | (3,4) |
| Effective Temperature Teff | 7000 K | (3) |
| Stellar radius | 1.66 Au | |
| Systemic velocity | VLSR = 74 kms-1 | (3) |
| Expansion velocity | Vexp = 40 kms-1 | (3) |
| Mass loss rate | 6.5 10-4 M⊙ yr-1 | (5) |
2 Observations
We have observed IRC+10420 in the 1.3mm band with the SubMillimeter Array (SMA) at two different epochs and in two different configurations as summarized in Table 2. The first observation was carried out on 2004 June 21st, with 8 antennas in an extended configuration, giving projected baselines from 27 to 226 m. The weather was good during the observation with zenith atmospheric opacity of at 225 GHz and the system temperatures ranged between 200 and 600 K. The second observation was carried on 2005 July 2nd, with 7 antennas in a compact configuration, giving projected baselines in the range from 11 to 69 m. The weather was very good with and the system temperatures ranged between 100 and 200 K.
In each observation, the correlator of the SMA was configured in the normal mode with two 2-GHz bandwidth windows separated by 10 GHz. This allowed us to cover simultaneously the 12CO J=2-1 line in the upper sideband (USB) the 13CO J=2-1 and SO 65-54 lines in the lower sideband (LSB). The bandpass of individual antennas was calibrated using the quasar 0423-013 for the observation taken in 2004 and Uranus for observation taken in 2005. To improve the S/N of the data, we smoothed data from the instrumental spectral resolution of 0.8125 MHz to 3.25 MHz (i.e. 4 km s-1). For comparison, the observed lines have velocity widths of ( km s-1). The nearby quasars 1751+096 and 1925+211 were observed at regular intervals to correct for gain variations of the antennas due to atmospheric fluctuations. The data reduction and calibration were done under MIR/IDL111http://cfa-www.harvard.edu/cqi/mircook.html. After the gain and bandpass calibrations, the visibilities data from both tracks were combined together. Imaging and deconvolution were performed under GILDAS222http://www.iram.fr/IRAMFR/GILDAS/ package.
The 1.3 mm (225 GHz) continuum emission map was derived by averaging the line-free channels from both LSB and USB, resulting in a total bandwidth of 3.4 GHz. For the line channel maps we subtract the continuum visibilities of the relevant sideband from the line emission visibilites. In Table 2 we summarize the observations of IRC+10420 carried out by the SMA.
For the sake of presentation clearity, the center of all the maps were shifted in the visibility domain so that the phase reference matches the position of the continuum peak emission, i.e. R.A. = 19h26m4809 and Dec. = 11211675, which also corresponds to the center of the SiO shell detected by Castro-Carrizo et al. (2001). We note that the lack of interferometric baselines shorter than 11 m makes our observations blind to extended structures of size . In order to estimate the amount of flux recovered by the SMA, we convolved the channel maps of 12CO J=2–1 and 13CO J=2–1 lines to the spatial resolution of 19″.7 and 12″, respectively. We show in Figure 2 the spectra taken from the these maps and the single dish observations taken by Kemper et al. (2003) and Bujarrabal et al. (2001) at the same angular resolutions. We estimate that the SMA recovered more than 60% of the flux in 12CO J=2–1 line and almost all the flux in 13CO J=2–1 line.
| Table 2: SMA line observations towards IRC+10420. | ||||||
| Line | Rest Freq | Config. | Clean beam | P.A. | V | 1 rms |
| (GHz) | (FWHM, arcsec) | (deg) | (km s-1) | (mJy/beam) | ||
| 12CO(2-1) | 230.538 | Comp | 3.44 x 3.12 | 46∘ | 4.2 | 60 |
| Comp+Ext | 1.44 x 1.12 | 46∘ | 4.2 | 80 | ||
| 13CO(2-1) | 220.399 | Comp | 3.52 x 3.21 | 63∘ | 4.4 | 50 |
| SO(65-54) | 219.949 | Comp | 3.51 x 3.19 | 63∘ | 4.4 | 50 |
3 Results
3.1 1.3mm continuum emission
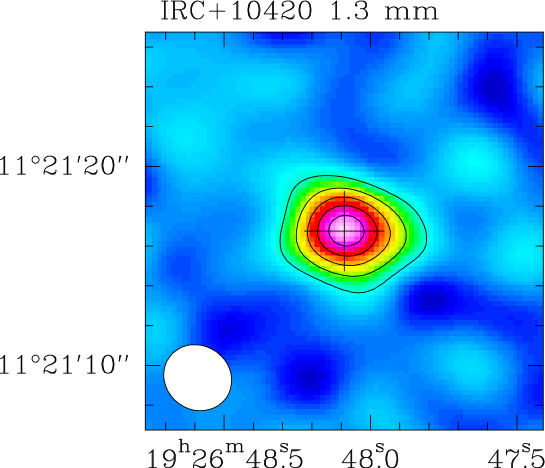
As shown in Figure 1, the 1.3mm continuum emission from IRC+10420 was well detected in our SMA data. The emission is not resolved and has a flux density 45 mJy. A previous single-dish observation by Walmsley et al. (1991) also at 1.3mm gives a flux of 101 mJy. That suggests that the dust emission is extended, with about 55% of the continuum flux resolved out by the interferometer. Assuming the central star to have a black body spectrum with a temperature of T = 7000 K, it contributes only a negligible amount of the flux at 1.3 mm of S∗ 0.1 mJy. Thus most of the 1.3mm continuum emission is produced by the warm dust in the envelope around IRC+10420.
3.2 12CO J=1 emission
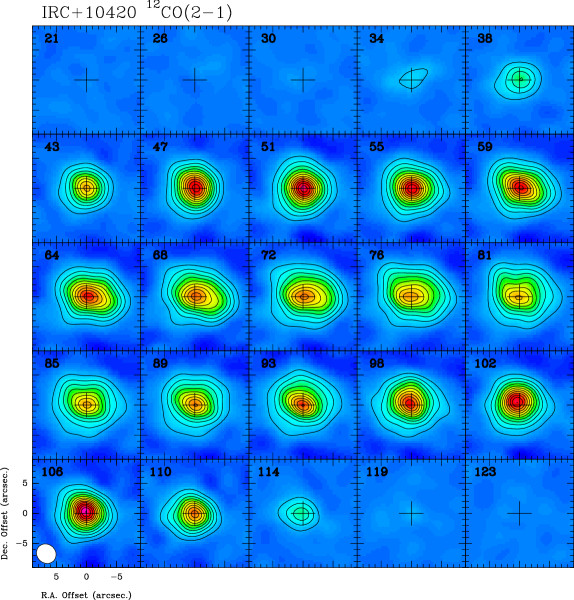
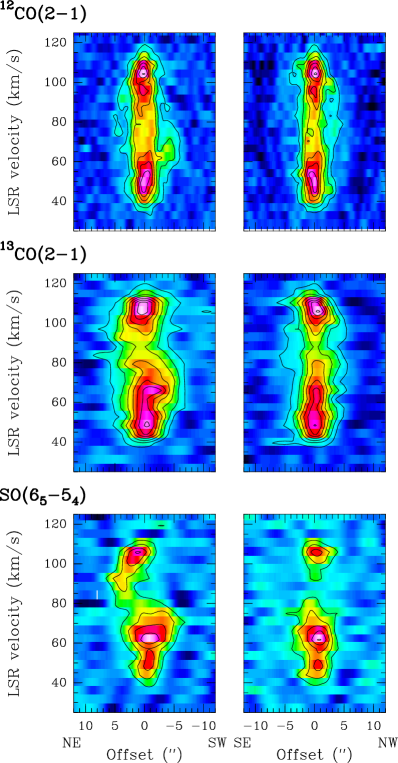
In Figure. 3 we show the channel maps of the 12CO J=21 emission obtained with the compact configuration of the SMA. At our angular resolution of 3″, the envelope is well resolved. At both blueshifted and redshifted velocities the emission appears to be circularly symmetric, as is expected for a spherically expanding envelope. More interestingly, at velocities between 59 – 89 km s-1, centered around the systemic velocity, the envelope is clearly elongated in approximately the North-East to South-West direction. By fitting a two-dimensional Gaussian to the intensity distribution of the 12CO J=21 emission at systemic velocity VLSR = 74 km s-1, we obtain a position angle for the 12CO J=21 envelope of PA=70∘. The orientation of the CO emission is consistent with the elongation found by Castro-Carrizo et al. (2007). The position-velocity (PV) diagrams of the 12CO J=2–1 emission along the major (PA 70∘) and minor (PA 160∘) axis of the envelope as presented in Figure 7 are typical of an expanding envelope at an expansion velocity of 40 km s-1.
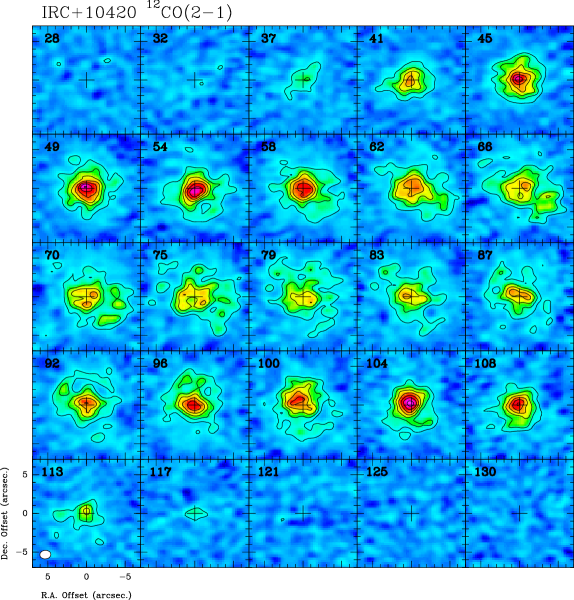
We show in Figure. 4 the channel maps of the 12CO J=21 emission, which is obtained by combining the data from both compact and extended configurations of the SMA. The 12CO J=21 emission is further resolved into more complex structures. In the velocity channels between 59 – 89 km s-1, centered around the systemic velocity, the 12CO J=2–1 emission consists of a central prominent hollow shell structure of 1″ to 2″ in radius and a more clumpy arc or shell located between radii of 3″ to 6″, which is more prominent in the South West quadrant of the envelope. Close inspection of the velocity channels around the systemic velocity VLSR 74 km s-1indicates that the central hollow shell-like structure is clumpy and shows stronger emission toward the South-Western side. The outer arc or shell of emission can be seen more easily in the azimuthal average of the 12CO J=21 brightness temperature as shown in Figure. 13. We can clearly see a central depression within a radius of 1” and enhanced emission between the radii of 3″ to 6″.
3.3 13CO J=1 emission
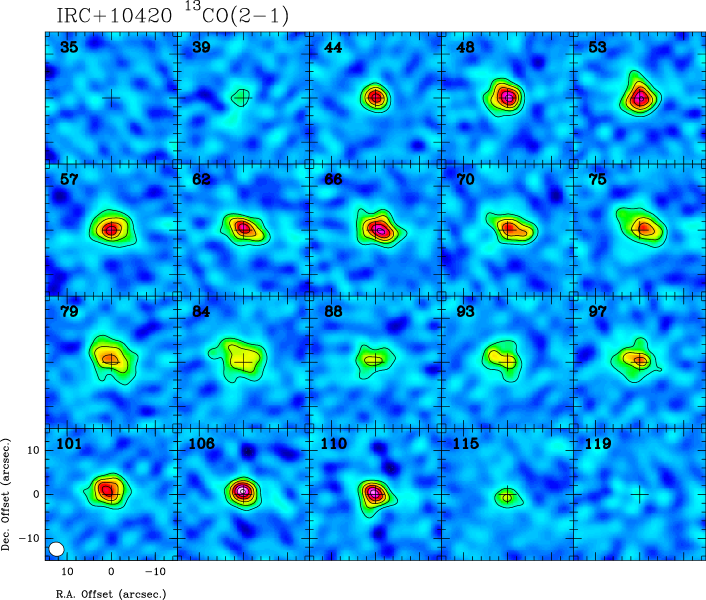
The channel maps of 13CO J=2–1 emission obtained from the compact configuration data at an angular resolution of 3″.5 is shown in Figure 5. The emission in the 13CO J=2–1 line appears fainter and more compact then seen in the main isotope 12CO J=2–1 line. Like in 12CO J=2–1 emission, near the systemic velocity, the envelope traced by 13CO J=2–1 emission is elongated at position angle of PA 70∘. The centroid of the emission appears to be slightly offset from the stellar position. Also like in 12CO J=2–1 emission, at higher velocities in both blue-shifted and red-sfhited parts the 13CO J=2–1 emission again shows a roughly circularly symmetric morphology, as would be expected for a spherically expanding envelope. The spatial kinematics of the 13CO J=2–1 emission can be more clearly seen in the position-velocity diagram (Figure 7) along the major axis (PA 70∘) of the envelope. In the PV diagram, there is a small velocity gradient in the velocity range between 70 to 100 km s-1. Closer inspection of the channel maps suggests that the small velocity gradient corresponds to the slight shift of the emission centroid toward the North-East quadrant of the envelope in the abovementioned velocity range.
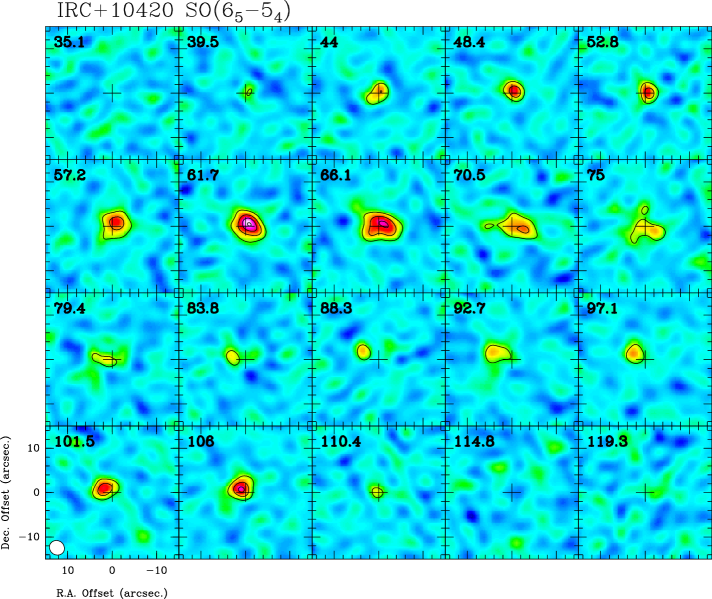
3.4 SO JK=65–54 emission
In Figure. 6 we show channel maps of the SO 654 emission obtained from the data of the compact configuration. The emission is well resolved in some of the velocity channels. A close inspection reveals that the distribution of SO 654 emission is different from that of 12CO J=21. At extreme redshifted velocities the centroid of the emission is shifted to the East, whereas at extreme blueshifted velocities the centroid of the emission is shifted to the West. In addition, the SO 654 emission in velocity channels centered around the systemic velocity is clearly elongated to the South-West. This elongation is very similar to that seen in 12CO J=21 emission at the same angular resolution (see Figure 3). More interestingly, at the opposing redshifted velocities of 84 to 102 km s-1(see Figure 6) the emission is very compact and shifts to the North-East of the central star. Such positional shift is shown more clearly in the position-velocity diagram of the SO JK=65–54 emission along the major axis (PA 70∘) of the envelope. There is a clearly velocity gradient in the velocity range between 70 to 90 km s-1, which is similar but more pronounced that that seen in 13CO J=2–1 line.
Thus, the SO 654 emission in particular but also the 13CO J=21 emission seem to better trace the asymmetric structure inside the envelope. The small velocity gradient seen in both lines points to the presence of an ejecta in the envelope of IRC+10420. From the abovementioned elongation of the envelope and the orientation of the positional velocity shift, we estimate that the ejecta is oriented at position angle of PA=70∘. We note that SO emission is known to be enhanced in AGB and post-AGB envelopes where collimated high velocity outflows are present. Examples can be found in the rotten egg nebula OH 231.8+4.2 (Sánchez Contreras et al. 2000) and VY CMa (Muller et al. 2007). In both cases SO emission is found to be strongly enhanced in the bipolar lobes. The SO enhancement in bipolar outflows could be related to the synthesis of SO in the shocked molecular gas in these outflows. Alternatively, the warm environment around supergiants like VY CMa and IRC+10420 could facilitate the synthesis of SO through chemical pathways such as S + OH SO + H or HS + O SO + H (Willacy & Millar 1997).
4 Structure of the envelope
In this section we attempt to build a model for the circumstellar envelope of IRC+10420 using our newly obtained SMA data and also the large body of observational data on IRC+10420, ranging from optical to milimeter wavelengths. Our goal is to better understand the physical conditions of the molecular gas inside the envelope and also to retrace the mass loss history of the central star. The structure of the envelope around IRC+10420 has been previously modelled in the work of Castro-Carrizo et al. (2007), by prescribing a radial distribution for the temperature in order to derive the gas density and consequently the mass loss rate. In our model we take into account the properties of the dust inside envelope and the balance of heating and cooling processes. From the discussion in the previous section, the envelope can be approximated as spherically symmetric. The physical conditions such as kinetic temperature, density in the envelope can then be inferred from detailed calculations of the energy balance within the envelope and matching the predictions of the radiative transfer model to the observed strength of the CO rotational lines. This procedure represents an improvement in comparison to previous models, and allows a better understanding of the physical conditions in the envelope of IRC+10420.
4.1 A simple model for dust continuum emission
To determine the heating process in the detected molecular shells requires the knowledge of the momentum transfer coefficient (or the flux average extinction coefficient ) between the dust particles and the gas molecules. To estimate this quantity, we follow the treatment of Oudmaijer et al. (1996) who modelled in detail the spectral energy distribution (SED) of IRC+10420. We emphasize here that by following the treatment of Oudmaijer et al. (1996), the structure of the molecular envelope as seen in our SMA data and previously in the data of Castro-Carrizo et al. (2007) is not considered explicitly.
We use the photometric data of IRC+10420 collected by Jones et al. (1993) and Oudmaijer et al. (1996), i.e. the 1992 photometric dataset. We also assume that the dust consists of silicate particles with a radius of = 0.05 m. The dust opacity as a function of wavelength is taken from the work of Volk & Kwok (1988). Following Oudmaijer et al. (1996), we scale the opacity law to match the absolute value of the opacity at 60m of = 150 cm2 g-1. We also a use a specific density for dust particles of = 2 g cm-3 and assume a dust to gas ratio = 5 10-3 as used by Oudmaijer et al. (1996).
To fit the SED of IRC+10420, especially in the mid-IR region between 5 to 20 m, Oudmaijer et al. (1996) suggest that two dust shells are needed: a hot inner shell with a low mass loss rate and an outer cooler shell with a higher mass loss rate. We note that Blöcker et al. (1999) also reached same conclusion in their attempt to fit the SED of IRC+10420. In our model we also use two dust shells: a hot inner shell with a low mass loss rate of Ṁ = 8 10-5 M⊙/yr located between 2.6 1015 cm (70 stellar radii) to 1.8 1016 cm (486 stellar radii) and an outer cooler shell with a higher mass loss rate of Ṁ = 1.2 10-3 M⊙/yr extending to a radial distance of 1018 cm where the dust particle number density drops to very low values. We also infer a stellar luminosity of 6 105 L⊙. The size of the dust shells, the mass loss rates and the stellar luminosity are very similar to that derived by Oudmaijer et al. (1996) scaled to the adopted distance of 5 kpc. The results of our radiative transfer model are presented in Figure 8 and 9. The fluxes from the model are corrected for an interstellar extinction of AV=5 as suggested by Oudmaijer et al. (1996). As can be seen in Figure 8, the results of our model are in close agreement with that shown in Oudmaijer et al. (1996) and match reasonably the observed SED of IRC+10420. As shown in Figure. 9, the dust temperature decreases monotonically from 1000 K at the inner radius to 50 K at the outer radius of the dust envelope, even though there is a jump in mass loss rate between the inner hot dust shell and the outer cooler dust shell at a radial distance of 1.8 1016 cm.
From the flux of the radiation field at each point in the envelope we can define the flux average extinction coefficient , which characterizes the transfer of angular momentum from radiation photons to dust particles during the absorption and reemission processes of the continuum radiation. Because in our case we do not consider the scattering of radiation, the extinction coefficient is simply the opacity , where is the wavelength of the radiation.
| (1) |
The flux average extinction coefficient changes significantly in the inner part of the dust envelope but reaches a constant value in the outer part. Because the molecular shells are located in the outer part of the dust envelope, at radii larger than a few times 1016 cm, for simplicity, we will adopt a constant value =0.025 (see Figure 9).
4.2 Excitation of CO molecule
The temperature of the molecular gas at any point in the envelope is determined by the balance between cooling due to adiabatic expansion and molecular emissions, and the heating, which is mainly due to collisions of molecules with dust grains (Goldreich & Scoville 1976). As the dust grains stream through the gas under radiation pressure, the grains transfer angular momentum to the gas by collisions. The heating term is therefore directly related to the drift velocity:
| (2) |
where is the number density of dust particles. The drift velocity is determined by the relation:
| (3) |
where is the stellar luminosity, is the expansion velocity, is the mass loss rate, and is the speed of light, is the flux average extinction coefficient of dust particles estimated in previous section. The same dust to gas ratio of = 5 10-3 is used to calculate the heating rate.
Generally, in oxygen-rich envelopes the main coolants are H2O and CO molecules. The contribution of H2O molecules to the cooling process in IRC+10420 is quite uncertain. We note that far-IR emission lines of H2O are not detected in the ISO data (Molster et al. 2002). In addition, OH masers are seen in a shell of radius 1 to 1.5 arcsec (Nedoluha & Bowers 1992). Because OH radical is the photodissociation product of H2O, it is likely that H2O molecules can only exist at even smaller radii, i.e. inside the central cavity disccused previously. Therefore, we do not expect the H2O molecules to be present in significant quantity in the part of the molecular envelope traced in CO emission As a result, we do not include the cooling due to the H2O molecule in our model and calculate the cooling solely due to CO molecule and its isotopomer 13CO.
We use the thermal balance and radiative transfer model published by Dinh-V-Trung & Nguyen-Q-Rieu (2000) to derive the temperature profile of the molecular gas and to calculate the excitation of CO molecules and predict the strength of CO rotational transitions. We take into account all rotational levels of CO molecules up to J=20. The collisional cross sections with H2 are taken from Flower (2001), assuming an ortho to para ratio of 3 for molecular hydrogen. The local linewidth is determined by the turbulence velocity and the local thermal linewidth. Because the expansion velocity of the gas in the envelope of IRC+10420 is large and the observed CO line profiles have smooth slopes at both blueshifted and redshifted edges (see Figure 11), we need to assume a constant turbulence velocity of 3 km s-1. We note that this is higher than normally used (about 1 km s-1) for the envelope around AGB stars where the expansion velocity is lower (Justtanont et al. 1994). In our model, the spherical envelope is covered with a grid of 90 radial points. For each rotational transition, the radiative transfer equation is integrated accurately through the envelope to determine the average radiation field at each radial mesh point. We use the approximate lambda operator method together with Ng-acceleration to update the populations of CO molecules of different energy levels. Once convergence is achieved, we convolve the predicted radial distribution of the line intensity with a Gaussian of specified FWHM to produce simulated data for comparison with observations.
As discussed in the previous section, there is a clear evidence for the presence of two molecular shells from our SMA data. The size and location of each molecular shell are determined from fits to the interferometric data. In our model we adjust both the mass loss rates and the relative abundance of CO molecules in the two molecular shells to match both the single dish and interferometric data. We find that a relatively low mass loss rate similar to that derived by Castro-Carrizo et al. (2007) would result in a too high gas temperature in the envelope as the heating term becomes more dominant in comparison to the cooling term. We also find that a high abundance of CO of a few times 10-4 as usually used for oxygen rich envelopes (Kemper et al. 2003, Castro-Carrizo et al. 2007) would result in CO lines that are too strong. Instead, a relative abundance of 10-4 for CO molecules with respect to H2 for the CO molecules provides reasonable fit to all the available data. The radial profile of the gas temperature is shown in Figure 10. The sudden jump in gas temperature at the inner radius of the second shell (1.85 1017 cm) is due to the change in the mass loss rate. We can see that the gas temperature in the envelope of IRC+10420, although lower than assumed in Castro-Carrizo et al. (2007), is higher than that typically found in circumstellar envelopes. Even at the outermost radius of the envelope, the gas temperature is still around 50 K. For comparison, in the envelope around OH/IR stars, the gas temperature at similar radial distances from the central star is predicted to be much lower, 10 K or even less (Justtanont et al. 1994, Groenewegen 1994). The main reason for the elevated gas temperature in the envelope of IRC+10420 is the strong heating due to the enormous luminosity of the central yellow hypergiant. The cooling due to molecular emissions is also affected by the lower abundance of CO, that we find neccessary to match the data. A summary of the parameters used in our model is presented in Table 3.
As shown in Figures 11–14, the results of our model are in reasonable agreement with both the strengths of CO lines measured by single dish telescopes and the radial distribution of brightness temperature of J=1–0 and J=2–1 lines observed with interferometers. We note that except for the extra emission in the blue part of the line profile between 65 and 75 km s-1, the shape of the J=2–1 and J=3–2 is in close agreement with observation. Higher transitions J=4–3 and 6–5 show some evidence of narrower linewidth than predicted by the model. One possible explanation is that the expansion velocity in the inner region traced by these high lying transitions has slightly lower expansion velocity than in the outer part of the envelope.
By comparing the model predictions with the strengths of 13CO J=1–0 and J=2–1 lines observed with the IRAM 30m telescope (Bujarrabal et al. 2001), we derive a relative abundance for 13CO/H2 of 1.5 10-5, or an isotopic ratio 12C/13C 6. This ratio is very similar to the values 12C/13C = 6 and 12, respectively, found in the red supergiants Ori and Sco (Harris & Lambert 1984, Hinkle et al. 1976). Such a low isotopic ratio suggests that IRC+10420 has experienced significant mixing of H burning products to its surface prior to the ejection of the material in the envelope.
The difference between the mass-loss rates and gas temperature profile derived from our modelling and that obtained by Castro-Carrizo et al. (2007) can be understood as the consequence of the higher gas temperature and higher CO abundance adopted in their work. For the same strength of the CO rotational lines, the higher CO abundance can be almost exactly compensated by a corresponding decrease in the mass loss rate.
Our results indicate the presence of two separate shells (shell I and shell II, see Table 3) with slightly different mass loss rates. With an expansion velocity of 38 km s-1, the time interval between the two shells is 200 yrs. The cavity inside shell I also implies a dramatic decrease in mass loss from IRC+10420 over the last 300 yrs. Thus IRC+10420 loses mass in intense bursts, separated by relatively quiet periods of a few hundreds years in duration.
| Table 3: Parameters of the model for IRC+10420 envelope. | ||
|---|---|---|
| Parameters | Shell I | Shell II |
| Inner radius | 3.5 1016 cm | 1.85 1017 cm |
| Outer radius | 1.5 1017 cm | 5 1017 cm |
| Mass loss rate Ṁ | 9 10-4 M⊙ yr-1 | 7 10-4 M⊙ yr-1 |
| Expansion velocity Vexp | 38 kms-1 | 38 kms-1 |
| Dust to gas ratio | 5 10-3 | 5 10-3 |
| Momentum transfer coefficient | 0.025 | 0.025 |
| 12CO/H2 | 10-4 | 10-4 |
| 13CO/H2 | 1.5 10-5 | 1.5 10-5 |
| Turbulent velocity | 3 kms-1 | 3 kms-1 |
4.3 Caveats
In our model we consider separately the dust and gas component in the envelope of IRC+10420. The dust continuum emission model is used as a simple way to estimate the parameter of dust particles, which is needed for the thermal balance calculation in the molecular shells. It turned out that the mass loss rates of the molecular shells between 9 10-4 M⊙/yr for shell I and 7 10-4 M⊙/yr for shell II are lower but quite close to the mass loss rate of 1.2 10-3 M⊙/yr of the cool outer dust shell inferred from the modelling the SED of the envelope. Our approach, although less ad hoc than simply assuming a value of the parameter for dust particles, is not fully self-consistent in the treatment of the dust and gas component. It would be desirable in the future to treat both the dust and gas component together when high angular resolution data on the dust continuum emission and higher J lines of CO become available.
Another caveat of our model is the assumption that the heating of molecular gas is mainly due to collision between dust particles and gas molecules. The high luminosity of the central star of IRC+10420 suggests that radiation pressure on dust particles is a possible mechanism for driving the wind as assumed in our mode. However, given the high expansion velocity and the presence of many small scale features in high angular resolution optical images of the envelope (Humphreys et al. 1997), which has been interpreted as jets or condensations, other mechanisms such as shocks produced by interaction between higher velocity ejecta and the envelope should be considered. The heating due shocks within the envelope might contribute to the thermal balance of the molecular gas in IRC+10420.
5 Comparison with optical imaging data
The circumstellar envelope around IRC+10420 is known to be very complex, with a number of peculiar structures (Humphreys et al. 1997). In the outer part of the envelope at radial distance of 3″ to 6″, several arc-like features can be seen. These features have been interpreted as representing different mass loss episodes of IRC+10420. In addition, condensations or blobs are seen closer (about 1″ to 2″ in radius) to the central star. That might represent a more recent mass loss episode. These features correspond spatially to the two molecular shells (shell I and II) identified in our observations. In addition, Humphreys et al. (1997) also identified several broad fan-shaped features to the South-West side of the central star, between radius of 0”.5 to 2”. From their higher surface brightness in comparison with other parts of the envelope, Humphrey et al. (1997) suggest that these features are ejecta moving obliquely toward the observer. As discussed in previous section, the channel maps of 13CO J=2–1 and SO JK=65–54 (Figures 5 and 6) reveal enhanced emissions in blueshifted velocity channels together with a positional shift of the emission centroid also to the South-West quadrant of the envelope. Therefore, the spatial kinematics obtained from our observations and the properties of these fan-shaped features are consistent with the presence of an ejecta in the South-West side of the envelope around IRC+10420.
6 Summary
We have used the sub-millimeter array to image and study the structure of the molecular envelope around IRC+10420. Our observations reveal a large expanding envelope with a clumpy and very complex structure. The envelope shows clear asymmetry in 12CO J=2–1 emission in the South-West direction at position angle PA70∘. The elongation of the envelope is found even more pronounced in the emission of 13CO J=2–1 and SO JK=65–54. A positional shift with velocity is seen in the above emission lines, suggesting the presence of a weak bipolar outflow in the envelope of IRC+10420.
In the higher resolution data of 12CO J=2–1, we find that the envelope has two components: (1) a inner shell (shell I) located between radius of about 1”-2”; (2) an outer shell (shell II) between radius 3” to 6”. These shells represernt two previous mass loss episodes from IRC+10420.
We constrain the physical conditions inside the envelope by modelling the dust properties, the heating and cooling of molecular gas. From comparison with observations we derive the size and the location of each molecular shell. We estimate a mass loss rate of 9 10-4 M⊙ yr-1 for shell I and 7 10-4 M⊙ yr-1 for shell II. The gas temperature is found to be an usually high in IRC+10420 in comparison with other oxygen rich envelopes, mainly due to the large heating induced by the large luminosity of the central star.
We also derive a low isotopic ratio 12C/13C = 6 for IRC+10420, which suggests a strong mixing of processed material from stellar interior to the surface of the star.
References
- Blöcker et al. (1999) Blöcker, T., Balega, Y., Hofman, K.H., Lichtenthaler, J., Osterbart, R., Weigelt, G., 1999, A&A 348, 805
- Bujarrabal et al. (2001) Bujarrabal, V., Castro-Carrizo, A., Alcolea, J., Sánchez-Contreras, C., 2001, A&A, 377, 868
- Castro-Carrizo et al. (2007) Castro-Carrizo, A., Quintana-Lacaci, G., Bujarrabal, V., Neri, R., Alcolea, J., 2007, 465, 457
- Castro-Carrizo et al. (2001) Castro-Carrizo, A., Lucas, R., Bujarrabal, V., Colomer, F., Alcolea, J., 2001, A&A 368, L34
- Davies et al. (2007) Davies, B., Oudmaijer, R.D., Sahu, K.C., 2007, astro-ph/0708.2204
- de Jager (1998) de Jager, C., 1998, AARev, 8, 145
- Dinh-V-Trung & Nguyen-Q-Rieu (2000) Dinh-V-Trung, Nguyen-Q-Rieu, 2000, A&A 361, 601
- Flower (2001) Flower, D.R., 2001, JPhB 34, 2731
- Goldreich & Scoville (1976) Goldreich, P., Scoville, N., 1976, ApJ 205, 144
- Groenewegen (1994) Groenewegen, M., 1994, A&A 290, 544
- Harris & Lambert (1984) Harris, M.J., Lambert, D.L., 1984, ApJ 281, 739
- Hinkle et al. (1976) Hinkle, K.H., Lambert, D.L., Snell, R.L., 1976, ApJ 210, 684
- Humphreys et al. (1997) Humphreys, R.M., Smith, N., Davidson, K., Jones, T.J., Gehrz, D., Mason, C., 1997, AJ, 114, 2778
- Jones et al. (1993) Jones, T.J., Humphreys, R.M., Gehrz, R.D., Lawrence, G.F., et al., 1993, ApJ 411, 323
- Justtanont et al. (1994) Justtanont, K., Skinner, C.J., Tielens, A.G.G.M., 1994, ApJ 435, 852
- Kastner & Weintraub (1995) Kastner, J.H., Weintraub, D.A., 1995, ApJ, 452, 833
- Kemper et al. (2003) Kemper, F., Stark, R., Justtanont, K., de Koter, A., Tielens, A.G.G.M., Waters, L.B.F.M., Cami, J., Dijkstra, C., 2003, A&A, 407, 609
- Klochkova et al. (1997) Klochkova, V.G., Chentsov, E.L., Panchuk, V.E., 1997, MNRAS 292, 19
- Knapp & Morris (1985) Knapp, G.R., Morris, M., 1985, ApJ 292, 640
- Mastrodemos et al. (1996) Mastrodemos N., Morris M., Castor J., 1996, ApJ 468, 851
- Menten & Alcolea (1995) Menten, K.M., Alcolea, J., 1995, ApJ 448, 416
- Muller et al. (2007) Muller, S., Dinh-V-Trung, Lim, J., Hirano, N., Muthu, C., Kwok, S., 2007, ApJ 656, 1109
- Nedoluha & Bowers (1992) Nedoluha, G.E., Bowers, P.F., 1992, ApJ, 392, 249
- Omont et al. (1993) Omont, A., Lucas, R., Morris, M., Guilloteau, S., 1993, A&A, 267, 490
- Oudmaijer et al. (1996) Oudmaijer, R.D., Groenewegen M.A.T., Matthews, H.E., Blommaert, J.A.D.L., Sahu, K.C., 1996, MNRAS, 280, 1062
- Oudmaijer (1998) Oudmaijer, R.D., 1998, A&AS 129, 541
- Quintana-Lacaci et al. (2007) Quintana-Lacaci, G., Bujarrabal, V., Castro-Carrizo, A., Alcolea, J., 2007, A&A 471, 551
- Sahai & Wannier (1992) Sahai, R., Wannier, P.G., 1991, ApJ 394, 320
- Sánchez-Contreras et al. (2000) Sánchez-Contreras, C., Bujarrabal, V., Neri, R., Alcolea, J., 2000, 357, 651
- Teyssier et al. (2006) Teyssier, D., Hernandez, R., Bujarrabal, V., Yoshida, H., Phillips, T.G., 2006, A&A 450, 167
- Volk & Kwok (1988) Volk, K., kwok, S., 1988, ApJ, 331, 435
- Walmsley et al. (1991) Walsmley, C.M., Chini, R., Kreysa, E., Steppe, H., Forveille, T., Omont, A., 1991, A&A 248, 555
- Willacy & Millar (1997) Willacy, K., Millar, T.J., 1997, A&A 324, 237