E/S0 Galaxies on the Blue Color-Stellar Mass Sequence at
:
Fading Mergers or Future Spirals?
Abstract
We identify a population of morphologically defined E/S0 galaxies lying on the locus of late-type galaxies in color–stellar mass space — the “blue sequence” — at the present epoch. Using three samples (from the Nearby Field Galaxy Survey or NFGS, a merged HyperLeda/SDSS/2MASS catalog, and the NYU Value Added Galaxy Catalog), we analyze blue-sequence E/S0s with stellar masses 108 , arguing that individual objects may be evolving either up toward the red sequence or down into the blue sequence. Blue-sequence E/S0 galaxies become more common with decreasing stellar mass, comprising 2% of E/S0s near the “shutdown mass” 1–2 1011 , increasing to 5% near the “bimodality mass” 3 1010 , and sharply rising to 20–30% below the “threshold mass” 4–6 109 , down to our completeness analysis limit at 109 . The strong emergence of blue-sequence E/S0s below coincides with a previously reported global increase in mean atomic gas fractions below for galaxies of all types on both sequences, suggesting that the availability of cold gas may be basic to blue-sequence E/S0s’ existence. Environmental analysis reveals that many sub- blue-sequence E/S0s reside in low to intermediate density environments. Thus the bulk of the population we analyze appears distinct from the generally lower-mass cluster dE population; S0 morphologies with a range of bulge sizes are typical. In mass-radius and mass- scaling relations, blue-sequence E/S0s are more similar to red-sequence E/S0s than to late-type galaxies, but they represent a transitional class. While some of them, especially in the high-mass range from to , resemble major-merger remnants that will likely fade onto the red sequence, most blue-sequence E/S0s below show signs of disk and/or pseudobulge building, which may be enhanced by companion interactions. The blue overall colors of blue-sequence E/S0s are most clearly linked to blue outer disks, but also reflect blue centers and more frequent blue-centered color gradients than seen in red-sequence E/S0s. Notably, all E/S0s in the NFGS with polar or counterrotating gas lie on or near the blue sequence, and most of these systems show signs of secondary stellar disks forming in the decoupled gas. From star formation rates and gas fractions, we infer significant recent and ongoing morphological transformation in the blue-sequence E/S0 population, especially below . We argue that sub- blue-sequence E/S0s occupy a “sweet spot” in stellar mass and concentration, with both abundant gas and optimally efficient star formation, which may enable the formation of large spiral disks. Our results provide evidence for the importance of disk rebuilding after mergers, as predicted by hierarchical models of galaxy formation.
Subject headings:
galaxies: evolution1. Introduction
Modern galaxy surveys find that most galaxies occupy two distinct loci in color-stellar mass space, the “red sequence” and the “blue sequence” (or “cloud” or “distribution,” etc.; Strateva et al., 2001; Baldry et al., 2004; Bell et al., 2004). Because the high-mass end of the red sequence corresponds to the well-known color-magnitude relation of cluster E/S0 galaxies, it is natural to identify red-sequence galaxies with E/S0 types and blue-sequence galaxies with spiral/irregular types, except for some contamination of the red sequence by dust-reddened late-type systems.
Here we show that this basic morphology–color correspondence begins to fail for stellar masses 1–2 , as morphologically defined E/S0 galaxies start to appear on the blue sequence in surveys (see also Bamford et al., 2009). The failure becomes dramatic below a threshold mass of 4–6 109 , matching the mass scale below which the mean atomic gas content of low- galaxies increases substantially on both sequences (Kannappan, 2004; Kannappan & Wei, 2008). 111Kannappan (2004) incorrectly associated the gas-richness threshold mass with the 3 1010 “bimodality” mass scale of Kauffmann et al. (2003) based on an assumed correspondence between the stellar mass calibrations of Kauffmann et al. and Bell et al. (2003). On further investigation (see both § 2.3 and Kannappan & Wei 2008), the gas-richness threshold mass in fact corresponds to 4–6 109 and marks the lower edge of a transitional mass range centered on the bimodality mass.
A specific stellar mass scale linked to shifts in galaxy properties was first highlighted by Kauffmann et al. (2003), who found that galaxy star formation histories (SFHs) are qualitatively different on either side of a crossover or bimodality mass . Their analysis shows the transitional mass range starting at 9.5–10, below which galaxies have bursty SFHs, and ending at 11–11.5, beyond which SFHs reflect uniformly ancient stellar populations. Structural properties also change, with high-mass galaxies having higher concentration, higher surface brightness, and a higher ratio of spheroids to disks (Kauffmann et al., 2003; Driver et al., 2006). In a more focused study of edge-on disk galaxies, Dalcanton et al. (2004) report the emergence of bulges as well as efficient star formation, as evidenced by prominent dust lanes, above 120 km s-1 (corresponding to in the stellar-mass Tully-Fisher relation, see § 3.2 below). Baldry et al. (2004) tie mass-dependent shifts in galaxy properties to the red and blue sequences by showing that the red sequence becomes numerically dominant above 2–3 1010 .
Just about every idea advanced to explain why galaxy properties change at specific mass scales involves gas physics. Abrupt shifts in star formation efficiency and gas richness near have been linked to the interplay of gas infall, supernova-driven winds, and changes in surface mass density (Dalcanton et al., 2004; Dalcanton, 2007). The buildup of the red sequence above has been linked to “quenching” processes that shut down star formation, such as gas loss caused by AGN feedback, consumption of all available gas in the wake of violent merging, ram-pressure stripping/harassment/strangulation in clusters, and/or shock-heating that turns off efficient “cold-mode” gas accretion (Baldry et al., 2004; Kenney et al., 2004; Springel et al., 2005; Dekel & Birnboim, 2006; Cattaneo et al., 2006; Faber et al., 2007). Some combination of these processes may be required to ensure that quenching is efficient, permanent, and mass-dependent (Dekel & Birnboim, 2006).
Higher-redshift studies now suggest that the crossover mass between disks and spheroids has evolved downward over time from 1– at — notably, equal to the shutdown mass marking the upper end of the transitional mass range today — to today’s crossover mass near (Bundy et al. 2005; Franceschini et al. 2006; see also Cimatti et al. 2006). This trend is coincident with many other signs of “downsizing” (Cowie et al., 1996) in the galaxy formation process, including the downwardly evolving upper mass threshold for strong star formation (e.g., Juneau et al., 2005; Kodama et al., 2004; Tresse et al., 2007) as well as a similarly evolving upper threshold for irregular morphologies, abundant blue compact galaxies, and strong kinematic disturbances (Mallén-Ornelas et al., 1999; Kannappan & Barton, 2004). Whether downsizing can be traced back to still higher redshifts is unclear, as the red sequence is only tentatively detected beyond (comparing Kriek et al. 2008 and Cirasuolo et al. 2007). Semianalytic models that include cold accretion predict that the highest mass galaxies, residing in 1012 dark matter halos (implying stellar masses near ), formed rapidly at very high redshift before developing stable shocks that inhibited further star formation (Cattaneo et al., 2006).
From these results, we infer the importance of three mass regimes for our analysis: (1) near the shutdown mass , at which blue-sequence E/S0s first emerge, and above which nearly all galaxies are old and red; (2) between and , where the signatures of downsizing from may remain; and (3) below the threshold mass , where blue-sequence E/S0s, bursty SFHs, and high gas fractions become suddenly abundant. The surveys considered here include few galaxies below a few 108 , so we largely omit the abundant cluster dE population that dominates the faint end of the red sequence. In fact, many E/S0s between 108–1010.5 occupy low-to-intermediate density environments (§ 3.1; Hogg et al. 2003; Trentham et al. 2005).
Given the close association of blue-sequence E/S0s with mass regimes characterized by active or recent evolution, their intriguing mismatched color-morphology status could indicate a transitional state in color (e.g., a fading starburst galaxy after a merger), morphology (e.g., a disk-building system), or both (e.g, a gas-rich merger remnant regenerating a young disk from tidal debris). Put differently, blue-sequence E/S0s may be evolving from blue to red, from red to blue, or wholly within the blue sequence. Or they may not be evolving much at all.
In this work we document the blue-sequence E/S0 population systematically for the first time, exploring properties and demographics to constrain the disk-building and fading-starburst scenarios. We ask the reader to suspend all preconceptions about E/S0 colors, gas contents, masses, environments, and even bulge-to-disk ratios, as many accepted “facts” about E/S0s reflect the properties of the high-mass red sequence. Section 2 describes our survey samples, our morphological definition of an E/S0, how we measure stellar mass, and how we divide the red and blue sequences. Section 3 provides a demographic overview of the blue-sequence E/S0 population, including frequency among all E/S0s, distribution by mass and environment, and dynamical scaling relations. Section 4 examines the detailed characteristics of blue-sequence E/S0s, including morphological substructure, gas content and star formation, and clues to interaction status. Section 5 follows up on an intriguing association of gas-stellar counterrotation and polar rings with blue-sequence E/S0s, providing an in-depth analysis of new stellar kinematic data for five such galaxies to probe the possibility of secondary stellar disk growth in these systems. Finally, Section 6 reviews our results in the context of different evolutionary scenarios and discusses implications for disk formation from .
2. Data and Methods
We assume km s-1 Mpc-1and throughout. At the low redshifts of our sample galaxies, neglecting introduces errors 0.02 dex in stellar mass.
2.1. Samples
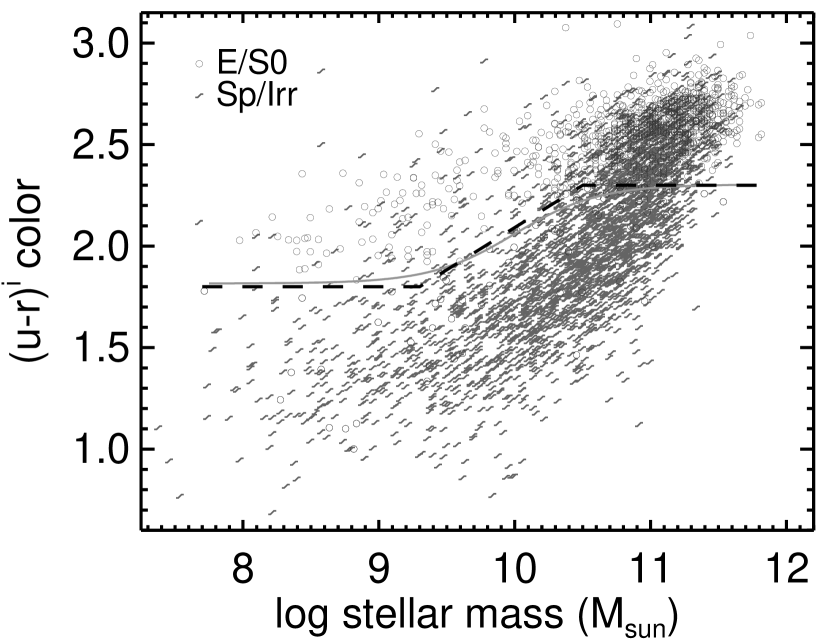
We analyze two primary samples, one drawn from the Nearby Field Galaxy Survey (NFGS, Jansen et al., 2000b, hereafter J00) and the other drawn from the HyperLeda, Sloan Digital Sky Survey (SDSS) DR4, and Two Micron All-Sky Survey (2MASS) databases (hereafter, “HyperLeda+” sample; Paturel et al., 2003a; Adelman-McCarthy et al., 2006; Jarrett et al., 2000). These samples are shown in Fig. 1. The NFGS sample offers a homogeneous and high-quality data set while the HyperLeda+ sample offers the statistical advantage of thousands of galaxies. A third sample, the NYU Value-Added Galaxy Catalog low-redshift sample (VAGC, Blanton et al., 2005), is used to evaluate completeness in the HyperLeda+ sample. We describe the samples here and amplify on the morphological criteria used to identify E/S0s in § 2.2.
2.1.1 The Nearby Field Galaxy Survey (NFGS) Sample
The NFGS database includes 200 galaxies selected to fairly represent the natural abundance of morphologies in the local universe over a wide range in luminosity. Notwithstanding its name, the survey spans a variety of environments including clusters. NFGS galaxies were given numerical morphological types as part of the CfA 1 redshift survey (Huchra et al., 1983) and later reclassified by J00 on the same deVaucoleurs-based system, using new high-quality CCD imaging.222We convert the type Pec galaxy UGC 9562, a polar ring galaxy with an S0 host, to type S0 for this paper. We also reclassify UGC 6570 (=A11332+3536) from S0 to S0/a following Kannappan et al. (2004). In all other cases we use the types given by J00 for the NFGS. Because the NFGS was selected without explicit bias in color or morphology, the properties of blue-sequence E/S0s in this survey should be reasonably representative, within the constraints of -band selection and small number statistics.
The NFGS sample allows us to examine a broad sample of E/S0s with supporting data not available for the HyperLeda+ sample, most notably, integrated spectrophotometry (Jansen et al., 2000a) and gas and stellar kinematics (Kannappan & Fabricant, 2001; Kannappan et al., 2002, 2009, see also new data in § 5.2). Other data used in analyzing the NFGS sample include photometry and Virgocentric-infall corrected redshifts from J00, 2MASS -band photometry from Jarrett et al. (2000), and atomic gas masses derived from the homogenized HI catalog of Paturel et al. (2003b) using , where is the integrated line flux in Jy km s-1, is the distance in Mpc, and the factor of 1.4 represents the helium mass correction. SDSS data are available for 60% of the NFGS; we use these magnitudes to calibrate shifts in colors and mass estimates between the (primary NFGS) and (HyperLeda+) systems.
Our primary NFGS sample consists of 164 galaxies, including 52 E/S0s. We reject galaxies with missing spectra or point-source morphologies. We also exclude a possible blue-sequence E/S0, NGC 2824, with severe contamination from a nearby bright star; however, we retain one red-sequence E/S0, NGC 3605, whose and -band magnitudes are mildly affected by blending with a companion, but whose color can still be estimated reasonably well based on stellar population fits to the full SED. All sources in this primary sample have -band fluxes with error 0.3 mag.333 Detailed inspection reveals galaxies for which 2MASS data are available but pipeline data products are defective, due to poor deblending, electronic glitches, cut-off edges, or other technical problems (Kannappan et al., 2009). This flagging would reject some galaxies that pass our -band error criterion, but we allow these galaxies in this paper to facilitate uniform comparison with the HyperLeda+ and NYU VAGC samples. Fig. 1b indicates galaxies that pass the -band criterion but not the more detailed inspection in a lighter shade of gray; all but one are late-type galaxies.
Both spectra and photometry are corrected for foreground extinction using the maps of Schlegel et al. (1998) and, for the spectra, the Milky Way extinction curve of O’Donnell (1994) as given by McCall (2004). We use total, extrapolated magnitudes for stellar mass estimation (along with spectra, § 2.3). The red and blue sequences are divided using isophotal colors measured within the -band 26 isophote, to minimize extrapolation errors. We estimate -corrections from the SED fits used to determine stellar masses (see § 2.3). The notation signifies that we also correct for internal extinction in a population-averaged way, by applying the inclination-based corrections of Tully et al. (1998) adapted to the NFGS and SDSS passbands (see Kannappan et al., 2002, 2009). These corrections are appropriate for galaxies with gas; for galaxies lacking extended emission lines, we assume zero internal extinction.
2.1.2 The HyperLeda/SDSS/2MASS (HyperLeda+) and NYU VAGC Samples
The HyperLeda+ sample is a larger, less uniform data set consisting of 3783 galaxies with morphological types listed in HyperLeda plus and magnitudes available from the SDSS and 2MASS galaxy catalogs (within a 6 matching radius and with magnitude errors in and in ). We include only galaxies with diameter less than 120 to minimize pipeline reduction errors in 2MASS and SDSS. To improve classification reliability, we exclude galaxies listed as “multiple” in HyperLeda, and we require diameter 40 and axial ratio 0.45 (inclination less than 72). We adopt Virgocentric-infall corrected redshifts from HyperLeda when available and otherwise use SDSS redshifts, which we correct to the Local Group frame of reference. Data for a handful of catalog galaxies that pass our diameter cuts but have nominal redshifts km s-1 are rejected as spurious. We further require km s-1 and exclude sources with km s-1 if they lack Virgocentric infall corrections.
For our working HyperLeda+ sample we have reclassified all candidate blue-sequence E/S0 galaxies using SDSS -band imaging, with reclassifications homogenized between two independent observers (SJK and AJB), taking the NFGS sample as a reference. Starting with HyperLeda numerical types 0 (S0/a), our reclassification discards 60% of candidate blue-sequence E/S0s as actually having type Sa or later. The remaining confirmed blue-sequence E/S0s represent a lower limit to the true population, because we have not retyped galaxies initially classified as late type to find mistyped E/S0s.444 The HyperLeda+ sample used in this paper was defined prior to a 2006 update to the HyperLeda database that corrected a systematic error in galaxy radii and added new data. Adopting the revised radii would slightly change our existing sample, because two galaxies would just miss the lower diameter limit, but would not otherwise affect our analysis, as the radii we analyze come from the 2MASS catalog. Using the revised database would also add and remove some candidate E/S0s, because average numerical types can shift as new data are added. However, as all of our blue-sequence E/S0s are independently verified by inspection of SDSS data, our data set remains a robust minimum sampling of the blue-sequence E/S0 population. We therefore retain the original sample.
In analyzing the HyperLeda+ sample we employ total magnitudes determined from extrapolated profile fits, i.e., SDSS model magnitudes and 2MASS extrapolated magnitudes. We determine -corrections and foreground extinction corrections as for the NFGS sample. Internal extinction corrections are also matched in principle. However, because we do not know which galaxies have extended ionized gas emission lines (the criterion used to decide whether to apply an internal extinction correction for an NFGS galaxy), we exploit a division in mass–radius space that predicts surprisingly well which galaxies in the NFGS have extended emission. Thus an internal extinction correction is applied whenever the Petrosian -band 90% light radius satisfies .
We determine colors and masses for the NYU VAGC low-redshift sample almost exactly as for the HyperLeda+ sample, to facilitate the comparative analysis in § 3.1. However, axial ratios for VAGC galaxies are available only by cross-matching with the online HyperLeda database, which yields values for only 60–70% of the VAGC galaxies we analyze (depending on sample definition, § 3.1). Galaxies lacking axial ratio data are treated as having no internal extinction.
2.2. Definition of an E/S0
Our definition of an E/S0 galaxy is purely morphological, based on traditional by-eye classification of monochrome or band images by multiple observers. As discussed in § 2.1, we calibrate our reclassifications of candidate HyperLeda+ blue-sequence E/S0s against the classifications given for the NFGS in J00, which were determined on a simplified version of the deVaucoleurs-based system used for the CfA 1 redshift survey. Numerical types (S0/a) qualify as E/S0s, including all type E, cE, S0, and S0/a galaxies. We also include some peculiar galaxies with predominantly spheroidal structure. Our classification system does not identify “blue compact dwarfs” (BCDs) as a distinct category, but rather distributes them among early and late types according to their primary morphology. Dwarf ellipticals (as the term is used by Binggeli et al. 1988) fall mostly below our mass range, and their tendency to occur in clusters is inconsistent with the available environmental data for our galaxies (§ 3.1). However, we make no explicit exclusion based on concentration or surface brightness, and we find a continuous range of E/S0 properties.555It is worth recalling that the strong dichotomy in dE vs. giant E properties found in the Kormendy Relation and other scaling laws does not consider S0 galaxies, which are typically either excluded or included only in their bulge component. S0s display a broad range of intermediate morphologies and masses, and S0s formed in mergers are likely to exhibit a wide variety of surface brightness profiles as a function of progenitor gas richness. Therefore an inclusive approach is physically motivated.
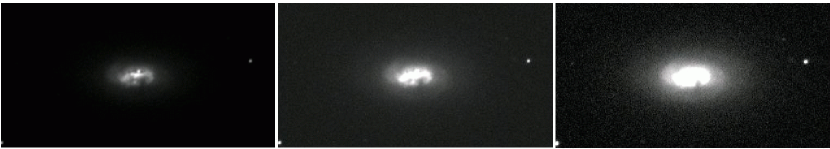
In practice, most E/S0s in the mass range of our analysis are S0 and S0/a galaxies. Our classification system downplays the importance of bulge-to-disk ratio as a defining characteristic of S0s, requiring only a bulge plus a smooth outer disk. From this point of view, the main criterion distinguishing an S0 from a spiral is the presence of extended spiral structure in the latter (as in the parallel sequences classification system of van den Bergh, 1976). Incipient central spiral structure or faint tidal features around a smooth outer disk may lead to an S0/a classification. The sharp boundary between S0/a and Sa is of course artificial, particularly in the context of our interpretation of blue-sequence E/S0s as a transitional population. Fig 2 shows three -band image stretches for a galaxy we judge to be literally on the borderline between S0/a and Sa. We choose to retain such galaxies on the S0/a side of the division; they make up 10% of confirmed blue-sequence E/S0s in the HyperLeda+ sample.
Nothing in the morphological definition of an E/S0 prohibits rings, bars, gas, dust, star formation, or companion interactions, provided these do not strongly affect the primary bulge+smooth outer disk morphology. Although we largely exclude major mergers in progress by rejecting HyperLeda+ systems marked as “multiple,” our samples include peculiar E/S0s such as polar ring systems and spheroids with shells or tails suggesting late-stage mergers.
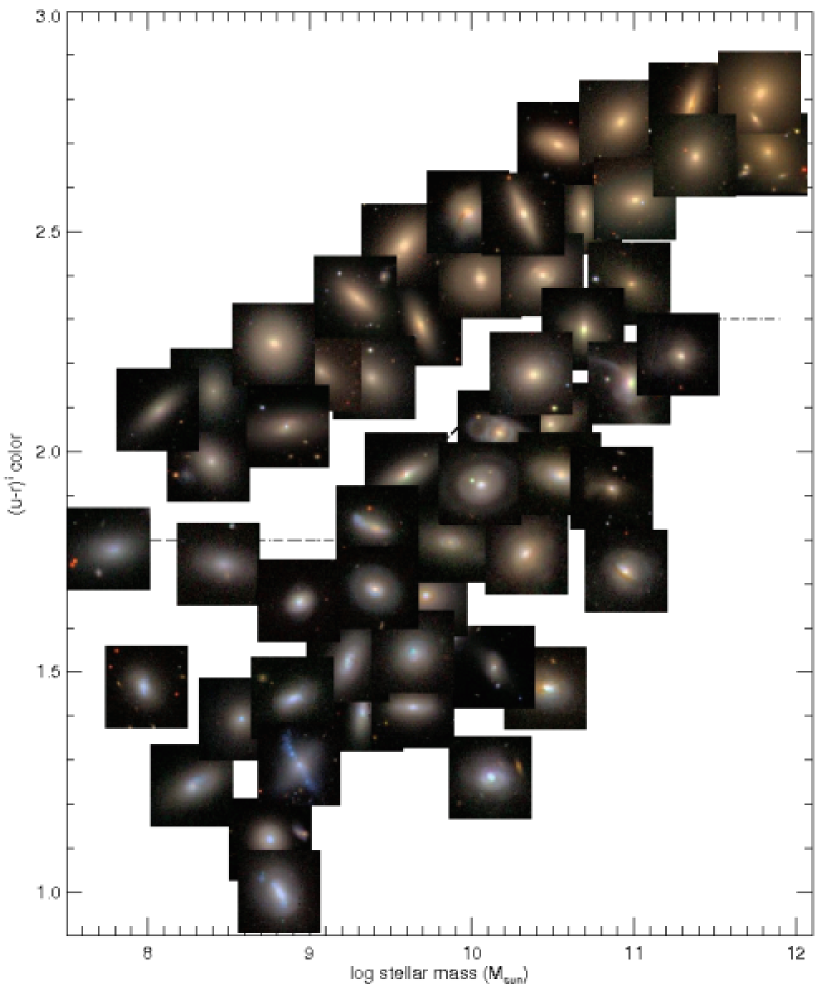
Fig. 3 shows a representative montage of E/S0 images from both sequences and both samples. We stress that the color SDSS cutout images in Fig. 3 do not necessarily reflect the morphology seen in the monochrome classification images: the cutouts highlight dust and color structure while downplaying low surface brightness outer disk features.
Three of the 15 NFGS blue-sequence E/S0s are also in the HyperLeda+ sample, but are not considered E/S0s in the latter sample. One is UGC 9562, the polar ring galaxy shown near (, color) = (9.2, 1.3) in Fig. 3; because this galaxy is classified as an Sd in the HyperLeda database, it was never a candidate for reclassification. The other two are UGC 6655 and IC 1144, which are listed as E/S0s in the HyperLeda+ database but are among the 60% of candidate blue-sequence E/S0s that we rejected upon inspection of SDSS images. Reinspection of the NFGS and SDSS images confirms that both are borderline cases, with the NFGS images making them look more like S0/a and the SDSS images making them look marginally later in type. To ensure uniform analysis, we do not change their classifications in either sample (i.e., they are plotted as late types in the HyperLeda+ sample). UGC 6655 is shown in Fig. 3 near (, color) = (8.3, 1.5). These discrepancies highlight the inexact nature of morphological classification; however, § 3.2 will show that E/S0s in both samples have structural properties that are quantitatively distinct from later type galaxies.
2.3. Stellar Mass Estimation
Stellar masses are estimated using an improved version of the stellar population fitting code described in Kannappan & Gawiser (2007). The code fits photometry ( or ) and integrated spectrophotometry (optional: NFGS only) with a grid of models built up from the simple stellar population (SSP) models of Bruzual & Charlot (2003) for a Salpeter (1955) Initial Mass Function (IMF). We rescale the final masses by a factor of 0.7 to approximate an IMF with fewer low-mass stars (the “diet” Salpeter IMF of Bell et al., 2003). Each model combines an old SSP (age 1.4, 2.5, 3.5, 4.5… 13.5 Gyr) plus a young SSP (age 25, 100, 290, or 1000 Myr). The young SSP makes up 0%, 1%, 2%, 4%, 8%, 16%, 32%, or 64% by mass; pure young SSPs are also allowed. Each SSP has metallicity = 0.008, 0.02, or 0.05 and the young SSP can take on 11 extinction/reddening values ( = 0, 0.12, 0.24… 1.2). Further details are given in Kannappan & Gawiser (2007).
Following Bundy et al. (2005), we define the stellar mass estimate not by the best fit, but by the median and 68% confidence interval of the mass likelihood distribution binned over the grid of models. The distributions imply typical uncertainties of 0.1–0.2 dex.666Distance errors are added in quadrature after mass estimation, as they are the same for all passbands and therefore excluded from the fits. In the binned likelihood approach, the density of models can affect results. Our current model grid improves on Kannappan & Gawiser (2007) in that the old population ages are equally spaced through time, and we weight the model space such that each of the four young ages contributes 0.25 its model likelihood, with the 11 ’s further subdividing the likelihood contribution. Note that having included in the models, we do not apply inclination-based internal extinction corrections to the input photometry used for mass estimation; however, the output likelihood distributions do not strongly constrain , so inclination-based extinction corrections remain the best option for computing (§ 2).
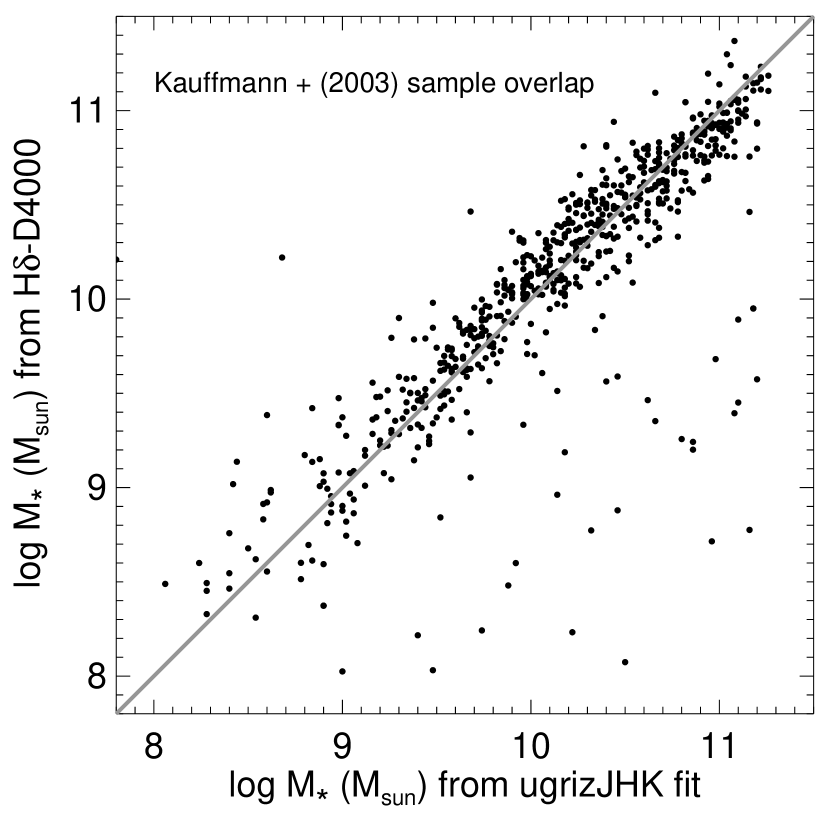
Kannappan & Gawiser (2007) report that systematic errors between different methods of stellar mass estimation can be as large as factors of 2–3, even with matched IMFs. Our mass normalization is fortuitously similar to that of Kauffmann et al. (2003), as seen in Fig. 4. Therefore the bimodality mass identified by Kauffmann et al. at 3 1010 has roughly the same value in this paper. This absolute mass scale is also similar to that found using the original Kannappan & Gawiser code with Bruzual-Charlot models, and as such is intermediate between the lower and higher mass scales found using either the Maraston (2005) models or the color- calibration of Bell et al. (2003), respectively. Thus our absolute scale is a reasonable compromise. However, the relative position of red- and blue-sequence E/S0s vs. spirals in - and - scaling relations may be sensitive to systematics in mass estimation between galaxy classes, where relative zero points between classes may vary with estimation method, and the possible effects of such systematics are discussed in § 3.2.
2.4. The Red/Blue Sequence Dividing Line
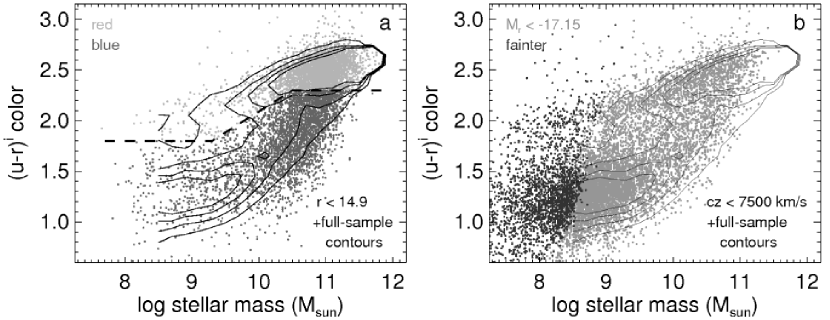
As shown in Fig. 1, we divide the red and blue sequences with a line that closely hugs the locus of late-type galaxies, leveling at and 2.3 in agreement with the functional divider of Baldry et al. (2004). The NFGS line is shifted to the 0.66 mag bluer scale and the 0.04 dex lower mass scale that result from using +spectra rather than as input data, based on empirical calibration using NFGS galaxies with SDSS photometry. We measure the 0.66 mag offset from E/S0s alone to best align the sequence division between samples; including Sp/Irr types gives a slightly larger 0.75 mag color offset.
Additional E/S0 systems, possibly analogous to blue-sequence E/S0s, lie in the minimally populated zone between the sequences (hereafter, “mid-sequence”). We separately track the two mid-sequence NFGS E/S0s seen in Fig. 1b near (, color) = (9.4, 1.3), while for the HyperLeda+ sample, mid-sequence E/S0s are grouped with red sequence E/S0s.
3. Demographics and Scaling Relations of Blue-Sequence E/S0s
Having robustly identified a population of blue-sequence E/S0s in two independent surveys, we now examine how this population compares with red-sequence E/S0s and late types in the overall galaxy population.
3.1. Numbers, Masses, and Environments
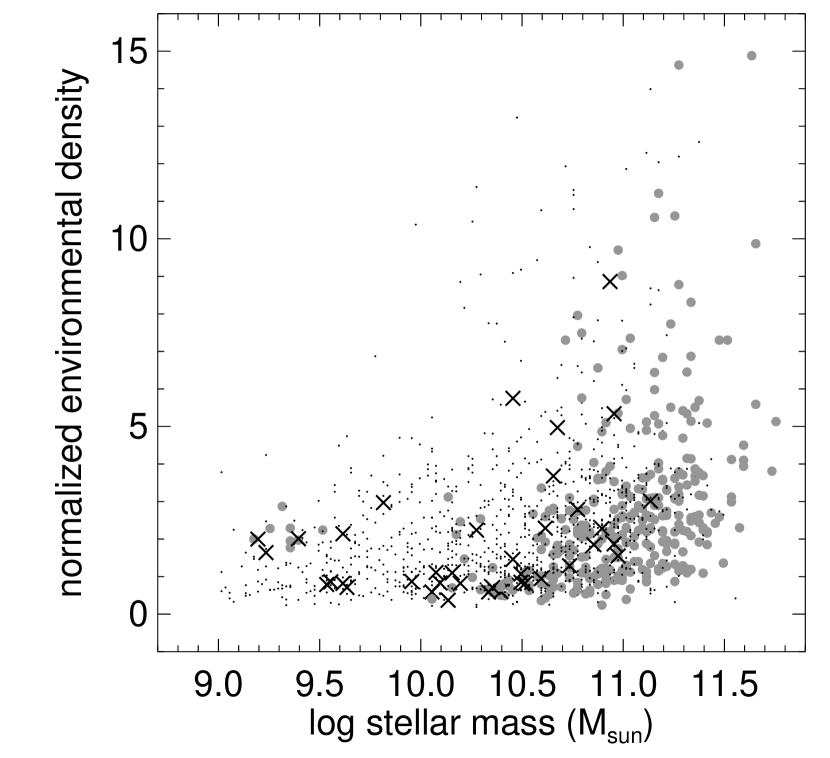
Raw NFGS numbers give the impression that blue-sequence E/S0s become dramatically more abundant with decreasing mass (Fig. 1), especially below . Here we take a closer look at these galaxies’ mass and environment distributions.
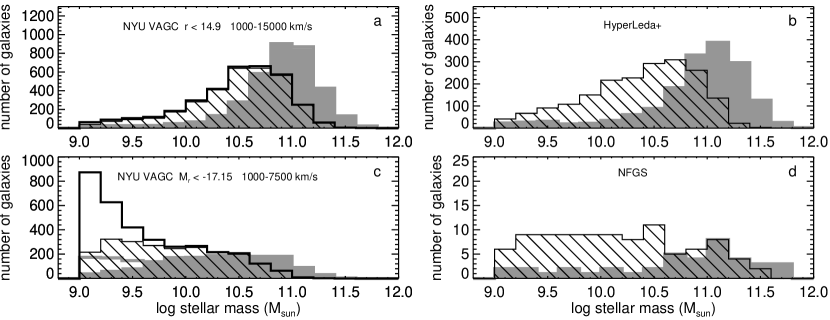
We compare the HyperLeda+ sample with the NYU VAGC in this analysis, where both are needed because the VAGC has a simple selection function without morphological type data, while the HyperLeda+ sample has morphological type data without a simple selection function. Fortunately, the HyperLeda+ sample closely resembles an apparent magnitude limited () subsample of the VAGC, within similar redshift limits (Fig. 5a and Figs. 6a-b).777Although the VAGC was designed to improve on the raw SDSS, it does not restore large angular-size galaxies shredded by the SDSS photometric pipeline and therefore omitted from the SDSS redshift survey. This fact presumably explains why Fig. 6b contains more high-mass galaxies than 6a. However, the more dominant blue sequence in the HyperLeda+ sample likely reflects the long history of -selected redshift surveys feeding into the HyperLeda+ database. Therefore it is reasonable to treat the HyperLeda+ sample as an approximate statistical sample, and we can correct for color and luminosity biases by binning the HyperLeda+ and VAGC data into mass bins within each color sequence, then computing a correction factor for each bin, equaling the ratio between the HyperLeda+ counts and the corresponding VAGC counts for a volume-limited VAGC subsample (Figs. 5b and 6c; defined by –7500 km s-1and , where the latter equals the VAGC’s limit at 7500 km s-1). This volume-limited subsample is largely complete in stellar mass to a limit of , as seen in Fig. 5, so we compute number statistics to this limit.
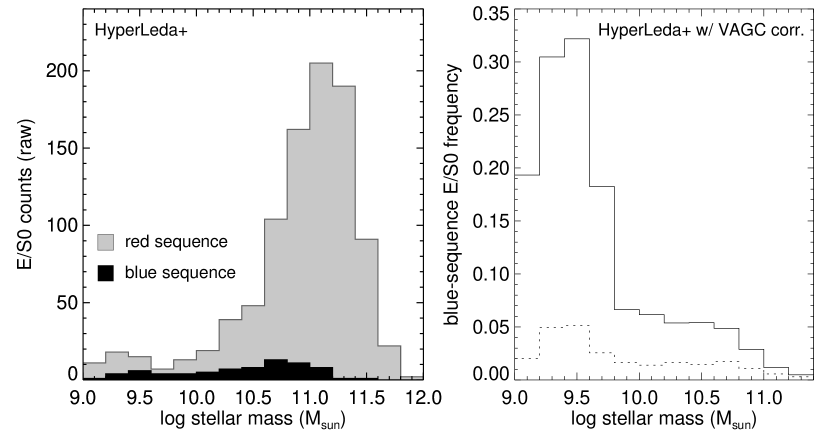
Fig. 7 presents both the raw HyperLeda+ red- and blue-sequence E/S0 counts and the completeness-corrected frequency of blue-sequence E/S0s as a function of stellar mass. The fraction of E/S0s on the blue sequence rises steadily with decreasing mass, from 2% at to 6% at , then shoots up to 20–30% below . The overall abundance of blue-sequence E/S0s relative to the galaxy population rises in tandem, from 0.5% to 2% to 5%. We have compared results using completeness corrections based on the simple volume-limited VAGC sample vs. based on a modified volume-limited subsample restricted by the same -band flux and error requirements used for the HyperLeda+ and NFGS samples. Although the -band restrictions reduce overall galaxy numbers below (Fig. 6c), they have minimal effect on relative numbers between the two sequences. For consistency, we present percentages computed with the -band restrictions. The decline in blue-sequence E/S0 frequency in the lowest-mass bin of Fig. 7 should not be overinterpreted, as shredding and explicit surface brightness selection criteria start to significantly affect SDSS and thus VAGC dwarf galaxy counts in this mass bin.
We emphasize that all of these blue-sequence E/S0 frequency estimates are lower limits, both because of our one-sided morphological reclassification effort (§ 2.2) and because mid-sequence E/S0s are grouped with the red sequence in the HyperLeda+ sample (§ 2.4). The uncorrected NFGS, which behaves somewhat like the -band restricted version of the VAGC volume-limited subsample (Fig. 6d), shows higher blue-sequence E/S0 fractions. However, these numbers may be affected by the survey’s -band selection, and the small number statistics and complex selection function of the NFGS make completeness-correcting it prohibitive.
Interestingly, Fig. 7 hints at a connection between red- and blue-sequence E/S0s below : while the two E/S0 families have very different mass distributions over all masses (K-S test probability of being drawn from the same population), their mass distributions below are indistinguishable (K-S test probability 0.9 of being drawn from the same population). We suggest that evolutionary processes affecting both red- and blue-sequence E/S0s may be changing across this mass scale, plausibly linking the emergence of large numbers of blue-sequence E/S0s to the onset of high cold gas fractions, bursty star formation, and disky morphologies, starting around and becoming more pronounced below (Kauffmann et al., 2003; Kannappan, 2004).
This suggestion agrees with the available environmental data for red- and blue-sequence E/S0s in the –10.5 mass regime, where most E/S0s seem to occupy similar, and notably low-density, environments (Fig. 8). Completeness corrections as a function of environment are infeasible for either of our samples, but within these data sets, the low-density environments of blue-sequence E/S0s appear correlated with their intermediate masses. This result finds support in the SDSS analysis of Hogg et al. (2003), who report a non-monotonic density trend along the red sequence, seen as a dip in typical density for intermediate-mass red-sequence galaxies despite higher densities at higher and lower masses (the latter likely due to the rise of dEs below 108–109 ). Contrary to common assumption, the environments of intermediate-mass E/S0s are not necessarily more dense than those of spiral galaxies, as seen in both Fig. 8 and Hogg et al. (2003). Neither result is immune to cosmic variance, but both demonstrate that intermediate-mass E/S0s are abundant in low-density environments where disk regrowth is plausible. Analysis of group dynamics would be beneficial for understanding the balance of cold gas accretion vs. quenching processes in blue-sequence E/S0 environments, but such an analysis is beyond the scope of this paper. We do consider evidence that interactions play a role in blue-sequence E/S0 evolution in § 4.1 and § 4.3.
Taken together, Figs. 7 and 8 may explain why blue-sequence E/S0s have been missed as an important population up to now, despite their large numbers. First, they emerge in numbers competitive with red-sequence E/S0s only below , so inevitably they are underrepresented in magnitude-limited samples. Second, blue-sequence E/S0s are rare in the dense cluster environments often targeted for studies of early-type galaxies.
3.2. - and - Scaling Relations
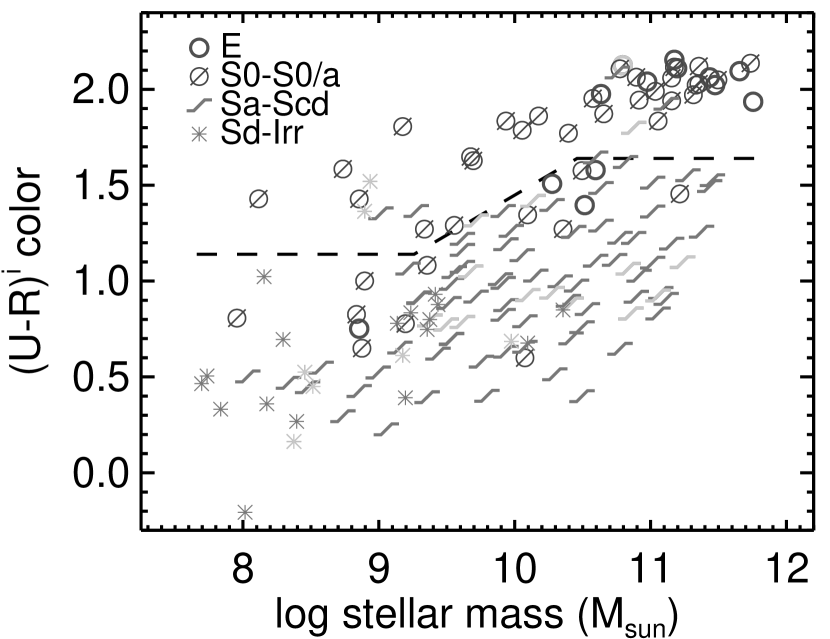
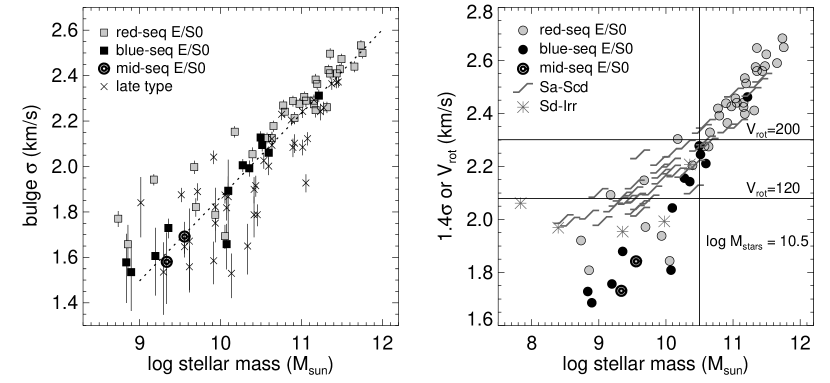
Blue-sequence E/S0s are more similar to red-sequence E/S0s than to late-type galaxies in both the -radius relation and the - (stellar velocity dispersion) relation (Figs. 9 and 10). This basic result validates their morphological classification. At the same time, both relations show hints that blue-sequence E/S0s may represent a transitional class, and that E/S0s on both sequences change in structure below –. The two NFGS E/S0s from the mid-sequence zone between the red and blue sequences appear most consistent with blue-sequence E/S0s in the - and - relations, but these mid-sequence systems fall within the scatter for both families of E/S0s.
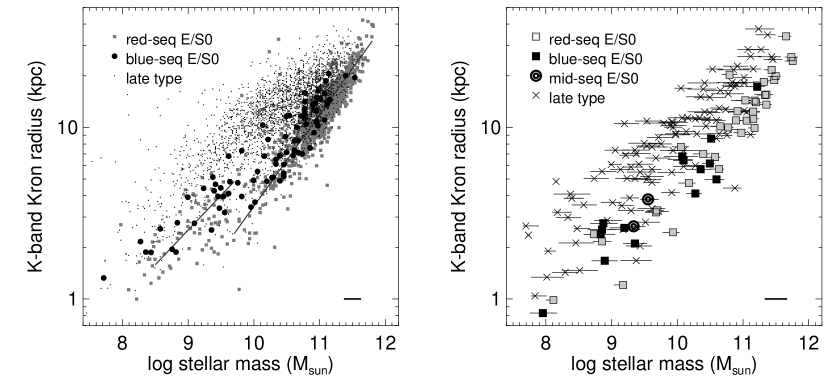
In the mass-radius relation, blue-sequence E/S0s scatter toward larger radii than red-sequence E/S0s at fixed mass. Moreover, many red- and most blue-sequence E/S0s follow a shifted mass-radius relation below (Fig. 9), in the same regime where blue-sequence E/S0s become abundant. The trend toward larger radii for blue-sequence E/S0s is not dramatic in this regime — below , its K-S test significance is only 2 — but it is reproduced in both samples (Fig. 9). To minimize the effect of stellar population differences on this result, we have adopted the -band elliptical Kron radius from the 2MASS database as our size measure. This radius is typically 2.5 the elliptical half-light radius (and is in fact defined as 2.5 the first moment of the light distribution), but in practice displays less scatter than in the mass-radius relation.
In the mass- relation, scatter increases dramatically below (Fig. 10), most notably for spirals and red-sequence E/S0s. Comparing residuals relative to the overall fit, K-S tests show that spirals and blue-sequence E/S0s are drawn from different parent populations at 3 confidence, whereas red- and blue-sequence E/S0s are consistent with the same parent population. Counting mid-sequence objects as blue- rather than red-sequence E/S0s slightly differentiates the two types of E/S0, yielding 17% probability that both are drawn from the same population below . To the extent that there are differences in this mass regime, blue-sequence E/S0s seem to have low stellar velocity dispersions more consistently, or equivalently, seem to lack scatter toward high dispersions. We suspect that the higher scatter in red-sequence values points to greater dynamical diversity, especially since this scatter is not driven by errors: the four high-dispersion red-sequence E/S0s below all have very small errors on . However, a larger sample would be needed to confirm the scatter difference statistically, and high-quality kinematic data sensitive to small values are not available for the HyperLeda+ sample.888SDSS velocity dispersions are limited to –1.9 due to instrumental resolution. Within slight differences in details of and estimation, our - relation agrees with that of Gallazzi et al. (2006) above , but we find higher scatter in at lower masses.
The mass- relation of Fig. 10 is not the Faber-Jackson relation between bulge mass and velocity dispersion, but rather the global relation between total stellar mass and central velocity dispersion. A galaxy’s position in this global relation may depend on bulge-to-disk ratio and on how much the system is supported by rotation, including whether the bulge is dynamically cold, as expected for a disky “pseudobulge” formed by disk gas inflow and central star formation (Kormendy & Kennicutt, 2004). For comparison, the right panel of Fig. 10 shows the global relation between internal velocity and stellar mass, adopting the simplistic assumption that spirals are rotation-supported and E/S0s are dispersion-supported, and scaling the dispersions to equivalent circular velocities by a factor of (e.g., Burstein et al., 1997). The four high-dispersion red-sequence E/S0s below follow the relation defined by spiral galaxies and high-mass E/S0s, whereas the lower-dispersion E/S0s fall short in dynamical support, implying that they are probably supported by rotation (as is common for E/S0s in this mass range; Davies et al., 1983; Bender et al., 1992). Unfortunately, in most cases the rotation velocities of the low-dispersion E/S0s are impossible to measure with our existing data, due to abundant warps and asymmetries in their ionized-gas and stellar rotation curves as well as frequent radial truncation of the ionized gas emission lines (see also § 4.3).
A tendency toward larger radii in blue-sequence E/S0s can be interpreted as consistent with either evolution from a more compact state via disk building or incomplete evolution toward greater central concentration, as in a post-merger starburst phase. Lower ’s for blue-sequence E/S0s would be more naturally explained in the disk-building scenario, assuming that in the post-merger scenario the galaxy should have experienced dynamical heating (e.g., Dasyra et al., 2006), but a gas-rich merger could involve immediate inner disk regrowth via inflows.
These results rely on stellar mass estimates that may vary systematically between subpopulations with different characteristic star formation histories, depending on the methods and assumptions used (Kannappan & Gawiser, 2007). Substituting stellar masses derived from the color- calibration of Bell et al. (2003) yields greater scatter in the - and -internal velocity relations and more strongly differentiates red- and blue-sequence E/S0s in these relations. The offset in radii between the two populations diminishes under this substitution but does not disappear. Conversely, adoption of the stellar masses derived by Kannappan & Gawiser using Maraston (2005) population synthesis models enhances the mass-radius offset while diminishing the mass- offset. However, revised mass calculations using the more representative model grid of star formation histories described in § 2.3 yield very similar results for Maraston and Bruzual-Charlot models.
4. Characteristics of Blue-Sequence E/S0s
Here we offer an overview of blue-sequence E/S0 properties, with special attention to properties relevant to evaluating the disk-building and fading-merger scenarios.
4.1. Morphologies
Blue-sequence E/S0 morphologies depend strongly on mass (Fig. 3). At high masses between and (–), many blue-sequence E/S0s resemble interacting galaxies or recent merger remnants. Of the 83 blue-sequence E/S0s in the HyperLeda+ sample, we assigned seven the type “pec-e” to indicate spheroidal but otherwise unclassifiably disturbed morphology, and all seven have masses between and . The 16 highest-mass blue-sequence E/S0s include five with “pec-e” morphology and two more with prominent tidal features or dust lanes. The – population is best probed by the HyperLeda+ sample because of its top-heavy luminosity distribution, but we find similar evidence for tidal features and interactions in two of the four highest-mass blue-sequence E/S0s in the NFGS sample. At the same time, this mass range is also where the red and blue sequences converge, and some high-mass blue-sequence E/S0s in the HyperLeda+ sample appear quite normal; these may simply be red-sequence E/S0s affected by scatter in .
At lower masses where blue-sequence E/S0s are common, strongly disturbed morphologies are rare. Most systems have fairly settled, disky morphologies. Faint tidal features and evidence of satellite interactions seem to be frequent but are hard to quantify (these features are not generally visible in the small, low-contrast cutouts in Fig. 3); two quantitative but indirect measures of external disturbance are discussed in § 4.3. In the NFGS sample, nearly all E/S0s with have S0–S0/a types, regardless of sequence (Fig. 1b), as most Es fall on the high-mass red sequence (consistent with the E and S0 luminosity functions, e.g., Binggeli et al., 1988). In the HyperLeda+ sample we find no unambiguous Es among 83 confirmed blue-sequence E/S0s (four galaxies are ambiguous between E and S0). Vetted types are not available for the red sequence for this sample.
An analysis of the detailed morphologies of E/S0s is beyond the scope of this paper, but we note two possibly interesting facts that merit further investigation: (1) the ratio between S0 and S0/a types is not obviously different between the red and blue sequences, based on the NFGS sample; and (2) bars, rings, and dust are evident in both red- and blue-sequence E/S0s (Fig. 3).
4.2. Colors, Gas, and Star Formation
Intermediate to low mass blue-sequence E/S0s are bluer than red-sequence E/S0s in both their outer disks and their centers, with the strongest statistical difference being for outer-disk colors (measured between the 50% and 75% light radii). Fig. 11 shows central and outer-disk colors for NFGS E/S0s, in the mass range below where we have similar numbers of objects on both sequences. The two mid-sequence E/S0s are separated out. Comparing the central and outer-disk colors for this subsample, 7 of 14 blue-sequence E/S0s (%) have centers bluer than their outer disks, whereas only 2 of 13 red-sequence E/S0s are blue-centered (%). The disparity is greater if we limit the comparison to masses below , yielding percentages % and %, respectively. The two mid-sequence E/S0s are both blue-centered, with outer-disk colors intermediate between those of typical red- and blue-sequence E/S0s. Note that these blue central colors are not caused by AGN: the three known AGN in our sample are all in red-centered systems (one Seyfert 2 and two LINERs, identified with NFGS nuclear spectroscopy: Jansen et al., 2000a). The high frequency of blue-centered profiles is intriguing as possible evidence for interaction-triggered central star formation (§ 4.3). Nonetheless, all of these systems have blue outer disks as well, as also seen in blue-sequence E/S0s that are not blue-centered.
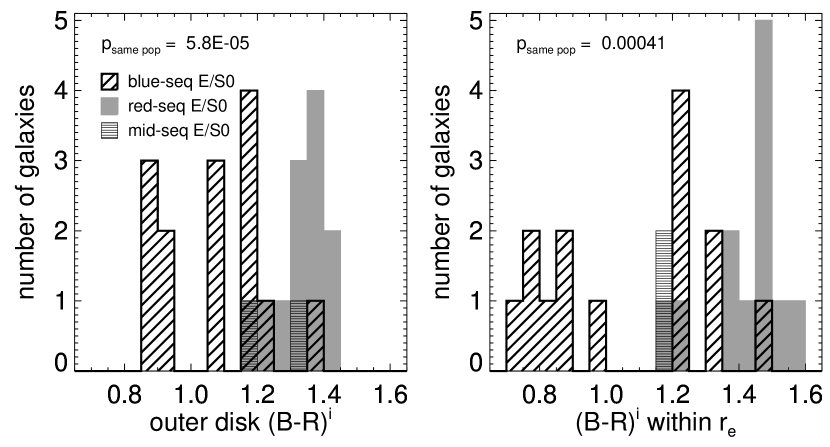
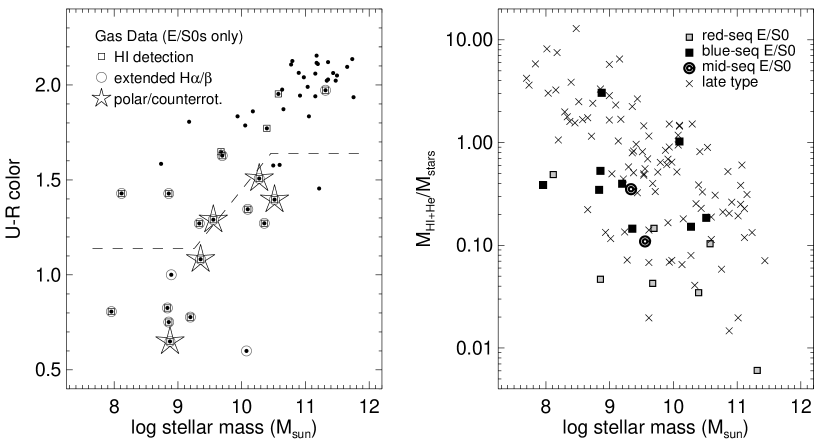
Fig. 12 displays gas detections and gas-to-stellar mass ratios for E/S0s in the NFGS sample. Stars mark five systems with counterrotating or polar-ring gas, to be analyzed in detail in § 5. Although the archival HI data are incomplete and the ionized gas detections are somewhat biased against red-sequence E/S0s,999Spectra for these systems were obtained in a wavelength range around H rather than the stronger H line. one can still see a pattern of more frequent gas detections below on the red sequence and below on the blue sequence, reflecting an overall increase in gas fractions for the entire galaxy population (Kannappan, 2004; Kannappan & Wei, 2008).
At a given stellar mass, blue-sequence E/S0s have more gas than red-sequence E/S0s, with atomic-gas–to–stellar mass ratios ranging from 0.1 to 1. However, the distributions overlap a bit and do not obviously preclude that some red-sequence and mid-sequence E/S0s may evolve toward the blue sequence, either gradually or in intermittent bursts, especially if their environments are favorable to fresh gas accretion.
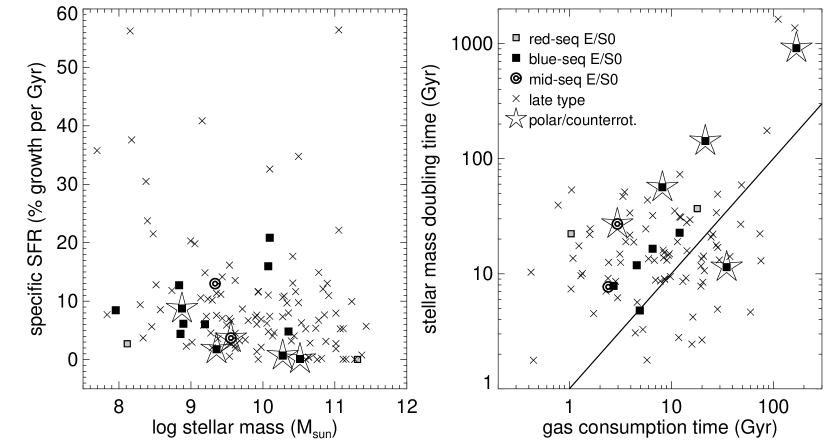
To assess the potential for morphological transformation in blue-sequence E/S0s, via either disk building or central mass growth, we consider several measures of star formation summarized in Fig. 13. We compute the specific star formation rate (SSFR), expressed in units of percentage growth per Gyr at the current star formation rate, as well as two star formation timescales: the stellar mass doubling time, equal to current stellar mass divided by current SFR, and the atomic gas consumption time, equal to atomic gas mass divided by current SFR. These are approximate, instantaneous measures, uncorrected for any future decline in SFR, recycling, or infall. Star formation rates are derived from integrated spectral line data from the NFGS database, originally obtained by scanning the slit across each galaxy (Jansen et al., 2000a). We correct for extinction and convert to the common scale calibrated against IRAS-based SFRs by Kewley et al. (2002). Where available, we adopt the catalogued “H” SFRs provided by Kewley et al., and we compute SFRs for additional galaxies in our sample using integrated H fluxes provided by R. A. Jansen (private communication, 2001). All SFRs are converted to our and IMF.
From these data, blue-sequence E/S0s have SSFRs comparable to those of spiral galaxies (Fig. 13a). Rates of transformation range from 2–20% per Gyr. While SSFRs generally increase toward lower mass for both spirals and E/S0s, the two most rapidly transforming E/S0s have masses between and . The highest-mass systems appear quiescent, as do most red-sequence E/S0s, but one mid-sequence system is evolving at a rate of nearly 15% per Gyr.
Most blue-sequence E/S0s, as well as two red-/mid-sequence E/S0s, have enough gas to form stars for several Gyr. Fig. 13b shows doubling time vs. gas consumption time. To the left of the line of equality, galaxies cannot double their stellar masses without fresh gas accretion (unless the unmeasured molecular gas mass is large). Four blue-sequence E/S0s and one mid-sequence E/S0 combine doubling times less than a Hubble time with gas consumption times that are either longer or 2–3 shorter, implying significant evolution even in an unrealistic closed-box scenario. Notably, the two-blue sequence E/S0s whose gas consumption times match or exceed their stellar mass doubling times are both engaged in strong interactions with smaller, but substantial, companions.
While the above analysis suffers from incomplete data (in particular, one of the two high SSFR systems in Fig. 13a lacks HI data in in Fig. 13b), our results confirm the plausibility of the basic premise of morphological evolution. Further analysis of potential structural changes will require resolved gas and star formation data, which will soon be available from Spitzer, GALEX, GBT, CARMA, and VLA programs underway (Wei et al., in prep., and Moffett et al., in prep.).
4.3. Interaction Status
We have already established the importance of strong interactions for high-mass blue-sequence E/S0s, based on their morphologies (§ 4.1). However, weaker interactions such as satellite accretion events are not easy to identify cleanly based on morphology. Here we offer two other lines of argument to support our subjective impression that minor interactions are important for blue-sequence E/S0s below .
First, the close correspondence between blue-sequence E/S0s and blue-centered color gradients found in § 4.2 may reflect star formation triggered by interactions. In an earlier study of NFGS galaxies of all types, Kannappan et al. (2004) showed that blue-centered color gradients correlate with morphological peculiarities suggestive of minor mergers and argued that tidal forces in these accretion events can trigger disk-gas inflows and central star formation, possibly leading to the formation of disky “pseudobulges” (Kormendy & Kennicutt, 2004). Most of our blue-centered E/S0s were not flagged in this prior study as morphologically peculiar, perhaps because by definition E/S0s are fairly regular. Therefore if blue-centered color gradients in E/S0s reflect recent interactions, the disturbances are likely mild.
As evidence that such mild disturbances may indeed be at work, we find that below , 6 of 11 (%) blue-sequence E/S0s with ionized gas rotation curves in the NFGS database show strong rotation curve asymmetries (10% in the asymmetry metric of Kannappan & Barton, 2004). Five of these six are also blue-centered, although that correspondence is not statistically significant given the small numbers. More significantly, the rate of strong asymmetries for blue-sequence E/S0s is 3 times that seen for the general galaxy population in this mass range (%). Unfortunately, too few red-sequence and mid-sequence E/S0s in our sample have the extended emission lines necessary to measure rotation curve asymmetries: only 5 have gas rotation curves, of which 3 are truncated at 0.9.
Of course, companion statistics would be valuable in assessing the role of external disturbances. While small satellite data are not yet available, we have identified large companions within 300 kpc and 300 km s-1 of all NFGS galaxies that lie inside the boundaries of the Updated Zwicky Catalog (UZC; Falco et al., 1999). These data reveal similar large-companion rates101010Here “large” signifies “as much as 1 mag fainter,” because the UZC was derived from the CfA 2 redshift survey catalog, whose limiting magnitude is 1 mag fainter than the CfA 1 survey from which the NFGS was selected. among red-sequence E/S0s, blue-sequence E/S0s, and late-type galaxies, subject to data incompleteness. If anything, the rate of large companions may be marginally lower among blue-sequence E/S0s. Clearly this question would benefit from further investigation.
5. Counterrotating and Polar Disks: Secondary Stellar Disk Growth
An especially distinctive feature of blue-sequence E/S0s is their association with counterrotating gas and polar rings. As shown in Fig. 12, all five NFGS E/S0s with decoupled gas lie on or near the blue sequence. Whether and how these galaxies may form stars in their decoupled gas is highly relevant to understanding the evolutionary destiny of blue-sequence E/S0s. Here we examine these case studies in some detail, deferring a more general discussion of formation scenarios to Section 6.
5.1. The Polar Ring: Triggered Stellar Disk Growth
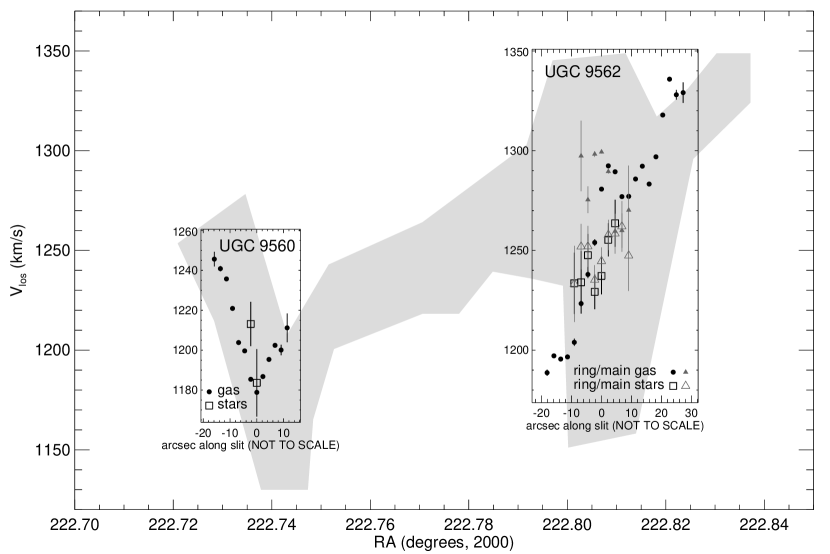
The polar ring galaxy UGC 9562 is the bluest and lowest-mass of the five decoupled gas systems and contains an obvious secondary stellar disk, i.e., the ring. This system is shown in Fig. 3 with (, color) near (8.9, 1.3). UGC 9562 has recently interacted with a companion, but Cox et al. (2001) argue based on stellar population analysis and HI gas morphology that the interaction has simply triggered star formation in a preexisting gas ring. Fig. 14 shows new evidence for the preexisting gas scenario, based on data reported in Guie et al. (2005). We plot the ionized gas and stellar kinematics for UGC 9562 and its companion overlaid on the HI position-velocity cut along the major axis of the gas between the galaxies (see Fig. 3 of Cox et al., 2001). As observed by Cox et al., the HI connecting the galaxies appears to form a distinct structure from the ring. Moreover, our new data show that near the center of UGC 9562, its ionized gas has higher line-of-sight velocity than its stars, while the companion’s ionized gas and stars both have somewhat lower line-of-sight velocities than UGC 9562’s stars. These observations are not conclusive but most naturally suggest a recent flyby event in which previously accreted gas was tugged and disturbed, rather than an event in which the lower-velocity system directly donated the high-velocity gas.
These results support the preexisting gas scenario, which implies that (a) a new stellar disk is forming in situ in gas that has accreted onto a previously formed E/S0 and that currently dominates the total mass (), and (b) the mechanisms and timescales of gas and stellar disk formation may be distinct, with stellar disk growth being potentially bursty and possibly requiring a trigger. Cosmological simulations suggest a picture in which massive polar rings may form via cold-mode accretion (Macciò et al., 2006), consistent with observations that favor a slow gas accretion scenario for another polar ring, NGC 4650A (Iodice et al., 2006).
5.2. The Counterrotators: Past and Present Disk Growth
The other four E/S0s marked with stars in Fig. 12 were identified by Kannappan & Fabricant (2001) in a systematic search for NFGS galaxies with counterrotating gas and stars. Fig. 15 shows new, high S/N stellar absorption line cross-correlation profiles for these galaxies, revealing their stellar velocity substructure as a function of slit position. These data were obtained in May 2001 with the Blue Channel spectrograph on the MMT, using a configuration with binning and km s-1 resolution centered on the Mg I triplet at 5175Å. The spectra are identical to those in the standard NFGS database, except that deep 1 hr exposures enable us to search for secondary stellar velocity components. We measure the cross-correlation profile as a function of velocity at each slit position using xcsao in the rvsao package of IRAF (Kurtz et al., 1992), correlating against non-rotating G and K giant stars observed in the same instrumental configuration. Here we consider what may be learned from the raw cross-correlation profiles, deferring full modeling of the line-of-sight velocity distributions.
Secondary stellar components that rotate with the gas are clear in two systems: (1) the very disky elliptical NGC 7360, which shows resolved X-structure in its cross-correlation profiles, indicating oppositely rotating stellar components; and (2) the low-mass S0 NGC 3011, which shows stars and gas that rotate together in the central region, but in opposite senses at large radii, with profile asymmetries suggesting that the stellar component that rotates with the gas may be present but subdominant and unresolved at larger radii. Profile asymmetries in a third system, NGC 5173, likewise suggest the possibility of an extended, unresolved secondary stellar component rotating with the gas. While the asymmetries are not conclusive by themselves, a young stellar disk is detected morphologically in this galaxy, whose primary round E component hosts an inclined large-scale spiral disk with blue knots (Vader & Vigroux, 1991).
In contrast with these three systems, the fourth counterrotator, UGC 6570, shows no hint of a secondary stellar component, although its outer velocities seem to reflect a strong warp or distortion, perhaps from a recent interaction. This galaxy may be the exception that proves the rule regarding secondary stellar disk formation. We suspect that its gas arrived too recently to have had time to form stars, because spectra at different position angles indicate that the gas rotates in a tilted plane relative to the stars (Kannappan & Fabricant, 2001), which is an unstable and short-lived configuration. If such an accretion event only recently pushed UGC 6570 off the red sequence, then its status as a mid-sequence E/S0 between sequences may change as star formation proceeds, so that it may soon join the other polar/counterrotating gas systems on the blue sequence.
It is empirically clear that three of our four counterrotators have managed to form significant secondary stellar components, at least one of which seems to be gaining dominance from the inside out (NGC 3011), and another one of which has unmistakably substantial mass (NGC 7360). Yet these systems have only 10–20% gas fractions and among the lowest SSFRs in Fig. 13. Bulk accretion of both gas and stars from an outside galaxy into a disk-like secondary component seems unlikely to explain these galaxies, considering that the mid-sequence system UGC 6570 appears to contain externally accreted gas without accompanying stars (as we also infer for the polar ring system in § 5.1). Also, in most of these systems the counterrotating gas is extended, sometimes well beyond the stars (NGC 7360 shows HI and H emission out to 3 its optical radius; Kannappan, Matthews, Christlein, et al., in prep). We suspect that the disparity between past and current star formation reflects a history of intermittent bursts of enhanced stellar disk growth, occurring independent of gas disk growth. Also, the presence of coextensive counterrotating stellar populations may exacerbate such intermittency, if the galaxy is stabilized against forming spiral arms or other structures, so that only strong interactions can revive star formation (Kannappan, Matthews, Christlein, et al., in prep).
Our detection rate of 2 definite + 1 probable counterrotating stellar disks in a sample of 4 gas-stellar counterrotators may seem to contradict the null result of Kuijken et al. (1996), who surveyed 28 S0 galaxies for counterrotating stellar disks and found none. However, we note that they analyzed only 4 systems with gas-stellar counterrotation, so the samples that are relevant to compare are tiny and may differ in crucial parameters such as mass and color. The fact that Kuijken et al. could not find any counterrotating stellar disks in S0s without gas might also have another explanation: if counterrotating stars reflect disk regrowth, then S0s with counterrotating stars may be on their way to becoming spiral galaxies. If this conversion is efficient, the condition of still having S0 morphology but having built up a detectable counterrotating stellar disk may be an unusual state, becoming long-lived only when the disk regrowth process is quenched prematurely.

6. Discussion
While individual blue-sequence E/S0s have been studied for years without being identified as a class, recognizing these galaxies as a coherent population opens the way to understanding their role in the story of galaxy evolution. Below, we break down blue-sequence E/S0 formation scenarios as a function of mass, then take a closer look at the disk regrowth scenario in light of other studies. We close by considering how these results may affect our understanding of galaxy evolution from .
6.1. Evolution in Three Mass Ranges
Taken together, our results suggest that blue-sequence E/S0s are a composite population, reflecting different physical processes in different mass regimes. We distinguish three regimes: above the shutdown mass , below the threshold mass , and in the intermediate range centered on . The intermediate regime is the primary mass regime of large spiral galaxies and as such defines a coherent population; however, blue-sequence E/S0s in the upper and lower halves of this regime show distinct evolutionary trajectories.
Above , blue-sequence E/S0s are virtually nonexistent, as the blue sequence itself largely disappears. From up to (–11.2), there is a clear decline in the frequency of blue-sequence E/S0s (Fig. 7), and their morphologies often show signs of strong disturbance. Their 1% abundance relative to other massive galaxies is roughly comparable to the frequency of close pairs, suggesting an approximate correspondence to the merger rate, depending on relative time spent in the close-pair and fading-starburst phases (e.g., De Propris et al., 2007; Domingue et al., 2009). These results point to major and substantial minor mergers as the probable source of most high-mass blue-sequence E/S0s. Because cold gas is generally scarce in E/S0s with masses above — both within the galaxies and in their typically dense environments (Figs. 8 and 12) — high-mass blue-sequence E/S0s are likely to exhaust all available gas in their current post-merger phase and migrate permanently to the red sequence (“quenching mergers”). However, limited disk building is also occurring in this mass regime (e.g., NGC 7360, § 5).
At the other extreme, below the threshold mass , blue-sequence E/S0s show little resemblance to canonical major-merger remnants. Here blue-sequence E/S0s make up 20–30% of all E/S0s and 5% of all galaxies. The coincidence of their emergence with a general rise in gas richness for the entire galaxy population (Kannappan, 2004; Kannappan & Wei, 2008) strongly suggests that the availability of cold gas is fundamental to their existence.
Intermediate-mass E/S0s from down to are often gas rich as well, at least on the blue sequence, and our two most rapidly growing E/S0s lie in this mass range (Fig. 13). Available environmental data reveal a strong shift toward lower density environments for E/S0s below , down to at least 109 , so fresh gas accretion seems plausible (Fig. 8; recall that cluster dEs become abundant at lower masses). The shift in environments applies to both red- and blue-sequence E/S0s, and the two populations roughly track each other in numbers below (Fig. 7 and § 3.1), but red-sequence E/S0s from down to can be gas poor nonetheless. In this mass range, red-sequence E/S0s seem to show greater diversity in than blue-sequence E/S0s (within small number statistics; see Figs. 10). A shifted -radius relation becomes dominant below for E/S0s on both sequences, but some red-sequence E/S0s fall on an extension of the higher-mass -radius relation (Figs. 9). Blue-sequence E/S0s make up 5–7% of all E/S0s and nearly 2% of all galaxies between and , potentially reflecting evolution in both directions between the sequences rather than uni-directional quenching.
6.2. Forming and Re-Forming Disks
Our data suggest that blue-sequence E/S0s in mass and environment regimes with abundant cold gas are most likely engaged in building disks. Blue outer disks are the strongest statistical signature of blue-sequence E/S0s (§ 4.2), and a number of them show evidence for secondary stellar disk growth in counterrotating or polar gas (§ 5). At the same time, the fact that blue-sequence E/S0s are more compact and dynamically hotter than spirals, and more similar to red-sequence E/S0s than spirals in scaling relations, suggests that most of these E/S0s have passed through a violent merger phase at some point in their formation history (§ 3.2). Other processes that could yield compact structure, e.g., harassment, are less prevalent in the modest-density environments seen for the sub- E/S0s in our samples. Moreover, these processes would not be expected to produce blue outer disks or secondary disk growth. Thus the extended blue disks seen in blue-sequence E/S0s plausibly represent true disk regrowth over merger-formed early type galaxies, as envisioned in hierarchical models (e.g., Steinmetz & Navarro, 2002; Governato et al., 2007).
A variety of hints in the literature point to the likelihood of disk regrowth around E/S0s, especially S0 galaxies. Many S0s contain gas that appears to have an external origin: HI rings tilted out of the stellar disk (van Driel & van Woerden, 1991), polar rings (Bettoni et al., 2001), or counterrotating gas (Bertola et al., 1992); see also Sage & Welch (2006). These extended HI disks and rings are often associated with star formation and/or faint extended stellar disks (Hawarden et al., 1981; van Gorkom et al., 1987; Noordermeer et al., 2005; Jeong et al., 2007). “Antitruncated” disks with a low surface brightness component that dominates at large radii are also reported in S0s (Erwin et al., 2005). Recent star formation in E/S0s may be substantial, involving 10% of the stellar mass, especially in field S0 galaxies (Annibali et al. 2007; Nolan et al. 2007; Kaviraj et al. 2007b; Schawinski et al. 2007; see also Gallazzi et al. 2006; Donas et al. 2007). In polar ring galaxies and other systems where secondary disks can be isolated, these components can be very massive (§ 5; Bettoni et al., 2001).
We speculate that disk-building E/S0s may (re)join the spiral sequence when secondary disks become dominant, perhaps helping to explain the surprising scarcity of S0s with two counterrotating stellar disks (§ 5.2; Kuijken et al., 1996) and the existence of peculiar objects like the prolate-bulge Sbc galaxy UGC 10043 (Matthews & de Grijs, 2004), which could be a former polar ring galaxy whose ring has become a large disk around the central E/S0. To grow into spiral galaxies, blue-sequence E/S0s must grow on average by a factor of 2 in radius (Fig. 9), representing a huge increase in mass. Thus (re)forming a late-type system on a cosmologically relevant timescale will require two things: abundant gas and efficient star formation.
Efficient star formation does not seem to characterize the most massive gas-rich S0s (Oosterloo et al., 2007), which include galaxies such as Malin 1 (recently exposed as an S0 at heart by Barth, 2007) and NGC 3108 (Hau et al., 2008). Inflow mechanisms appear to be ineffective for E/S0s with dispersions km s-1 (Serra et al., 2008), equivalent to (Fig. 10). Nonetheless, minor mergers may help to drive disk gas inward in intermediate-mass E/S0s, fueling residual star formation (Kauffmann et al., 2007; Kaviraj et al., 2007a).
The real action, however, starts below and increases below , down to 109 . Here blue-sequence E/S0s are likely to have formed in mergers of very gas-rich progenitors (i.e., galaxies typical of this mass regime: Fig. 12; Kannappan 2004; Kannappan & Wei 2008). The remnants would have inherited substantial gas through the fallback of tidal debris (Barnes, 2002; Robertson et al., 2006; Stewart et al., 2009). Moreover, the sub- mass regime may permit continued growth by efficient cold-mode gas accretion (Birnboim & Dekel, 2003; Kereš et al., 2005; Dekel & Birnboim, 2006). Subsequent interactions can also supply fuel for star formation, via direct accretion of gas-rich satellites, gas transfers, or compression of ambient gas.
Star formation becomes remarkably efficient for E/S0s below , and the two most strongly evolving blue-sequence E/S0s in the NFGS, whose current SFRs correspond to 20% mass growth per Gyr, have (Fig. 13). This result may seem counterintuitive, since below , most disk galaxies are late-type dwarfs (Sd, Sm, Im), which have notoriously inefficient star formation compared to classical large spirals. However, recent work suggests that this inefficiency may be linked to low surface mass densities rather than to low masses per se. Kauffmann et al. (2006) report that evidence of higher-intensity, shorter starbursts increases with stellar surface mass density for disk-dominated galaxies, reaching a peak at a characteristic kpc-2 before falling off for higher-mass/more spheroid-dominated systems as the star formation rate per unit stellar mass SFR decreases. The characteristic corresponds to a characteristic concentration index – (where is defined by the ratio of the radii containing 90% and 50% of the light in the SDSS band). Galaxies near the characteristic and are common from up to just below (see Kauffmann et al.’s Figures 1 and 2).
Intriguingly, blue-sequence E/S0s have nearly optimal : based on SDSS data for 73(50) NFGS galaxies below (), blue-sequence E/S0s have mean (2.54), with standard deviation 0.45, whereas late-type galaxies have (2.28) with standard deviation 0.40, and red-sequence E/S0s have (2.86) with standard deviation 0.30. Kauffmann et al. interpret the peak in burst intensities near the characteristic in terms of short gas consumption times for accreted clouds (equivalent to high star formation efficiencies), because they see fairly constant SFR over the range of below the characteristic value. However, constant SFR implies relatively lower SFR for gas-rich late-type galaxies, a non-trivial distinction in the sub- regime (Fig. 12; Kannappan, 2004; Kannappan & Wei, 2008). Therefore, the Kauffmann et al. results are consistent with both higher SFR and higher-intensity bursts for blue-sequence E/S0s compared to spiral or red-sequence E/S0 galaxies, apparently as a direct corollary of having surface mass densities near the characteristic value.111111Exactly what sets the optimal surface density is unclear in the absence of information on gas content, , or the timing of gas accretion relative to starbursts. The population-averaged trends seen by Kauffmann et al. must include a variety of physics, as emphasized by the falloff in burst intensities above the characteristic . Both local disk dynamics and global effects of gas-rich minor or major mergers may link higher star formation efficiencies with higher , while quenching mergers may work the other way.
It would seem that most blue-sequence E/S0s (and likely some red-sequence E/S0s and non-E/S0 blue compact galaxies) lie in a sweet spot for disk building, with surface mass densities ideal for efficient star formation and masses low enough for abundant gas accretion. We conjecture that passing through a blue-sequence E/S0 or similar phase in this sweet spot may enable a galaxy to escape the low surface density dwarf regime and form a large spiral disk. This conjecture is consistent with observations that massive disk galaxies, no matter how thin or low surface brightness, always seem to show a bulge component (Dalcanton et al., 2004; Sprayberry et al., 1995). The blue-sequence E/S0s we have analyzed are a natural progenitor population for large spiral galaxies with masses up to , and this evolutionary link is likely to extend to higher masses at higher (see § 6.3). However, the physics of this transformation, and particularly the growth of the disk beyond the radius of the original E/S0, is not yet clear.
As the bulges of many late-type galaxies are disky, any late-type regeneration process should be able to form disky bulges. We may see this happening in blue-sequence E/S0s, whose frequent blue-centered color gradients and kinematic disturbances plausibly reflect episodes of pseudobulge growth triggered by weak interactions (§ 4.3; see also Kannappan et al., 2004). Externally or internally driven gas inflows can gradually build a larger pseudobulge over a classical bulge, as is seen in the detailed HST decomposition of two S0s (Erwin et al., 2003). In fact, pseudobulges are quite common in S0s (e.g., Laurikainen et al., 2006), and Barway et al. (2007) find evidence for a sharp transition in the scaling between S0 bulge and disk radii below (in our system, equivalent to –10.9), which they interpret as evidence of pseudobulge growth. We suspect that nearly all blue-sequence S0s have pseudobulges, given their modest velocity dispersions, whereas the large scatter in red-sequence E/S0 velocity dispersions probably indicates a variety of bulge types. Only systems in which the central spheroid is protected from gas inflows, as in a polar ring configuration, might preserve the original spheroid while building just the outer disk (as for the aforementioned prolate-bulge galaxy UGC 10043).
The timescale for disk regrowth is probably longer than a typical merger timescale, given that most blue-sequence E/S0s show relatively regular morphology, and that their frequency in the galaxy population exceeds that of close pairs (except near ; Fig. 7 and § 6.1). However, small bursts of growth must be common, as 50% of blue-sequence E/S0s show blue-centered color gradients and/or kinematic asymmetries (§ 4.3, 4.2, and 5). Bursty disk growth appears to be the norm for large disk galaxies, if the star formation and accretion histories of the Milky Way and M31 are representative (Rocha-Pinto et al., 2000; de la Fuente Marcos & de la Fuente Marcos, 2004; Helmi et al., 2006; Ibata et al., 2005; Elmegreen & Scalo, 2006). In fact, Hammer et al. (2007) argue that the Milky Way’s history may be considered unusually quiet (but see James et al., 2008). A variety of evidence suggests that disk galaxies receive regular fresh gas infall sufficient to fuel episodic bursts (Sancisi et al., 2008).
The likelihood of intermittent growth and/or dust-enshrouded star formation implies that some former or future blue-sequence E/S0s should fall on the red sequence. Consistent with this picture, we find regimes of overlap in red-and blue-sequence E/S0 properties (gas fractions, radii, velocity dispersions), with substantial diversity among red-sequence E/S0s. With existing data, we cannot measure rotation velocities for the dynamically cold red- and blue-sequence E/S0s in our sample (§ 3.2), but many have stellar masses sufficient to join the spiral-galaxy Tully-Fisher relation above (i.e., above 120 km s-1), provided they grow large rotating disks (Fig. 10). One such blue-sequence S0, UGC 12265N, has enough gas to double its stellar mass and is engaged in a strong interaction with a smaller but substantial companion, driving stellar mass growth at a rate of 20% per Gyr (§ 4.2). Because the eventual merger should be too gas rich to destroy the disk (Hopkins et al., 2009), this galaxy will almost certainly develop spiral structure as the disk forms stars and responds to tidal forces in the interaction. Such an event may mark the birth of a large spiral galaxy.
6.3. Implications for Galaxy Evolution from
Most of the above discussion refers to a snapshot at . Given the downsizing of the bimodality mass, e.g., as seen in the downsizing of the crossover mass for E/S0 and late-type mass functions from close to at to today (Bundy et al., 2005), we suspect that the gas-richness threshold mass has also evolved from . We therefore expect analogues of blue-sequence E/S0s to show strong disk-building activity up to the equivalent threshold mass at , which might naively be expected to fall 1 dex below the crossover mass, i.e. near a few 1010 (similar to today’s ). Conversely, a noticeable fraction of galaxies with masses up to may represent the end states of high-redshift blue-sequence E/S0s (or dusty red-sequence analogues; Hammer et al., 2005) that have rebuilt disks. Consistent with this expectation, Sargent et al. (2007) report from the COSMOS survey that the number density of large disks with bulges has doubled since , whereas they see no increase, and possibly a small decrease, in the number density of bulgeless disks at . These results point to the importance of forming bulges before building large disks, i.e., merging gas-rich bulgeless late types to form E/S0s may be an enabling step in large disk galaxy formation (as also suggested by the star formation efficiency considerations in § 6.2).
Analogues of today’s sub- blue-sequence E/S0s, with masses up to a higher threshold mass perhaps near a few 1010 , must certainly exist in high- samples of blue spheroids, blue-cored spheroids, and luminous blue compact galaxies (e.g., Im et al., 2001; Menanteau et al., 2001; Treu et al., 2005; Elmegreen et al., 2005; Lee et al., 2006). Type-dependent luminosity function analyses reveal abundant blue E/S0s, whose luminosity distribution parallels that of late-type Irr/Pec systems, the analogues of today’s dwarf galaxies (Cross et al., 2004; Menanteau et al., 2006). Kaviraj et al. (2008) report a split in the color distribution of –1 E/S0s, with a “minor but significant peak” on the blue sequence. Several authors have suggested links between blue compact systems and the bulges of today’s large spirals (Kobulnicky & Zaritsky, 1999; Barton & van Zee, 2001; Puech et al., 2006). However, both blue/blue-cored spheroids and blue compact galaxies are composite populations, containing galaxies representing a wide range of masses, environments, and formation scenarios (Lee et al., 2006; Noeske et al., 2006; Barton et al., 2006). Even at , we have seen that evolutionary scenarios for blue-sequence E/S0s are a sensitive function of mass. Also, the bulk of the systems we have described reside in field environments, whereas blue or blue-cored E/S0s in clusters are more likely to reflect transient states as a prelude to quenching by harassment, stripping, or strangulation (Koo et al., 1997; Rose et al., 2001; Lisker et al., 2006). Moreover, the abundance of AGNs among blue spheroids is disputed (Lee et al., 2006; Treu et al., 2005). Quantitative assessment of the disk regrowth picture will therefore require careful decomposition of high- samples to isolate analogues of the disk-building blue-sequence E/S0s analyzed here.
7. Conclusion
We have examined the existence, properties, and evolutionary trajectory of a substantial population of morphologically defined E/S0s that fall on the blue sequence in color-stellar mass space, i.e., the usual locus of late-type disk galaxies. Our analysis of blue-sequence E/S0s has relied on two independent data sets (the NFGS and HyperLeda+ samples) and uses a third survey to calibrate completeness (the NYU VAGC low-redshift sample). Key results are summarized here.
-
•
We identify three stellar mass scales of interest: the “shutdown mass” above which blue-sequence E/S0s (and the blue sequence) generally do not exist; the “threshold mass” below which blue-sequence E/S0s become extremely abundant; and the “bimodality mass” marking the midpoint of this range. Blue-sequence E/S0s increase in numbers down to , then level off at 5–7% of all E/S0s from to , and finally spike up to 20–30% of all E/S0s below . Our samples do not probe below , and statistical analysis of demographics and environments is limited to .
-
•
The bimodality mass and the threshold mass have been previously linked with strong shifts in star formation history and gas richness by Kauffmann et al. (2003) and Kannappan (2004), respectively (see also Kannappan & Wei 2008). However, our definition of corrects an erroneous association of with made by Kannappan (2004), caused by assuming agreement between the stellar mass zero points used by Kauffmann et al. (2003) and Bell et al. (2003). The stellar mass zero point used in the present work agrees in normalization with Kauffmann et al. (2003) and Kannappan & Gawiser (2007).
-
•
Morphologies and numbers of blue-sequence E/S0s with masses near are consistent with merger remnants that will fade up to the red sequence (“quenching mergers”).
-
•
Blue-sequence E/S0s below have fairly settled morphologies and numbers in the population exceeding the rate of close pairs, suggesting disk (re)building may be common. Most are S0s (including S0/as), and all of the Es have some type of disk.
-
•
Below , we measure abruptly lower density environments for both red- and blue-sequence E/S0s in our data sets, often even lower than for many late-type galaxies. While these data are incomplete, we conclude that the E/S0s in our analysis represent a distinct population from dEs, which would be found primarily in a lower mass range in cluster environments.
-
•
Blue-sequence E/S0s are intermediate between red-sequence E/S0s and spirals in - and -radius scaling relations, but are more similar to red-sequence E/S0s, validating their morphological classification. Given that most sub- E/S0s in our samples reside in modest density environments, their compact structure is most naturally explained by past merging. We note the emergence of a shifted -radius relation below .
-
•
Direct evidence for disk-building in blue-sequence E/S0s includes blue outer disk colors and a high frequency of kinematically distinct (polar or counterrotating) secondary stellar disks. Statistically, the strongest color difference between red- and blue-sequence E/S0s is in outer disk color.
-
•
Based on current gas content and specific star formation rates, the growth potential of blue-sequence E/S0s is comparable to that of late-type galaxies below . Moreover, several lines of evidence suggest that star formation in blue-sequence E/S0s is intermittent, involving both minor and significant starbursts. We also find evidence that gas and stellar disk growth may be partly decoupled.
-
•
Pseudobulges may form in tandem with extended disks in many blue-sequence E/S0s. All sub- blue-sequence E/S0s in the NFGS have modest central velocity dispersions, and about half show evidence of minor disturbances and centrally enhanced star formation, suggesting gas inflow events. However, these results are preliminary given the small sample size.
-
•
Red-sequence E/S0s may also participate in disk regrowth. Below , red-sequence E/S0s show substantial diversity in radii, central velocity dispersions, gas fractions, and specific star formation rates. A subset of these systems could represent “off” states in a bursty cycle of disk regrowth.
-
•
A significant fraction of blue-sequence E/S0s seem to occupy a “sweet spot” in parameter space, with masses and environments in a regime characterized by abundant gas, combined with concentration indices near the value identified by Kauffmann et al. (2006) as optimal for peak star formation efficiency. This raises the intriguing possibility that the processes that form blue-sequence E/S0s actually enable galaxies to build large spiral disks and escape from the dwarf irregular regime. Based on downsizing considerations, we conjecture that some fraction of spirals above may have grown from analogous blue-sequence E/S0s more massive than those seen today.
Several areas remain for future work. Spatially resolved analysis of gas reservoirs, star formation, and star formation histories is underway to quantify disk and bulge growth in both red- and blue-sequence E/S0s. This analysis will assess E/S0 evolutionary trajectories and examine the ratio of fading-merger vs. disk-building systems as a function of mass. Evaluating the spiral-galaxy progenitor scenario will require comparative analysis of high-redshift blue-sequence E/S0s and presumed spiral descendents today. A much more extensive analysis of the internal dynamics of today’s E/S0s with masses below is also essential to establish the plausibility of their building dominant dynamically cold components, i.e., pseudobulges and spiral disks. If this picture proves correct, then blue-sequence E/S0s may represent the first direct evidence for a substantial and well-defined class of merger-formed galaxies caught in the act of rebuilding disks, as predicted by hierarchical models of galaxy formation.
References
- Adelman-McCarthy et al. (2006) Adelman-McCarthy, J. K., et al. 2006, ApJS, 162, 38
- Annibali et al. (2007) Annibali, F., Bressan, A., Rampazzo, R., Zeilinger, W. W., & Danese, L. 2007, A&A, 463, 455
- Baldry et al. (2004) Baldry, I. K., Glazebrook, K., Brinkmann, J., Ivezić, Ž., Lupton, R. H., Nichol, R. C., & Szalay, A. S. 2004, ApJ, 600, 681
- Bamford et al. (2009) Bamford, S. P., et al. 2009, MNRAS, 393, 1324
- Barnes (2002) Barnes, J. E. 2002, MNRAS, 333, 481
- Barth (2007) Barth, A. J. 2007, AJ, 133, 1085
- Barton et al. (2000) Barton, E. J., Kannappan, S. J., Kurtz, M. J., & Geller, M. J. 2000, PASP, 112, 367
- Barton & van Zee (2001) Barton, E. J. & van Zee, L. 2001, ApJ, 550, L35
- Barton et al. (2006) Barton, E. J., van Zee, L., & Bershady, M. A. 2006, ApJ, 649, 129
- Barway et al. (2007) Barway, S., Kembhavi, A., Wadadekar, Y., Ravikumar, C. D., & Mayya, Y. D. 2007, ApJ, 661, L37
- Bell et al. (2003) Bell, E. F., McIntosh, D. H., Katz, N., & Weinberg, M. D. 2003, ApJS, 149, 289
- Bell et al. (2004) Bell, E. F., et al. 2004, ApJ, 608, 752
- Bender et al. (1992) Bender, R., Burstein, D., & Faber, S. M. 1992, ApJ, 399, 462
- Bertola et al. (1992) Bertola, F., Buson, L. M., & Zeilinger, W. W. 1992, ApJ, 401, L79
- Bettoni et al. (2001) Bettoni, D., Galletta, G., García-Burillo, S., & Rodríguez-Franco, A. 2001, A&A, 374, 421
- Binggeli et al. (1988) Binggeli, B., Sandage, A., & Tammann, G. A. 1988, ARA&A, 26, 509
- Birnboim & Dekel (2003) Birnboim, Y. & Dekel, A. 2003, MNRAS, 345, 349
- Blanton et al. (2005) Blanton, M. R., et al. 2005, AJ, 129, 2562
- Bruzual & Charlot (2003) Bruzual, G. & Charlot, S. 2003, MNRAS, 344, 1000
- Bundy et al. (2005) Bundy, K., Ellis, R. S., & Conselice, C. J. 2005, ApJ, 625, 621
- Burstein et al. (1997) Burstein, D., Bender, R., Faber, S., & Nolthenius, R. 1997, AJ, 114, 1365
- Cattaneo et al. (2006) Cattaneo, A., Dekel, A., Devriendt, J., Guiderdoni, B., & Blaizot, J. 2006, MNRAS, 370, 1651
- Cimatti et al. (2006) Cimatti, A., Daddi, E., & Renzini, A. 2006, A&A, 453, L29
- Cirasuolo et al. (2007) Cirasuolo, M., et al. 2007, MNRAS, 380, 585
- Cowie et al. (1996) Cowie, L. L., Songaila, A., Hu, E. M., & Cohen, J. G. 1996, AJ, 112, 839
- Cox et al. (2001) Cox, A. L., Sparke, L. S., Watson, A. M., & van Moorsel, G. 2001, AJ, 121, 692
- Cross et al. (2004) Cross, N. J. G., et al. 2004, AJ, 128, 1990
- Dalcanton (2007) Dalcanton, J. J. 2007, ApJ, 658, 941
- Dalcanton et al. (2004) Dalcanton, J. J., Yoachim, P., & Bernstein, R. A. 2004, ApJ, 608, 189
- Dasyra et al. (2006) Dasyra, K. M., et al. 2006, ApJ, 651, 835
- Davies et al. (1983) Davies, R. L., Efstathiou, G., Fall, S. M., Illingworth, G., & Schechter, P. L. 1983, ApJ, 266, 41
- de la Fuente Marcos & de la Fuente Marcos (2004) de la Fuente Marcos, R. & de la Fuente Marcos, C. 2004, New Astronomy, 9, 475
- De Propris et al. (2007) De Propris, R., Conselice, C. J., Liske, J., Driver, S. P., Patton, D. R., Graham, A. W., & Allen, P. D. 2007, ApJ, 666, 212
- Dekel & Birnboim (2006) Dekel, A. & Birnboim, Y. 2006, MNRAS, 368, 2
- Domingue et al. (2009) Domingue, D. L., Xu, C. K., Jarrett, T. H., & Cheng, Y. 2009, ArXiv e-prints
- Donas et al. (2007) Donas, J., et al. 2007, ApJS, 173, 597
- Driver et al. (2006) Driver, S. P., et al. 2006, MNRAS, 368, 414
- Elmegreen & Scalo (2006) Elmegreen, B. G. & Scalo, J. 2006, ApJ, 636, 149
- Elmegreen et al. (2005) Elmegreen, D. M., Elmegreen, B. G., & Ferguson, T. E. 2005, ApJ, 623, L71
- Erwin et al. (2005) Erwin, P., Beckman, J. E., & Pohlen, M. 2005, ApJ, 626, L81
- Erwin et al. (2003) Erwin, P., Beltrán, J. C. V., Graham, A. W., & Beckman, J. E. 2003, ApJ, 597, 929
- Faber et al. (2007) Faber, S. M., et al. 2007, ApJ, 665, 265
- Falco et al. (1999) Falco, E. E., et al. 1999, PASP, 111, 438
- Franceschini et al. (2006) Franceschini, A., et al. 2006, A&A, 453, 397
- Gallazzi et al. (2006) Gallazzi, A., Charlot, S., Brinchmann, J., & White, S. D. M. 2006, MNRAS, 370, 1106
- Governato et al. (2007) Governato, F., Willman, B., Mayer, L., Brooks, A., Stinson, G., Valenzuela, O., Wadsley, J., & Quinn, T. 2007, MNRAS, 374, 1479
- Grogin & Geller (1998) Grogin, N. A. & Geller, M. J. 1998, ApJ, 505, 506
- Guie et al. (2005) Guie, J. M., Kannappan, S. J., Balog, Z., & Berlind, P. 2005, in Revista Mexicana de Astronomia y Astrofisica Conference Series, ed. S. Torres-Peimbert & G. MacAlpine, 111–112
- Hammer et al. (2005) Hammer, F., Flores, H., Elbaz, D., Zheng, X. Z., Liang, Y. C., & Cesarsky, C. 2005, A&A, 430, 115
- Hammer et al. (2007) Hammer, F., Puech, M., Chemin, L., Flores, H., & Lehnert, M. D. 2007, ApJ, 662, 322
- Hau et al. (2008) Hau, G. K. T., Bower, R. G., Kilborn, V., Forbes, D. A., Balogh, M. L., & Oosterloo, T. 2008, MNRAS, 385, 1965
- Hawarden et al. (1981) Hawarden, T. G., Longmore, A. J., Goss, W. M., Mebold, U., & Tritton, S. B. 1981, MNRAS, 196, 175
- Helmi et al. (2006) Helmi, A., Navarro, J. F., Nordström, B., Holmberg, J., Abadi, M. G., & Steinmetz, M. 2006, MNRAS, 365, 1309
- Hogg et al. (2003) Hogg, D. W., et al. 2003, ApJ, 585, L5
- Hopkins et al. (2009) Hopkins, P. F., Cox, T. J., Younger, J. D., & Hernquist, L. 2009, ApJ, 691, 1168
- Huchra et al. (1983) Huchra, J., Davis, M., Latham, D., & Tonry, J. 1983, ApJS, 52, 89
- Ibata et al. (2005) Ibata, R., Chapman, S., Ferguson, A. M. N., Lewis, G., Irwin, M., & Tanvir, N. 2005, ApJ, 634, 287
- Im et al. (2001) Im, M., Faber, S. M., Gebhardt, K., Koo, D. C., Phillips, A. C., Schiavon, R. P., Simard, L., & Willmer, C. N. A. 2001, AJ, 122, 750
- Iodice et al. (2006) Iodice, E., et al. 2006, ApJ, 643, 200
- James et al. (2008) James, P. A., O’Neill, J., & Shane, N. S. 2008, A&A, 486, 131
- Jansen et al. (2000a) Jansen, R. A., Fabricant, D., Franx, M., & Caldwell, N. 2000a, ApJS, 126, 331
- Jansen et al. (2000b) Jansen, R. A., Franx, M., Fabricant, D., & Caldwell, N. 2000b, ApJS, 126, 271
- Jarrett et al. (2000) Jarrett, T. H., Chester, T., Cutri, R., Schneider, S., Skrutskie, M., & Huchra, J. P. 2000, AJ, 119, 2498
- Jeong et al. (2007) Jeong, H., Bureau, M., Yi, S. K., Krajnović, D., & Davies, R. L. 2007, MNRAS, 376, 1021
- Juneau et al. (2005) Juneau, S., et al. 2005, ApJ, 619, L135
- Kannappan (2004) Kannappan, S. J. 2004, ApJ, 611, L89
- Kannappan & Barton (2004) Kannappan, S. J. & Barton, E. J. 2004, AJ, 127, 2694
- Kannappan & Fabricant (2001) Kannappan, S. J. & Fabricant, D. G. 2001, AJ, 121, 140
- Kannappan et al. (2002) Kannappan, S. J., Fabricant, D. G., & Franx, M. 2002, AJ, 123, 2358
- Kannappan et al. (2009) Kannappan, S. J., et al. 2009, in preparation
- Kannappan & Gawiser (2007) Kannappan, S. J. & Gawiser, E. 2007, ApJ, 657, L5
- Kannappan et al. (2004) Kannappan, S. J., Jansen, R. A., & Barton, E. J. 2004, AJ, 127, 1371
- Kannappan & Wei (2008) Kannappan, S. J. & Wei, L. H. 2008, in American Institute of Physics Conference Series, Vol. 1035, The Evolution of Galaxies Through the Neutral Hydrogen Window, ed. R. Minchin & E. Momjian, 163–168
- Kauffmann et al. (2007) Kauffmann, G., et al. 2007, ApJS, 173, 357
- Kauffmann et al. (2006) Kauffmann, G., et al. 2006, MNRAS, 367, 1394
- Kauffmann et al. (2003) Kauffmann, G., et al. 2003, MNRAS, 341, 54
- Kaviraj et al. (2008) Kaviraj, S., et al. 2008, MNRAS, 388, 67
- Kaviraj et al. (2007a) Kaviraj, S., Peirani, S., Khochfar, S., Silk, J., & Kay, S. 2007a, ArXiv e-prints, 711
- Kaviraj et al. (2007b) Kaviraj, S., et al. 2007b, ApJS, 173, 619
- Kenney et al. (2004) Kenney, J. D. P., van Gorkom, J. H., & Vollmer, B. 2004, AJ, 127, 3361
- Kereš et al. (2005) Kereš, D., Katz, N., Weinberg, D. H., & Davé, R. 2005, MNRAS, 363, 2
- Kewley et al. (2002) Kewley, L. J., Geller, M. J., Jansen, R. A., & Dopita, M. A. 2002, AJ, 124, 3135
- Kobulnicky & Zaritsky (1999) Kobulnicky, H. A. & Zaritsky, D. 1999, ApJ, 511, 118
- Kodama et al. (2004) Kodama, T., et al. 2004, MNRAS, 350, 1005
- Koo et al. (1997) Koo, D. C., Guzman, R., Gallego, J., & Wirth, G. D. 1997, ApJ, 478, L49+
- Kormendy & Kennicutt (2004) Kormendy, J. & Kennicutt, Jr., R. C. 2004, ARA&A, 42, 603
- Kriek et al. (2008) Kriek, M., van der Wel, A., van Dokkum, P. G., Franx, M., & Illingworth, G. D. 2008, ApJ, 682, 896
- Kuijken et al. (1996) Kuijken, K., Fisher, D., & Merrifield, M. R. 1996, MNRAS, 283, 543
- Kurtz et al. (1992) Kurtz, M. J., Mink, D. J., Wyatt, W. F., Fabricant, D. G., Torres, G., Kriss, G. A., & Tonry, J. L. 1992, in ASP Conf. Ser. 25: Astronomical Data Analysis Software and Systems I, Vol. 1, 432
- Laurikainen et al. (2006) Laurikainen, E., Salo, H., Buta, R., Knapen, J., Speltincx, T., & Block, D. 2006, AJ, 132, 2634
- Lee et al. (2006) Lee, J. H., Lee, M. G., & Hwang, H. S. 2006, ApJ, 650, 148
- Lisker et al. (2006) Lisker, T., Glatt, K., Westera, P., & Grebel, E. K. 2006, AJ, 132, 2432
- Macciò et al. (2006) Macciò, A. V., Moore, B., & Stadel, J. 2006, ApJ, 636, L25
- Mallén-Ornelas et al. (1999) Mallén-Ornelas, G., Lilly, S. J., Crampton, D., & Schade, D. 1999, ApJ, 518, L83
- Maraston (2005) Maraston, C. 2005, MNRAS, 362, 799
- Matthews & de Grijs (2004) Matthews, L. D. & de Grijs, R. 2004, AJ, 128, 137
- McCall (2004) McCall, M. L. 2004, AJ, 128, 2144
- Menanteau et al. (2001) Menanteau, F., Abraham, R. G., & Ellis, R. S. 2001, MNRAS, 322, 1
- Menanteau et al. (2006) Menanteau, F., Ford, H. C., Motta, V., Benítez, N., Martel, A. R., Blakeslee, J. P., & Infante, L. 2006, AJ, 131, 208
- Noeske et al. (2006) Noeske, K. G., Koo, D. C., Phillips, A. C., Willmer, C. N. A., Melbourne, J., Gil de Paz, A., & Papaderos, P. 2006, ApJ, 640, L143
- Nolan et al. (2007) Nolan, L. A., Raychaudhury, S., & Kabán, A. 2007, MNRAS, 375, 381
- Noordermeer et al. (2005) Noordermeer, E., van der Hulst, J. M., Sancisi, R., Swaters, R. A., & van Albada, T. S. 2005, A&A, 442, 137
- O’Donnell (1994) O’Donnell, J. E. 1994, ApJ, 422, 158
- Oosterloo et al. (2007) Oosterloo, T. A., Morganti, R., Sadler, E. M., van der Hulst, T., & Serra, P. 2007, A&A, 465, 787
- Paturel et al. (2003a) Paturel, G., Petit, C., Prugniel, P., Theureau, G., Rousseau, J., Brouty, M., Dubois, P., & Cambrésy, L. 2003a, A&A, 412, 45
- Paturel et al. (2003b) Paturel, G., Theureau, G., Bottinelli, L., Gouguenheim, L., Coudreau-Durand, N., Hallet, N., & Petit, C. 2003b, A&A, 412, 57
- Puech et al. (2006) Puech, M., Hammer, F., Flores, H., Östlin, G., & Marquart, T. 2006, A&A, 455, 119
- Robertson et al. (2006) Robertson, B., Bullock, J. S., Cox, T. J., Di Matteo, T., Hernquist, L., Springel, V., & Yoshida, N. 2006, ApJ, 645, 986
- Rocha-Pinto et al. (2000) Rocha-Pinto, H. J., Scalo, J., Maciel, W. J., & Flynn, C. 2000, ApJ, 531, L115
- Rose et al. (2001) Rose, J. A., Gaba, A. E., Caldwell, N., & Chaboyer, B. 2001, AJ, 121, 793
- Sage & Welch (2006) Sage, L. J. & Welch, G. A. 2006, ApJ, 644, 850
- Salpeter (1955) Salpeter, E. E. 1955, ApJ, 121, 161
- Sancisi et al. (2008) Sancisi, R., Fraternali, F., Oosterloo, T., & van der Hulst, T. 2008, A&A Rev., 15, 189
- Sargent et al. (2007) Sargent, M. T., et al. 2007, ApJS, 172, 434
- Schawinski et al. (2007) Schawinski, K., et al. 2007, ApJS, 173, 512
- Schlegel et al. (1998) Schlegel, D. J., Finkbeiner, D. P., & Davis, M. 1998, ApJ, 500, 525
- Serra et al. (2008) Serra, P., Trager, S. C., Oosterloo, T. A., & Morganti, R. 2008, A&A, 483, 57
- Sprayberry et al. (1995) Sprayberry, D., Impey, C. D., Bothun, G. D., & Irwin, M. J. 1995, AJ, 109, 558
- Springel et al. (2005) Springel, V., Di Matteo, T., & Hernquist, L. 2005, ApJ, 620, L79
- Steinmetz & Navarro (2002) Steinmetz, M. & Navarro, J. F. 2002, New Astronomy, 7, 155
- Stewart et al. (2009) Stewart, K. R., Bullock, J. S., Wechsler, R. H., & Maller, A. H. 2009, ArXiv e-prints
- Strateva et al. (2001) Strateva, I., et al. 2001, AJ, 122, 1861
- Trentham et al. (2005) Trentham, N., Sampson, L., & Banerji, M. 2005, MNRAS, 357, 783
- Tresse et al. (2007) Tresse, L., et al. 2007, A&A, 472, 403
- Treu et al. (2005) Treu, T., et al. 2005, ApJ, 633, 174
- Tully et al. (1998) Tully, R. B., Pierce, M. J., Huang, J., Saunders, W., Verheijen, M. A. W., & Witchalls, P. L. 1998, AJ, 115, 2264
- Vader & Vigroux (1991) Vader, J. P. & Vigroux, L. 1991, A&A, 246, 32
- van den Bergh (1976) van den Bergh, S. 1976, ApJ, 206, 883
- van Driel & van Woerden (1991) van Driel, W. & van Woerden, H. 1991, A&A, 243, 71
- van Gorkom et al. (1987) van Gorkom, J. H., Schechter, P. L., & Kristian, J. 1987, ApJ, 314, 457