The multicomponent model of the Crab Pulsar
at energies above 25 GeV
We review a proposed multicomponent model to explain the features of the pulsed emission and spectrum of the Crab Pulsar, on the light of the recent detection of pulsed emission above 25 GeV from the MAGIC atmospheric Čerenkov telescope. This model explains the evolution of the pulse shape and of the phase-resolved spectra, ranging from the optical/UV to the GeV energy band, on the assumption that the observed emission is due to several components, which have spectra modelled as log-parabolic laws. We show that the new MAGIC data are well consistent with the prevision of our model.
Key Words.:
stars: pulsars: general – stars: pulsars: individual: (PSR B0531+21) – X-rays: stars – gamma rays: observationsRiccardo Campana: riccardo.campana@uniroma1.it
1 Introduction
Phase resolved energy distributions of pulsars’ signals are important to obtain information on the radiation processes and geometry of the emission regions in the magnetosphere. At -ray energies, at variance with other energy bands, the three brightest sources (Vela, Crab and Geminga) show remarkably similar pulse structures with two main peaks at a large phase separation ranging from 0.4 to 0.5. This pattern is confirmed by the very recent discovery of pulsed emission from PSR J2021+3651 (Halpern et al. 2008), that has a peak separation of 0.47. The double peak structure of the Crab Pulsar (PSR B0531+21) is well observed across the entire electromagnetic spectrum, but the intensity ratio between the two peaks changes with energy. In particular, in the X and soft -ray ranges the emission of the second peak (P2) becomes higher than the first one (P1), and a relevant emission from the region between the two peaks (interpeak or bridge, Ip) increases like P2. This behaviour is observed up to a few MeV, where the pulse shape turns almost sharply to be similar, although not equal, to the optical light curve.
On the basis of a large collection of data, covering the frequency interval from the optical to the GeV band, we proposed a model (Massaro et al. 2006a, hereafter MCCM) able to describe the spectral and phase distributions by means of a double two-component model. The energy spectra of these components are not described by a simple power law, because of the continuous spectral steepening towards high energies. We found that a very satisfactory model is a parabolic law in a double-logarithmic plot, corresponding to a log-normal spectral distribution.
A useful test to verify the goodness of this multicomponent model, and in particular the existence of the two high energy components, is the study of the pulse shape at energies higher than a few GeV, where P2 is expected to be again the dominant feature as in hard X/soft rays. Some hints in this direction are given by the EGRET pulse profile (Thompson 2004), but statistics above 5 GeV are so poor that no firm conclusion can be obtained. Very recently, the MAGIC telescope (e.g. Lorenz 2004) has detected pulsed emission from the Crab (Aliu et al. 2008), at energies above 25 GeV and with 6.4 standard deviations significance, showing the very well established two peak profile, with similar amplitudes of the two peaks.
In this Note we compare the MAGIC data to the predictions of the MCCM model, and use them to constrain the high energy components. The model is synthetically described in Sect. 2, the extension to MAGIC results is presented in Sect. 3 and some hypotheses about the origin of these components on the basis of some recent works on the high energy emission from young pulsars are discussed in Sect. 4.
2 The multicomponent model of Crab pulsar
2.1 The two-component model: optical to hard X-rays
As early presented in Massaro et al. (2000), the spectral and phase changes of Crab X-ray pulse shape are well reproduced by two components. The first component, called , is assumed to have the same pulsed profile observed at optical frequencies, while the second component, , is described by an analytical model to reproduce the observed pulse profiles. The latter component dominates at the interpeak (Ip) and second peak (P2) phase regions. This choice can be justified also from theorical models like that proposed by Eastlund et al. (1997), who considered the synchrotron emission from marginally clamped electrons in a shell at the boundary of the closed magnetosphere and calculated pulse profile very similar to .
By means of spectral fits of BeppoSAX data, we obtained that the and components were described by a log-parabolic spectral law,
| (1) |
where is the energy in keV, is the photon flux at 1 keV and the parameter describes the “curvature” of the log-parabola. Best fit estimate of the parameters allowed to derive the peak energies of the spectral energy distributions (SED), , that were found at 12 keV and 178 keV for and , respectively, and was found the same for both components and equal to 0.16.
2.2 The model at -ray energies
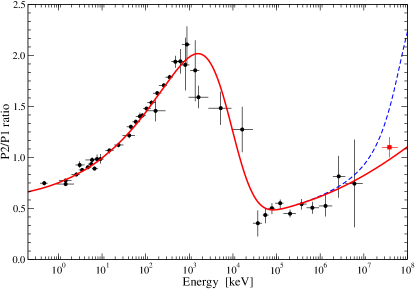
Observations performed by the COMPTEL and EGRET experiments onboard the Compton Gamma Ray Observatory (CGRO; Kuiper et al. 2001; Thompson 2004) provided light curves above 10 MeV of a good statistical quality, which show that the pulse shape returns to be similar to that of , i.e. the optical/soft X-ray one, although some minor differences are present, for instance in the shape of P2. At energies higher than 500 MeV there is some indication that the emission from Ip and P2 appears to increase, in analogy with the X-ray band. Left panel of Figure 1 shows the energy evolution of the P2/P1 flux ratio, computed in the phase intervals defined by Kuiper et al. (2001) that are reported in the caption.
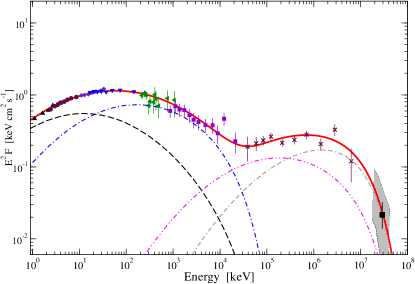
To model the -ray emission and the change of the pulse shape, MCCM assumed that there are two more, high-energy spectral components, and , with the same pulse shape of the corresponding lower-energy components and with spectral distributions also given by Eq. (1). This extended model has six new parameters, i.e. the peak energies, curvatures and normalizations of the and components, that should be determined by data fitting. Given the statistical quality of CGRO data, the resulting estimates are much more uncertain than in the X-rays. Therefore, we assumed that the curvature parameters were equal to the and ones (), and adjusted the normalizations and peak energies to reproduce the observed total (phase-averaged) spectrum. Peak energies of and were found to lie around 300 MeV and 2 GeV, respectively. To be consistent with the upper limits to the TeV pulsed emission (e.g. Lessard et al. 2000) we added also an exponential cutoff to both and , at the energy GeV. This value was not compelled by observational or physical reasons, but was simply a guess to take into account the upper limits. The MCCM model was then able to reproduce both the broadband energy spectrum of the total pulse (Figure 1, right panel), and the spectra of the P1, Ip and P2 phase intervals. In the left panel of Figure 1 we plotted also the fitted and extrapolated P2/P1 ratio for two values of the cut-off energy, i.e. 11 and 15 GeV. This ratio depends on the normalizations and shapes of the and components in the proper phase ranges, and this is not immediately apparent in the phase averaged spectrum of Figure 1 (see MCCM for details).
3 The pulse shape and spectrum in the GeV band
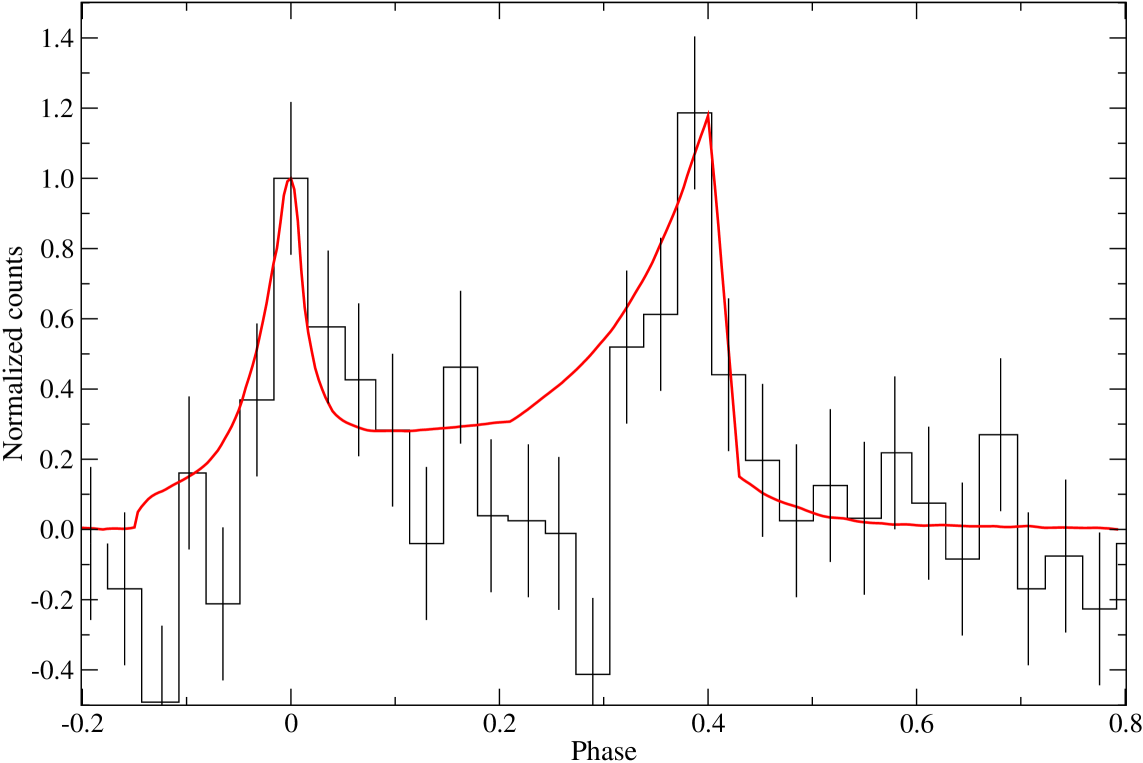
The pulse shape observed above 25 GeV by the MAGIC telescope (Aliu et al. 2008) is shown in Figure 2, where it is normalized to the counts of the first peak. Despite the statistical quality of data, is well apparent that P2 has an amplitude comparable and possibly higher than P1, in agreement with the trend barely apparent from the EGRET data (Thompson 2004).
In Figure 2 it is also plotted the pulse shape obtained from our model, with the same parameters’ values used in MCCM, for an energy of 25 GeV. The cut-off energy (15 GeV) is the same for both the and components. The amplitude of the peaks is very well reconstructed; the pulse shape in the MAGIC band predicted by our model has small variations with energy, with the height of P2 that varies by about 15% between 25 and 60 GeV.
The spectral distribution in the MAGIC range is still poorly determined, mainly because of the uncertainties in its energy scale. Aliu et al. (2008) combined the very high energy MAGIC data with the COMPTEL and EGRET points and evaluated that a possibile exponential cut-off can be at GeV, thus compatible to the value assumed in the MCCM model. However, the CGRO-MAGIC data are compatible with both an exponential or a super-exponential shape, with a preference for the former. We reported the flux estimate in our SED model (Figure 1, right panel) and found that it is in a substantial agreement with the extrapolation which was introduced to take properly into account the EGRET data. Finally, note that in the MCCM model the flux above 10 GeV is mainly due to the component (Figure 2). This is not in contrast with the evidence of P1 in the pulse profile, because its flux is concentrated in a quite narrow phase interval, and has however a wide pedestal extending below P1 (Figure 2).
The good matching of the predicted pulse shape with the MAGIC one implies that the cut-off energy should be similar for and , because a lower cut-off for would imply an higher P2/P1 ratio (as shown in Fig. 1) and therefore a higher amplitude for the second peak.
One of the assumptions of the MCCM model was that the phase distributions of the various components do not change with the energy. It was essentially motivated by the need to have a low number of parameters and supported by the satisfactory agreement of the computed pulse profiles with data. However, in Massaro et al. (2000) it was already shown that the introduction of a mild energy dependence of two parameters of the analytical description of would improve the pulse profile modelling, particularly in the Ip region. Our extrapolation at 25 GeV predicts a higher Ip than that given by the MAGIC data, especially in the leading wing of P2. We expect a number of detected events in the Ip phase interval, in excess to the off-pulse level, around 2600, whereas the measured excess is 900 counts, but still compatible with the off-pulse emission, due to the large uncertainty. Note that the S/N ratio does not allow to reach any firm conclusion: there is, for example, a dip at phase (another one is at phase ), well below the mean off-pulse level, that reduces the Ip content. The assumption that the shape of is equal to that of could not be exactly verified at such different energies. They could be different, with a shallower profile for the high-energy counterpart, as already suggested in MCCM upon considering the Ip spectrum.
4 Discussion
On the basis of a large collection of data, from the optical band to -ray energies, we developed a model (MCCM) that describes with a good accuracy the spectral and phase distributions. This model has essentially an heuristic value, being aimed to establish a consistent scenario for the development of a realistic physical model. The recent detection of the pulsed emission from Crab at energies above 25 GeV by the MAGIC collaboration is a relevant result that completes our knowledge on the spectral properties of this important source. We have shown here that these results are in a good agreement with the expectations from the MCCM model and confirm its validity.
It would be interesting to investigate theoretically the physical plausibility for the presence of two couples of emission components producing the observed spectra and phase distributions. A possibility to be further developed arise from the similar curvature parameter for the X-ray and -ray components, that suggests a synchrotron-self-Compton (SSC) mechanism for the emission (Morini 1983, Cheng & Wei 1995). A stream of relativistic electrons moving along the magnetic field lines would undergo a Compton upscattering on the synchrotron photon field. A different location and azimuthal distribution in the magnetosphere would explain the different pulse shape for the and components. An alternative hypothesis is that the -ray components are photons emitted by primary electrons via the curvature radiation mechanism, and the softer ones are the synchrotron emission from secondary pairs. However, in this case one would expect a more pronounced curvature of the log-parabolic spectra for the latter components. In fact, if the electron spectrum is a log-parabola with a curvature parameter , in the -approximation the synchrotron curvature would be equal to (Massaro et al., 2006b), while for curvature radiation this parameter would be , because of the dependence on the electrons’ Lorentz factor as instead of for the synchrotron process. About the log-parabolic (or log-normal) energy distribution of electrons, we recall that it can originate by stochastic acceleration processes or when the acceleration probability is energy-dependent.
Several models have been proposed to explain the high-energy emission from pulsars, both in the outer gap (Cheng et al., 1986, 2000) and in the polar/slot gap (Muslimov & Harding 2003, 2004) frameworks. A common feature of these models is that the broadband emission comes from components originating from different physical processes.
Takata & Chang (2007) developed a 3D outer gap model based on the 2D analytical solution of the accelerating field and particle motion by Takata et al. (2004, 2006) and Hirotani (2006). In this model the X-ray emission of P1 is due to two separate components, with curved, roughly log-parabolic, spectra and originating by synchrotron emission of secondary pairs in different regions of the outer gap, i.e. below and beyond the null-charge surface. Their explanation of the -ray spectrum invokes other two components due to Inverse Compton scattering of secondary pairs and curvature radiation from primary electrons. Their modelling of P2 and Ip, unlike the MCCM model, has different weights for these two components. The increase of P2 and Ip with respect to P1 in this model is due to the fact that the emission comes from regions in the lower magnetosphere, where the high magnetic field produces harder spectra.
More recently, Harding et al. (2008) performed a 3D simulation of the emission from the Crab pulsar, assuming a Slot Gap accelerator, in which the emission is due to two distribution of particles, primary electrons and electron-positron pairs. The X-ray emission is due to the synchrotron radiation from the pairs, while the -rays are curvature radiation and the synchrotron radiation resulting from the resonant cyclotron absorption of radio beam photons by the primary particles.
Future observations, in particular with the Fermi Gamma-ray Space Telescope, will be very useful to confirm the spectral cut-off observed by MAGIC, to improve the estimate of , and to bridge the gap between the 100–500 MeV EGRET lightcurves and the 25 GeV MAGIC one. It will be possible to follow in detail the evolution of the P2/P1 flux ratio and to verify with a much higher statistics whether the Ip emission is actually related to that of P2.
Another future interesting test will come from phase-resolved X-ray polarimetry, where MCCM expect that the hard X-rays polarization properties of P2 should become increasingly similar to those of Ip, because of the higher contribution of the component.
References
- (1) Aliu, E., Anderhub, H., Antonelli, L. A. et al. (The MAGIC Collaboration), 2008, Science, 322, 1221 [arXiv:0809.2998]
- (2) Cheng, K. S., Ho, C., Ruderman M. 1986, ApJ, 300, 500
- (3) Cheng, K. S., Wei, D. M. 1995, ApJ, 448, 281
- (4) Cheng, K. S., Ruderman, M., Zhang, L. 2000, ApJ, 537, 964
- (5) Eastlund, B. J., Miller, B., Curtis Michel, F. 1997, ApJ, 483, 857
- (6) Halpern, J. P., Camilo, F., Giuliani, A. et al., 2008, ApJ, in press [arXiv:0810.0008]
- (7) Harding, A. K., Stern, J. V., Dyks, J., Frackowiak, M. 2008, ApJ, 680, 1378
- (8) Hirotani, K. 2006, ApJ, 652, 1475
- (9) Kuiper, L., Hermsen, W., Cusumano, G. et al. 2001, A&A, 378, 918
- (10) Lessard, R. W., Bond, I. H., Bradbury, S. M. et al. 2000, ApJ, 531, 942
- (11) Lorenz, E. 2004, New Astron. Rev., 48, 339
- (12) Massaro, E., Cusumano, G., Litterio, M., Mineo, T. 2000, A&A, 361, 695
- (13) Massaro, E., Campana, R., Cusumano, G., Mineo, T. 2006a, A&A, 459, 859
- (14) Massaro, E., Tramacere, A., Perri, M., Giommi, P., Tosti, G. 2006b, A&A, 448, 861
- (15) Morini, M. 1983, MNRAS, 202, 495
- (16) Muslimov, A. G., Harding, A. K. 2003, ApJ, 588, 430
- (17) Muslimov, A. G., Harding, A. K. 2004, ApJ, 606, 1143
- (18) Takata, J., Shibata, S., Hirotani, K. 2004, MNRAS, 354, 1120
- (19) Takata, J., Shibata, S., Hirotani, K., Chang, H. K. 2006, MNRAS, 366, 1310
- (20) Takata, J. & Chang, H. K. 2007, ApJ, 670, 677
- (21) Thompson, D. J. 2004, Proc. Cosmic Gamma-ray Sources, K. S. Cheng & G. E. Romero eds., ASSL, Kluwer Acad Publ., vol 304, p. 149 [astro-ph/0312272]