How the hydrogen bond in NH4F is revealed with Compton scattering
Abstract
In order to probe electron wave functions involved in the bonding of NH4F, we have performed Compton scattering experiments in an oriented single crystal and in a powder. Ab initio calculations of the Compton profiles for NH4F and NH4Cl are used to enlighten the nature of the bonds in the NH4F crystal. As a consequence, we are able to show significant charge transfer in the ammonium ion which is not observable using other methods. Our study provides a compelling proof for hydrogen bond formation in NH4F.
pacs:
78.70.Ck, 71.15.-m, 61.05.cfThe distinction between ionic and hydrogen bonding is not always clear hughes . Ammonium salts, in general are similar to the potassium and rubidium salts in crystal form and in other physical properties pauling and thus are clearly ionic in nature. This similarity is due to the size of the ammonium ion, NH, which is almost equal to the size of K+ and Rb+ ions. Remarkably, NH4F, instead of having a CsCl or NaCl structure like other ammonium salts which are ionic in nature, is isostructural to ice Ih with NH and F- ions alternating in the oxygen positions. Besides, ammonium fluoride and ice can form mixed crystals nature54 . The fact that ammonium fluoride deviates from the standard isomorphism and prefers to adopt the ice structure is ascribed to the presence of significant hydrogen bonding in this compound mair ; brown .
While ice has been the subject of many studies, NH4F has not been as widely studied. The crystal structure has been determined by Adrian and Feil adrian , the electrostatic properties have been studied by van Beek et al. beek , Ab initio calculations have been carried out by Alavi et al. alavi and by van Reeuwijk et al. van . Given the ionic nature of ammonium salts, it is tempting to consider the force between the NH and F- ions to be essentially an electrostatic interaction. Nevertheless, charge density distribution does not provide a good criterion for establishing the existence of hydrogen bonds, as shown for example by Alavi et al. alavi for this compound. In this work we investigate the nature of chemical bonding in NH4F and show, using the study of electron momentum distributions, that we detect the presence of hydrogen bonding in ammonium fluoride.
Recently, Compton scattering, which is inelastic X-ray scattering at large energy and momentum transfers Compton_book ; kaplan has provided fundamental information on the quantum nature of the hydrogen bond in ice and water prl_ice ; ghanty ; romero ; ragot ; prb_bba02 ; prb_sit ; prl_nygard . The measured Compton profile (CP), represents the double integral of the ground-state total electron momentum distribution (EMD) :
| (1) |
where lies along the scattering vector of the x-rays. Our Compton scattering experiments on NH4F will show how electronic states are modified by the hydrogen bond in contast to the ionic scenario of NH4Cl.
The CPs of the crystalline , directions and the spherical average of a powder were measured at the European Synchrotron Radiation Facility in Grenoble on high energy beamline (ID15B), using the scanning Compton spectrometersuortti . The energy of incident photons was set to 29.74 keV by use of a Si(111) cylindrically bent crystal and the scattering angle was 173∘. The collected Compton spectra were energy analyzed using the Si(400) analyzer and detected by a NaI scintillator counter. The energy-dependent resolution function is deduced from the full width at half maximum (FWHM) at the thermal diffuse scattering peak which was 0.16 (a.u.) which provides at the Compton peak 0.13 a.u. of resolution. After subtracting the background, energy dependent corrections have been performed: absorption in analyzer and detector, detector efficiency, analyzer reflectivity balibar . After normalization to the number of electrons, the contribution due to multiple scattering was subtracted from the total measured profile chomilier . In order to obtain the valence electrons CPs, a quasi-self-consistent-field calculated core CP is then subtracted from the total corrected measured profile issolah .
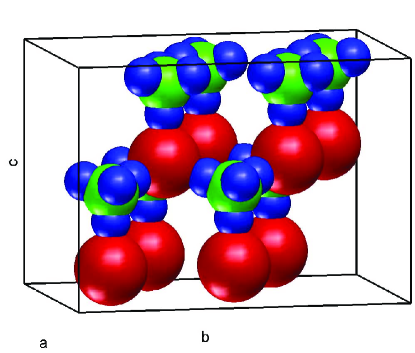
The program used for our ab initio calculations was CRYSTAL98 crystal98 , which is especially suitable for molecular crystals. We have used the hexagonal structure of the NH4F crystal at room temperature with point group P63mc, Å , Å and the experimental atomic positions beek . This crystal structure is illustrated in Fig. 1. The occupied orbitals used to determine the EMD and the CPs were calculated using a restricted Hartree-Fock scheme prb_bba02 .
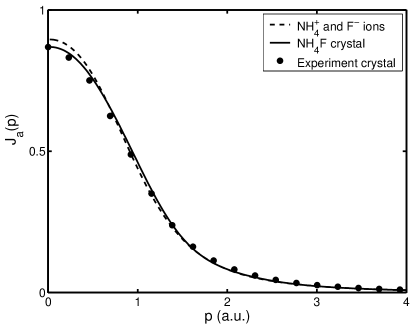
In Fig. 2, we show two computed valence CPs for NH4F (convoluted with experimental resolution and normalized to unit area) together with the experimental data along the crystallographic direction . In the first calculation, represented by a dashed line, we have built the CP as a superposition of CPs of isolated ions NH and F- arranged in the same geometry as in the crystal. In comparison with the experiment, the profile of the isolated ions is found to be higher due to the absence of bonding prb_sit . In the second calculation, represented by a solid line, the two ionic fragments can interact, and an excellent agreement between the crystal calculation and the experiment is obtained.
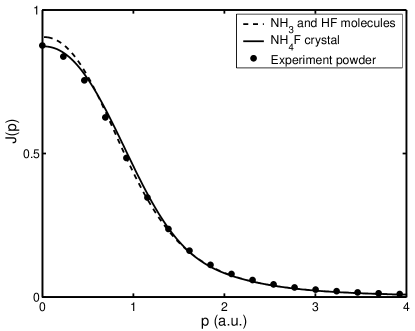
Likewise, in Fig. 3, we show that the spherical averaged CP for the NH4F crystal calculation (solid line) agrees remarkably well with the experimental CP of the powder in contrast to a calculation for two non-interacting neutral molecules NH3 and HF (dashed line). In this molecular computation, the intramolecular atomic distances are the same as the corresponding distances in the crystal. Interestingly, the spherical averaged CP for two non-interacting neutral molecules NH3 and HF turns out to be very similar to the spherical averaged CP for the isolated ions NH and F-. In reality, the main difference between the ions and the molecules cases is an exchange of a proton since the HF molecule can be formed by the capture of a proton by the F- from the ammonium ion. However, the X-ray Compton scattering has not direct access to the proton wavefunction.
In order to study bonding effects, we now discuss the CP anisotropy prl_ice , that is, the difference between measured Compton profiles along two crystalline directions. In the present case, we consider
| (2) |
where is the CP along the crystallographic direction which is also the direction along which hydrogen bonds are aligned, and is the CP along the crystallographic direction . The anisotropy has the advantage of highlighting the changes introduced by the bonding. The shape of the anisotropy is very similar to that found in ice prl_ice as shown in Fig. 4.
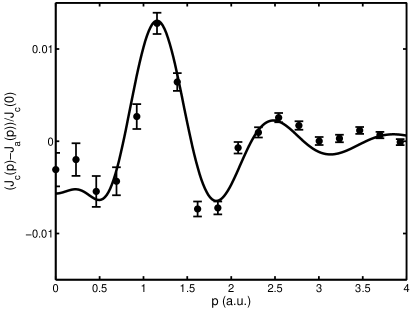
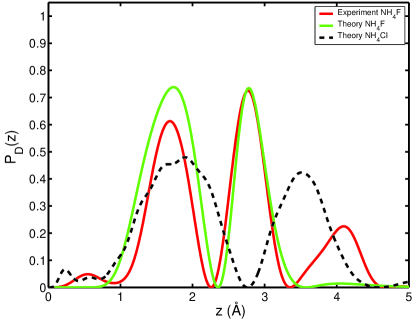
The effects produced by the hydrogen bond on the electronic wavefunctions can be extracted by studying the power density prl_ice ; PD
| (3) |
The peaks in the power density indicate characteristic distances over which wave functions are coherent in given crystallographic directions. Figure 5 shows that the experimental data and the theory are in good agreement concerning the locations of the two main peaks. Nevertheless, the long range peak at about 4 Å in the experimental anisotropy is largely reduced in the calculation. A cause of this discrepancy could be the Hartree-Fock tendency to overestimate wavefunction localization. However, the CP in momentum space is not too sensitive to this overestimation.
In a true ionic crystal the main differences from the isotropic picture occur in the region where the ionic spheres are in contact as in the hard sphere model. Thus, in the picture developed by Pattison et al. pattison one expects peaks at distance corresponding to the ionic diameters. The first main peak of should correspond to the cation diameter while the second main peak should give the anion diameter. Figure 5 also compares NH4F to the more ionic salt NH4Cl nh4cl . One can see that the second main peaks for NH4F and NH4Cl nh4cl are close to accepted values for F- and Cl- diameters (2.7 Å and 3.6 Å respectively, ionrad ). The first peak is however at a distance systematically smaller than that of the hard sphere ionic diameter of ammonium (2.8 Å) even in NH4Cl signifying that the purely ionic, hard sphere model is not adequate. Moreover, the distance corresponding to this peak is smaller for both the theoretical calculation and the experiment in NH4F than the calculation for NH4Cl though the ion is identical. As for NH4F, the interpretation becomes straightforward when the connection is made with results obtained for the hydrogen bonded ice Ih since the measured and calculated anisotropy bear a striking resemblance. In the more appropriate hydrogen bond picture the two predominant peaks of located at about 1.7 Å and 2.75 Å can be assigned to the hydrogen bond length F-H (1.67 Å) and the nearest neighbor F-N distance (2.77 Å), respectively implying the existence of coherent charge transfer as in the case of ice Ih prb_bba02 .
In conclusion, our study shows that high-resolution directional CPs of ammonium fluoride provide clear signatures of the hydrogen bond. The ionic picture is just a starting point since highly charged states such as the NH and F- are mitigated by the hydrogen bond: bonding electrons are shared in states that cannot be assigned solely to ammonium or F.
This work was supported by the US Department of Energy, Office of Science, Basic Energy Sciences contract DE-FG02-07ER46352, and benefited from the allocation of computer time at NERSC and at Northeastern University Advanced Scientific Computation Center (NU-ASCC).
References
- (1) D. E. P. Hughes, Phys. Educ. 32, 250 (1997).
- (2) Linus Pauling, General Chemistry, Dover (New York 1988).
- (3) R. Brill and S. Zaromb, Nature 173, 316 (1954).
- (4) S.L. Mair, Acta Cryst. A 34, 656 (1978).
- (5) R.J.C. Brown, J. Mol. Struct 345, 77 (1995).
- (6) H.W.W. Adrian and D. Feil, Acta Cryst A 25, 438 (1969).
- (7) C.G. van Beek, J. Overeem, J.R. Ruble, B.M. Craven, Can. J. Chem. 74, 943 (1996).
- (8) A. Alavi, R.M. Lynden-Bell and R.J.C. Brown, J. Chem. Phys. 110, 5861 (1999).
- (9) S.J. van Reeuwijk, K.G. van Beek, D. Feil, J. Phys. Chem. A 104 10901 (2000).
- (10) X-Ray Compton Scattering, eds M. Cooper, P. Mijnarends, N. Shiotani, N. Sakai and A. Bansil, Oxford University Press (New York, Oxford 2004).
- (11) I.G. Kaplan, B. Barbiellini, and A. Bansil, Phys. Rev. B 68, 235104 (2003).
- (12) E. D. Isaacs, A. Shukla, P. M. Platzman, D. R. Hamann, B. Barbiellini and C. Tulk, Phys. Rev. Lett. 82, 600 (1999).
- (13) T.K. Ghanty, V.N. Staroverov, P.R. Koren, and E.R. Davidson, J. Am. Chem. Soc. 122, 1210 (2000).
- (14) A.H. Romero, P.L. Silvestrelli, and M. Parinello, J. Chem. Phys. 115, 115 (2001).
- (15) S. Ragot, J.M. Gillet, and P.J. Becker, Phys. Rev. B 65, 235115 (2002).
- (16) B. Barbiellini and A. Shukla, Phys. Rev. B 66, 235101 (2002).
- (17) P. H.-L. Sit et al., Phys. Rev. B 76, 245413 (2007).
- (18) K. Nygård et al., Phys. Rev. Lett. 99, 197401 (2007).
- (19) P. Suortti, T. Buslaps, P. Fajardo, V. Honkimäki, M. Kretzschmer, U. Lienert, J.E. McCarthy, M. Renier, A. Shukla, Th. Tschentscher and T. Meinander, J. Synchrotron Rad. 6, 69 (1999).
- (20) F. Balibar, Y. Epelboin and C. Malgrange, Acta Cryst. A 31, 836 (1975).
- (21) J. Chomilier, G. Loupias, J. Felsteiner, Nucl. Inst. Meth. A 235, 603 (1985).
- (22) A. Issolah, B. Levy, A. Beswick, and G. Loupias, Phys. Rev. A 38, 4509 (1988); A. Issolah, Y. Garreau, B. Levy, G. Loupias, Phys. Rev. B44, 11029 (1991).
- (23) V.R. Saunders, R. Dovesi, C. Roetti, M. Causà, N.M. Harrison, R. Orlando, C.M. Zicovich-Wilson, CRYSTAL98 User’s Manual, University of Torino, Torino, (1998).
- (24) A. Alavi, R.M. Lynden-Bell, P.A. Willis, I.P. Swainson and R.J.C. Brown, Can. J. Chem. 76, 1581 (1998).
- (25) A. Shukla et al., Phys. Rev. B 59, 12127 (1999).
- (26) P. Pattison, W. Weyrich and B. Williams, Solid State Comm. 21, 967 (1977).
- (27) For the NH4Cl crystal calculations, we have used the cubic ordered phase with space group P3m and lattice parameter Å alavi_nh4cl .
- (28) Jack B. Holbrook, F. Mahnaz Khaled and Barry C. Smith, J. Chem. Soc., Dalton Trans., 1631 (1978).