Age and distance for the old open cluster NGC 188 from the eclipsing binary member V 1211affiliation: WIYN Open Cluster Study. XXXVII.
Abstract
We present time-series radial-velocity and photometric observations of a solar-type double-lined eclipsing binary star (V 12) in the old open cluster NGC 188. We use these data to determine the spectroscopic orbit and the photometric elements for V 12. From our analysis we determine accurate masses (, ) and radii (, ) for the primary (p) and secondary (s) binary components. We adopt a reddening of for NGC 188, and derive component effective temperatures of and , respectively, for the primary and secondary stars. From their absolute dimensions, the two components of V 12 yield identical distance moduli of , corresponding to pc. Both stars are near the end of their main-sequence evolutionary phase, and are located at the cluster turnoff in the color-magnitude diagram. We determine an age of Gyr for V 12 and NGC 188, from a comparison with theoretical isochrones in the mass-radius diagram. This age is independent of distance, reddening, and color-temperature transformations. We use isochrones from Victoria-Regina and Yonsei-Yale with [Fe/H] = -0.1 and [Fe/H] = 0.0. From the solar metallicity isochrones, an age of 6.4 Gyr provides the best fit to the binary components for both sets of models. For the isochrones with [Fe/H] = -0.1, ages of 6.0 Gyr and 5.9 Gyr provide the best fits for the Victoria-Regina and Yonsei-Yale models, respectively. We use the distance and age estimates for V 12, together with best estimates for the metallicity and reddening of NGC 188, to investigate the locations of the corresponding VRSS and isochrones relative to cluster members in the color-magnitude diagram. Plausible changes in model metallicity and distance to better match the isochrones to the cluster sequences, result in a range of ages for NGC 188 that is more than 3 times that resulting from our analysis of V 12.
1 Introduction
NGC 188, once thought to be the oldest open cluster in our Galaxy (e.g., Sandage, 1962), represents the old stellar population of the Galactic disk. Due to its richness, location in the Galaxy (, ; , ), large population of single and binary members (Platais et al., 2003; Geller et al., 2008), and its age, NGC 188 is a benchmark cluster for studies of stellar evolution and cluster dynamics, and for the formation and chemical and dynamical evolution of the Galactic disk. Determining an accurate and precise age for NGC 188 is of general importance.
The age determined for NGC 188 has changed dramatically since the early determination by Sandage (1962) of 14-16 Gyr. Later studies derived 9-12 Gyr (Demarque & Larson, 1964; Iben, 1967), and more recent values range from 6 Gyr (Twarog & Anthony-Twarog, 1989; Caputo et al., 1990; Demarque et al., 1992; Meynet et al., 1993; Dinescu et al., 1995) to 7-8 Gyr (Hobbs et al., 1990; Sarajedini et al., 1999; VandenBerg & Stetson, 2004). Past age estimates were based on fitting model isochrones to the cluster’s main sequence, turnoff, and giant branch in the color-magnitude diagram (CMD). Ages derived using this “isochrone method” are sensitive to uncertainties in cluster extinction and reddening, as well as in the conversions between model (bolometric luminosity, temperature) and observed (apparent luminosity, color) quantities.
For NGC 188, the values for reddening and metallicity are well constrained. A reddening of derived from the Schlegel et al. (1998) dust maps agrees with the estimates of Sarajedini et al. (1999) of from their two-color diagram. We use throughout this paper. The metallicity of NGC 188 has been studied during the last two decades (e.g. Hobbs et al., 1990; Friel & Janes, 1993; Friel et al., 2002; Randich et al., 2003; Worthey & Jowett, 2003). Results from photometric studies agree with results from medium- to high-resolution spectroscopy, both of which find the cluster’s metallicity to be in the range from to solar. Estimates of the cluster distance from isochrone-fitting to the CMD, have over the past decade agreed to within a few percent, ranging from 1660 pc to 1710 pc (Sarajedini et al., 1999; VandenBerg & Stetson, 2004; Bonatto et al., 2005; Fornal et al., 2007) with individual uncertainties of the order of .
NGC 188 is a key cluster of the WIYN111The WIYN Observatory is a joint facility of the University of Wisconsin-Madison, Indiana University, Yale University, and the National Optical Astronomy Observatories located at Kitt Peak National Observatoty, Arizona, USA. Open Cluster Study (WOCS; Mathieu, 2000). As part of WOCS, Geller et al. (2008) present a time-series radial-velocity survey of more than 1046 stars in the field of NGC 188 over a time baseline of 11 years. In combination with a deep proper-motion study of the cluster (Platais et al., 2003), the WOCS spectroscopic data have securely identified large populations of single and binary cluster members. V 12 was established as a double-lined spectroscopic binary and confirmed as a cluster member early in the WOCS survey. The eclipsing nature of the system was discovered by Zhang et al. (2002) in a time-series photometric survey for variable stars. Zhang et al. (2002) recorded only one complete eclipse and classified V 12 as an Algol-type eclipsing binary. The photometry used by Zhang et al. (2002) located V 12 at the foot of the giant branch in the NGC 188 CMD. A later photometric survey by Zhang et al. (2004) placed V 12 above the cluster turn-off in the CMD, and estimated the period of V 12 to be 2.8 days. Just recently, V 12 was identified as a detached eclipsing binary in NGC 188 by Mochejska et al. (2008). They determine a period of 2.9 days.
As a spectroscopic double-lined and eclipsing binary, precise masses and radii can be determined for the primary and secondary components of V 12. Because both components are near the turnoff mass for NGC 188, a comparison of their masses and radii to theoretical isochrones can put tight constraints on the age of the binary, and thus its parent cluster. Importantly, the determinations of the masses and radii are independent of the reddening, distance, and metallicity of the system. In addition, double-lined eclipsing binaries are excellent primary distance indicators (e.g. Guinan et al., 1998; Clausen, 2004). Therefore, the analysis of eclipsing binary stars, in particular when coupled with reliable information about the stellar chemical composition, is important to improving our understanding of the physical properties and evolution of stars. However, stellar evolution models have progressed to a level where stellar parameters must be observed with a precision of 1% or better to provide useful constraints (e.g. Andersen, 1991). For examples of detailed analysis of field binaries and the comparisons with stellar evolution models see e.g. Torres et al. (2006), López-Morales, M. & Shaw, J. S. (2007), and Clausen et al. (2008).
While bright eclipsing binaries in relatively nearby clusters have been observed for decades (Kraft & Landolt, 1959; Semeniuk, 1962; Sahade & Davila, 1963; Popova & Kraicheva, 1984; Clausen & Giménez, 1987; Giménez & Clausen, 1996), and several studies have been published recently (see e.g. Southworth et al. (2005) and Southworth & Clausen (2006) and references therein), it is only recently that fainter systems in more distant clusters have been discovered and published (e.g. Kaluzny et al., 2006; Grundahl et al., 2008).
In Section 2 we begin the analysis of the spectroscopic data on V 12. We determine the orbital elements of V 12 and give the probabilities for it being a kinematic member of NGC 188. Section 3 describes the photometric data, the light curves, and the photometric elements of the V 12 components. That leads to our determination of the physical parameters for V 12, including effective temperature, distance, and age, in Section 4. In Section 5 we examine how well the isochrones that best fit the V 12 components represent the rest of the cluster members in the NGC 188 CMD, and we compare the cluster age determined via V 12 to those determined by the isochrone method. In Section 6 we summarize our results and give our conclusions.
2 Radial velocities and spectroscopic elements of V 12
2.1 Spectroscopic Observations and Datareduction
A detailed description of the spectroscopic observations and radial-velocity measurements of stars in NGC 188 can be found in Geller et al. (2008). The spectroscopic observations of V 12 were acquired from Sep 1996 to July 2001 with the WIYN telescope and the Hydra multi-object spectrograph in a single 250Å wide echelle order centered on 5130 Å and with a resolution of . For each observation three minute exposures were combined to increase the signal-to-noise ratio of the spectrum and to filter out cosmic ray events. The CCD bias level was determined using the overscan-section of the chip and subtracted. A single domeflat exposure, adjacent in time to the science exposures, was used for the purposes of tracing and extracting the stellar spectrum, flatfield correction, and fiber throughput correction. The three consecutive science exposures were bracketed by Thorium-Argon (ThAr) comparison lamp exposures used to define the pixel-to-wavelength mapping (dispersion solution). The DOHYDRA222http://iraf.noao.edu/tutorials/dohydra/dohydra.html IRAF task was used for the reduction of the WIYN/Hydra multi-spectrum data. The signal-to-noise ratio () for the 16 spectra used for the orbital solution of V12 ranges from 15-25 per resolution element (2 pixels) of . For single lined stars with slow to moderate rotation velocities, radial velocities with a precision of (Geller et al., 2008) were derived from the spectra via cross-correlation with a high sky (solar) spectrum obtained at evening twillight.
2.2 Component Radial-Velocities and Orbital Elements
Because we seek maximum precision and accuracy for the V 12 velocities, we have used two methods to independently re-reduce the spectra and derive velocities for both components. First, we have determined radial velocities using the two-dimensional cross-correlation algorithm TODCOR (Zucker & Mazeh, 1994). For the TODCOR analysis we have used identical synthetic templates for the two binary components, since they are nearly identical; see Section 4. The templates were calculated from the Synplot/Synspec333http://nova.astro.umd.edu/Synspec43/synspec.html tool by Hubeny & Lanz for = 6000 K, log() = 4.0, [Fe/H] = 0.0, = 20.0 km s-1, and a resolution of R = 20 000, adopting an ATLAS9 model atmosphere (Kurucz, 1993). Preliminary spectroscopic elements were calculated from the measured radial velocities using the method of Lehman-Filhés implemented in the SBOP program (Etzel, 2004). The orbital period was adopted from Equation 2 (Section 3.3). The orbit was assumed to be circular based on an initial eccentricity of . Because spectral lines of the stars move in and out of the observed spectral range with orbital phase, it is necessary to apply corrections to the radial velocities derived from the TODCOR algorithm (e.g. Torres et al. (1997) and Torres & Ribas (2002)). To determine such corrections, we have constructed synthetic binary spectra from the template, adopting for each orbital phase the radial-velocity shifts defined by the preliminary elements. These synthetic spectra were then analyzed by TODCOR in the same manner as the observed V 12 spectra. The corrections (i.e. measured calculated velocities for the synthetic binary spectra), which are shown in Figure 1, are then added to the measured V 12 velocities and revised spectroscopic elements are determined from SBOP. In the case of V 12, we find that the radial-velocity corrections are quite significant, up to 3 km s-1 for both components. Including the corrections improves the fit of the theoretical orbit to the radial velocities significantly, and the effect on the absolute masses is not negligible (2% for both components). The final velocities including corrections are listed in Table 1, and the corresponding spectroscopic elements are given in Table 2. The final spectroscopic orbital solution for V 12 is shown in Figure 2. Within the errors, separate analysis of the radial velocities for the primary and secondary components, respectively, yield identical elements. Also, analysis performed with several other templates ( = 10.0 km s-1, corresponding to synchronous rotation (see Section 4.2); 200 K lower temperatures; different spectrum code (Valenti & Piskunov, 1996) and line list (Kupka et al., 1999)) produce indistinguishable results.

| HJD | Phase | ||||
|---|---|---|---|---|---|
| - 2 400 000 | |||||
| 50331.86241 | 0.72352 | 32.6 | -112.3 | 0.4 | 1.4 |
| 50559.93366 | 0.78823 | 31.4 | -112.5 | 0.3 | 0.1 |
| 50614.66644 | 0.20309 | -110.2 | 32.3 | -0.1 | 0.8 |
| 50614.91145 | 0.24076 | -112.2 | 35.1 | 0.9 | 0.5 |
| 50615.77338 | 0.37328 | -92.3 | 13.2 | -0.0 | -0.2 |
| 50615.91243 | 0.39465 | -84.6 | 5.3 | 0.4 | -0.6 |
| 50780.65039 | 0.72221 | 31.5 | -114.1 | -0.5 | -0.5 |
| 50797.99374 | 0.38866 | -86.7 | 8.4 | 0.4 | 0.3 |
| 50815.71183 | 0.11272 | -88.7 | 8.3 | -1.0 | -0.3 |
| 50920.96276 | 0.29447 | -111.0 | 30.7 | -0.7 | -1.2 |
| 50976.69696 | 0.86330 | 14.8 | -97.0 | -0.6 | -0.4 |
| 50996.77643 | 0.95041 | -17.1 | -63.5 | 0.5 | -0.6 |
| 51127.70306 | 0.07966 | -75.6 | -4.7 | -0.5 | -0.6 |
| 51128.67943 | 0.22977 | -112.7 | 35.1 | -0.1 | 1.0 |
| 51175.01367 | 0.35341 | -97.8 | 19.3 | 0.5 | -0.2 |
| 52121.94531 | 0.93896 | -11.7 | -68.5 | 0.9 | -0.5 |
| Parameter | Value |
|---|---|
| Adjusted quantities: | |
| (HJD2 400 000) | |
| (km s-1) | |
| (km s-1) | |
| (km s-1) | |
| Adopted quantities: | |
| (days) | 6.5042969 |
| 0 | |
| Derived quantities: | |
| ( km) | |
| ( km) | |
| Other quantities | |
| 16 | |
| Time span (days) | 1790 |
| (km s-1) | 0.65 |
| (km s-1) | 0.77 |

Secondly, we have applied spectral disentangling. This technique solves simultaneously for the contributions of the components to the observed composite spectra, and for the Doppler shifts in the component spectra. We have applied the method introduced by Simon & Sturm (1994) using a version of the original code revised for the Linux operating system. It assumes a constant light level outside eclipses, which is fulfilled for V 12. Dedicated IDL444http://www.ittvis.com/ProductServices/IDL.aspx programs were applied to remove cosmics ray events and other defects, and for normalization of the spectra before these analysis. Spectral disentangling is applicable because sufficient (16) WIYN spectra (S/N 15-25) are available giving good phase/velocity coverage outside eclipses. We have assumed the ephemeris given in Equation 2 (Section 3.3) and fitted for the velocity semi-amplitudes of the spectroscopic orbit for each component. We obtain = 73.0 km s-1 and = 74.7 km s-1, i.e. excellent agreement with the results given in Table 2. We have not quoted uncertainties for the semi-amplitudes since it is not clear how to calculate robust values in the disentangling analysis (Hynes & Maxted, 1998). The disentangled spectra have S/N ratios of 60 and cover 200Å.
2.3 Cluster Membership Probabilities for V 12
The center of mass radial velocity of V 12 is (Table 2). From the WOCS radial-velocity survey of NGC 188, (Geller et al., 2008) report an average cluster velocity of . The center of mass velocity of V 12 is 2.5 from the fitted cluster mean, corresponding to a radial-velocity membership probability of 50%. A 97% astrometric membership probability was determined for V 12 from the proper motion study of Platais et al. (2003).
3 Photometry of V 12
The photometric data for V 12 consist of and CCD observations obtained at the 2.56m Nordic Optical Telescope (NOT) July 2004 - April 2005, at the 1.2m Flemish Mercator Telescope April 2005, and at the 0.6m telescope at Bialkow observatory in Poland February 2005 - April 2005. At the NOT, either StanCam or ALFOSC was used; we refer the reader to the telescope homepages for further information. Table 3 gives a summary of the data obtained.
| Telescope | ||||
|---|---|---|---|---|
| NOT/StanCam | 131 | 118 | 120 | 90 |
| NOT/ALFOSC | 197 | 189 | 60 | 45 |
| Mercator | 0 | 40 | - | 180 |
| Bialkow | 51 | 36 | 300 | 200 |
At each telescope the flat fields used in the data reduction were obtained during evening twilight. All photometry was carried out with DAOPHOT/ALLSTAR (Stetson, 1987) and DAOGROW (Stetson, 1990) and transformed to a common coordinate system using MATCH and MASTER (P. Stetson, private comm.). For each frame we produced a point-spread function (PSF) using the brightest stars in the field and subsequently carried out aperture photometry in large apertures (neighbor stars subtracted) using the NEDA routine provided with DAOPHOT. Subsequently the aperture photometry was fed into DAOGROW to obtain the final large-aperture magnitudes. We found that this procedure gave slightly better photometric precision than using profile-fitting photometry.
3.1 Transformation to and
For the analysis of the light curve it is important that all data in a given band are on the same photometric system. For this purpose we used the photometry provided by Stetson et al. (2004) which gives calibrated photometry for a large fraction of the stars in NGC 188. We note that and are on the Cousins system. The stars in common with Stetson et al. (2004) were then used as local standards and the following transformation equations was adopted (for both and ):
| (1) |
Capital letters denote calibrated magnitudes and lower case refers to instrumental magnitudes. For each combination of telescope, instrument, and filter, the values of and were found by the following procedure: 1) We fitted eq. 1 to the data from each frame (excluding V 12 which is variable); 2) We calculated the average value of , as it is expected to be constant in time; 3) Using the average value for the values of were re-determined as the final frame zeropoint ().
Using these values we calculated and magnitudes for V 12. In the calculation of the zeropoints stars with in the interval between 1.2 and 2.6 were used. Most of the stars had a color within 0.3mag of V12. Thus the zeropoints are essentially based on stars of very similar color to V 12, ie. stars similar to the turnoff color of NGC 188.
Before combining the photometry and adjusting zeropoints (see Section 3.2), we formed mean values of the out-of-eclipse observations of V 12 from ALFOSC and StanCam in order to obtain a higher precision than obtained by Stetson et al. (2004). This is important for the determination of effective temperatures and distances. RMS errors of about 0.005 magnitudes were obtained, compared to 0.013 () and 0.018 () for Stetson et al. (2004). The mean magnitudes from the two instruments agreed, whereas a difference of about 0.02 magnitudes was seen in . We adopt the following out-of-eclipse results for V 12: , , .
3.2 V 12 light curves
When combining calibrated photometry from several detector/filter combinations the photometric scale and zeropoints are always a concern. We therefore compared the phased light curves to check their quality. We therefore calculated the phased light curve to check its quality. The photometry showed good consistency between the various sources with typical offsets from the average of . However the situation for the filter was somewhat poorer, with ALFOSC and StanCam data showing a consistent offset of 0025mag. We have not been able to track down a definitive cause for these inconsistencies but note that Stetson et al. (2003) carried out an extensive analysis of a large dataset for the old open cluster NGC 6791 and found that combining calibrated photometry from different telescope/filter/CCD combinations and different nights can exhibit scatter of the order . We note that the flat field of ALFOSC contains relatively large gradients near the center of the field where V 12 is located in our images. This instrument is a combined focal-reducer and spectrograph and the gradient seen is probably due to sky concentration. We speculate that this is related to the offsets between the ALFOSC and StanCam data. Offsets of similar size were found for the Mercator and Bialkow data in I.
Since the internal precision of our data is significantly better than 001 we decided to adjust the zeropoints on a nightly basis for both the V and I data in order to produce a phased light curve with the smallest amount of scatter. To do this we first decided to adopt the values of V and I from Stetson et al. (2004) as our out-of-eclipse magnitudes for V 12 since this is well calibrated and multi-epoch photometry (at random phases for V 12). For each night with photometric data out (or partly out) of eclipse we adjusted the zeropoint to the values of Stetson et al. (2004). Using the phased data, small offsets were then applied to the remaining light curve segments.
It is important to emphasize that the depths of the eclipses of the final light curves are the same as observed with the different instruments. The data from Bialkow, NOT/StanCam and NOT/ALFOSC cover parts of the eclipse which include the central eclipse and out-of-eclipse data, and the observed eclipse depths in these agree to 001 to 002. We also note that for the analysis of the light curve the absolute level of the out-of-eclipse part does not have any influence. This only enters into the determination of the absolute magnitude of the stars (or equivalently the cluster distance modulus). The out-of-eclipse data from NOT show a scatter around a constant level of 3.4 mmag for both the V and I filter.
The light curves are shown in Figs. 3 and 4. A total of 379 and 383 measurements were obtained in and , respectively 555Light curve tables are available electronically. Both eclipses have been covered on several nights, and there are enough data points outside eclipses to define the maximum light level because V 12 is so well detached that essentially no out-of-eclipse variations are present. The eclipses are narrow and of almost identical depths (about 0.6 mag in V). They are of the same duration, and secondary eclipse occurs at phase 0.5, consistent with a circular orbit.
As a final note we point out that the V 12 field is uncrowded and the stars are bright. This means that it should be a fairly easy task to obtain even better data than presented here. To avoid the transformation difficulties encountered here this should be done using a single telescope/detector/filter combination for each band.


3.3 Times of minimum and ephemeris
| HJD-2400000 | r.m.s. | Type | O-C/Phase | Band |
|---|---|---|---|---|
| 50906.03886 | 0.00276 | - | 0.00003 | Spectroscopic orbit |
| 53221.56770 | 0.00052 | P | -0.00083 | I |
| 53221.56854 | 0.00053 | P | 0.00001 | V |
| 53229.61958 | 0.00022 | P | -0.00051 | I |
| 53229.62044 | 0.00011 | P | 0.00035 | V |
| 53312.62875 | 0.00019 | P | 0.00007 | I |
| 53312.62954 | 0.00015 | P | 0.00086 | V |
| 51605.25 | 0.01 | S | 0.49989 | Zhang et al (2001) |
| 53452.47085 | 0.00028 | S | 0.49997 | I |
| 53452.47109 | 0.00010 | S | 0.50000 | V |
| 53465.48005 | 0.00047 | S | 0.50006 | I |
| 53465.48001 | 0.00060 | S | 0.50005 | V |
From the V and I light-curve observations, six times of primary minimum and four times of secondary minimum have been derived. They are given in Table 4 together with the time of primary minimum obtained from the spectroscopic orbit (see Section 2) and the approximate time of secondary minimum by Zhang et al. (2004). When possible, the method of Kwee & van Woerden (1956) was applied, otherwise a second order polynomial was fitted to the observations.
An unweighted linear least squares fit to the times of primary minimum yields the following ephemeris:
|
(2) |
which we adopt for the light-curve and radial velocity analysis. Within errors, the times of secondary minimum give the same period, and applying weights leads to nearly identical results. We find no evidence for eccentricity of the orbit of V 12.
3.4 Photometric elements
| Band | ||||||
|---|---|---|---|---|---|---|
| Limb darkening | C00 | VH93 | Free | C00 | VH93 | Free |
| (°) | 88.55 | 88.62 | 88.65 | 88.57 | 88.62 | 88.64 |
| 0.0756 | 0.0755 | 0.0755 | 0.0742 | 0.0742 | 0.0743 | |
| 0.0724 | 0.0719 | 0.0716 | 0.0731 | 0.0726 | 0.0723 | |
| 0.958 | 0.952 | 0.949 | 0.985 | 0.978 | 0.973 | |
| 0.1480 | 0.1474 | 0.1471 | 0.1473 | 0.1469 | 0.1466 | |
| 0.67 | 0.59 | 0.55 | 0.52 | 0.43 | 0.39 | |
| 0.38 | 0.38 | 0.38 | 0.30 | 0.30 | 0.30 | |
| 0.9823 | 0.9824 | 0.9824 | 0.9954 | 0.9957 | 0.9960 | |
| 0.901 | 0.890 | 0.884 | 0.967 | 0.953 | 0.943 | |
| (mag.) | 0.0058 | 0.0057 | 0.0057 | 0.0055 | 0.0054 | 0.0054 |
| 0.981 | 0.996 | |
| 0.913 | 0.927 | |


The choice of binary model for light-curve analysis depends strongly on the relative radii of the components and the irradiation between them. In our case, the system is well detached with relative radii below 0.1, the components are little deformed (oblateness of 0.0006) and reflection effects are small. Therefore, the simple Nelson-Davis-Etzel model (Nelson & Davis, 1972; Etzel, 1981; Martynov, 1973), which represents the deformed stars as biaxial ellipsoids and applies a simple bolometric reflection model, is expected to be adequate.
We have adopted the corresponding EBOP code (Popper & Etzel, 1981), supplemented by an extended version JKTEBOP including Monte Carlo simulations for the analysis and the assignment of realistic errors for the photometric elements; see e.g. Southworth et al. (2004a, b).
We have analyzed the and light curves independently, and for each band identical weights have been assigned to all observations. A photometric scale factor (the magnitude at quadrature) was always included as an adjustable parameter, and the phase of primary eclipse was allowed to shift from 0.0. The mass ratio between the components was kept at the spectroscopic value. Gravity darkening coefficients corresponding to convective atmospheres were applied in accordance with the effective temperatures derived below, and the simple bolometric reflection model build into EBOP was used. Linear limb darkening coefficients were either assigned from theoretical calculations (Van Hamme, 1993; Claret, 2000) according to the effective temperatures, surface gravities, and abundances, or included as adjustable parameters.
In tables and text on photometric solutions we use the following symbols: orbital inclination; relative radius; ; linear limb darkening coefficient; gravity darkening coefficient; central surface brightness; luminosity.
EBOP solutions for V 12 are shown in Table 5. The following parameters were adjusted: , , , and , and as seen their formal errors are quite small. For each band, the solutions for the different assumptions on limb darkening agree well, and also differences between the and solutions are small. The adjusted linear limb darkening coefficients are close to those by Van Hamme (1993), whereas those by Claret (2000) are about 0.1 higher in both bands.
In order to assign realistic errors to the photometric elements, we have supplemented the analysis with EBOP solutions for a range of values near 1.00, which are compared in Fig. 5, and 10 000 JKTEBOP Monte Carlo simulations in each band; see Fig. 6 for details. The adopted photometric elements listed in Table 6 are the weighted mean values of the EBOP solutions adopting the linear limb darkening coefficients by Van Hamme (1993). The final radiative parameters were derived from a solution that uses the weigthed average of the geometric properties. Errors are based on the Monte Carlo simulations and comparison between the and solutions. We find that at phase 0.0, about 80% of the light from the primary component is eclipsed, and at phase 0.5 about 85% of the light of the secondary is blocked out.
4 Physical parameters for V 12
| Primary | Secondary | |
|---|---|---|
| Absolute dimensions: | ||
| (cgs) | ||
| Photometric data: | ||
| Distance (pc) |
| Calibration | |||||||
|---|---|---|---|---|---|---|---|
| 0.687 | 0.427 | 0.795 | 0.367 | 1.291 | 1.660 | 1.658 | |
| 0.600 | 0.375 | 0.682 | 0.306 | 1.103 | 1.442 | 1.423 | |
| 5837 | AAM | ||||||
| 5980 | 5705 | 5899 | 6146 | C | |||
| 5887 | 5650 | 5890 | VC | ||||
| 5846 | 5616 | 5780 | 5986 | 5871 | 5690 | 5883 | RM |
| 5927 | MJR | ||||||
| 5958 | 5659 | 5791 | 6011 | 5874 | 5804 | 5969 | CLF |
Absolute dimensions for the components of V 12 were calculated from the spectroscopic and photometric elements given in Tables 2 and 6. As seen in Table 7, masses and radii for the only slightly different components have been determined to an accuracy of about 0.6% and 1.4%, respectively. Individual and magnitudes are included, as calculated from the combined magnitudes outside eclipses (Section 3.1) and the luminosity ratios (Table 6). For interstellar reddening and absorption corrections, we have used , , and . For (8140Å), the relations by Cardelli et al. (1989) give the same ratio, and for the color of V 12, the relation by Dean et al. (1978) leads to the same reddening.
4.1 The systemic and component effective temperatures
Effective temperatures were derived from the recent calibrations by Alonso et al. (1996), Castelli (1999), VandenBerg & Clem (2003), Ramírez & Meléndez (2005), Masana et al. (2006), and Casagrande et al. (2006). Because the surface fluxes of the components are nearly identical, the two stars have almost the same ; the empirical visual flux calibration by Popper (1980) with bolometric corrections by Flower (1996) yield a difference of only 25 K. We have therefore applied all available color indices for the combined light from Section 3.1, Stetson et al. (2004), and from 2MASS666http://www.ipac.caltech.edu/2mass photometry (Cutri et al., 2003), and the individual indices listed in Table 7. Results from the combined indices are presented in Table 8. For each color index, the temperatures derived from the different calibrations agree quite well. Differences in the derived temperatures between indices is, in part, due to uncertainties of the indices, which cause changes of 50-100 K, except for 250 K in . The temperatures based on and would increase by about 120 K and decrease by about 200 K, respectively, if the possible zero point error in of (noted by Stetson et al. (2004)) is applied. A somewhat better agreement between the temperatures is then obtained from the different indices.
For [Fe/H] = 0.00, the individual indices listed in Table 7 give temperatures of 5818 K and 5750 K (Ramírez & Meléndez, 2005), 5928 K and 5858 K (VandenBerg & Clem, 2003), and 5829 K and 5765 K (Casagrande et al., 2006) for the primary and secondary components, respectively. Formally we obtain temperature differences between the components higher than 25 K, as derived from the surface flux ratio, but the uncertainties of the indices, the reddening, the metal abundance, and the calibrations themselves add up (in quadrature) to individual temperature uncertainties of about . Using [Fe/H] = -0.1 typically decreases the temperatures by less than 100 degrees. Giving higher weight to the calibration by VandenBerg & Clem (2003), we assign 5900 K and 5875 K to the primary and secondary components, respectively, both with uncertainties of .
4.2 Analysis of disentangled spectra
Analysis of the disentangled spectra was performed to provide independent values for the temperatures, metallicities, and rotational velocities of the components. We cross-correlated the disentangled spectra of each binary component against a grid of synthetic spectra777The library is based on ATLAS9 (http://kurucz.harvard.edu/) and the companion program SYNTHE used to compute a synthetic spectrum from the model atmosphere and line list. The synthetic spectra were broadened to an instrumental profile equal to the WIYN spectra. spanning appropriate ranges in effective temperature, surface gravity, metallicity, and rotation velocity. The best matches (highest cross-correlation peak heights) for fixed surface gravities () of 4.17 and 4.19 were obtained for temperatures of 5900 K and 6000 K, metallicities of -0.14 and -0.13, and rotation velocities of and , respectively, for the V 12 A and B components. The same analysis was performed for 5 twilight sky spectra from WIYN/Hydra, resulting in a mean temperature 60 K above solar, a mean metallicity 0.06 below solar, and a mean rotational velocity above solar. We estimate that the uncertainties on temperatures and metallicities derived from WIYN/Hydra spectra from this technique are at least 150 K and 0.1 dex. Thus considering the systematic offsets for the Sun , the spectral analysis of V 12 gives results that are entirely consistent with the results from the photometric analysis. Furthermore, the rotational velocities of the binary components are consistent with the synchronous rotation () expected in an old circularized binary system.
4.3 The distance and age of V 12
The accurate masses and radii determined for the components of V 12 are independent of distance, reddening, and color-temperature transformations, and allow direct comparison with stellar models. From the absolute dimensions of the components, we determine identical distance moduli of (), corresponding to pc. We adopt uncertainties of for the bolometric corrections by Flower (1996). From main-sequence fitting in the Stetson et al. (2004) CMD and adopting , VandenBerg & Stetson (2004) derive values of for NGC 188, depending on the assumed chemical composition. Based on the Sarajedini et al. (1999) CMD and adopting also , Michaud et al. (2004) get = from models of solar metallicity.
To determine the age of V 12, we have chosen to use the recent models by Demarque et al. (2004) and the latest VRSS Victoria-Regina models for scaled solar abundances for the heavy elements (VandenBerg et al., 2006). Comparisons were done for [Fe/H] = 0.00 ((Y,Z) = (0.266,0.018)) and [Fe/H] = -0.10 ((Y,Z) = (0.259,0.014)), corresponding to the range of recent values for the cluster metallicity. The two sets of models treat convective core overshooting differently, but at the age of NGC 188 overshooting is not required to match the turnoff region where V 12 is located. We refer the reader to the original papers or Clausen et al. (2008) for more details on the models and their input physics.
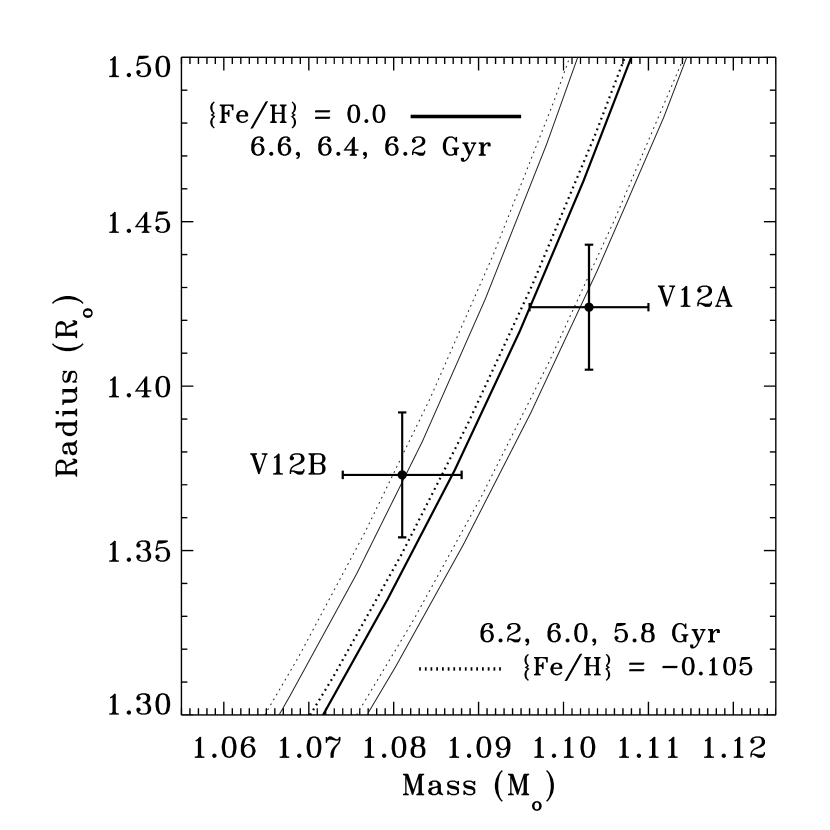
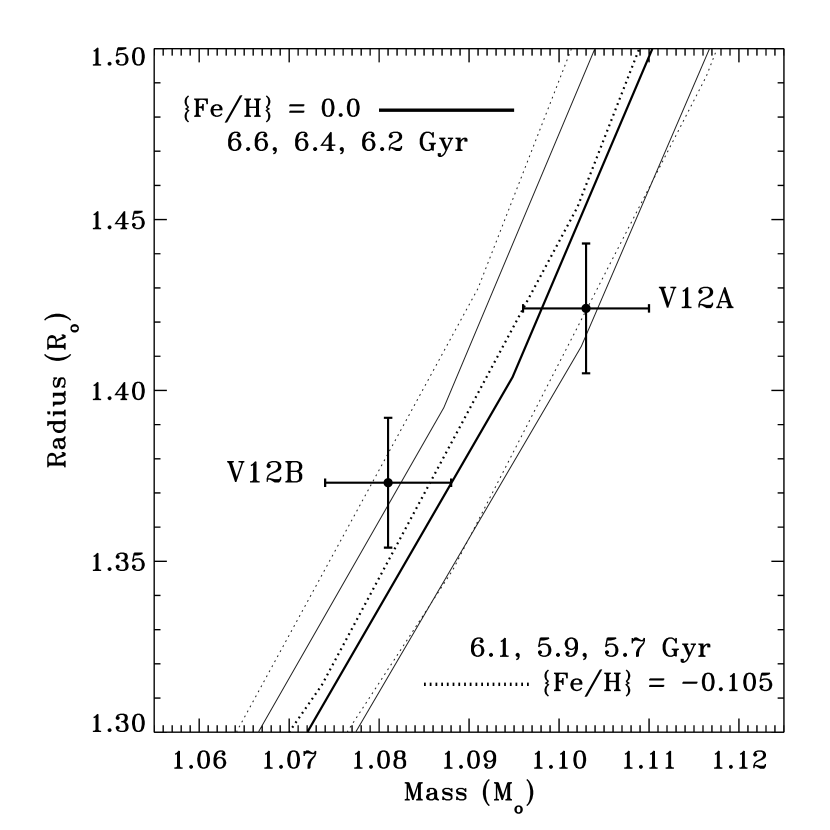
Figure 7 shows the mass-radius diagrams with the locations of the V 12 components and the and VRSS isochrones for relevant ages and [Fe/H] of 0.0 and -0.1. Grids of isochrones with 0.1 Gyr age separations were computed for both models using the available interpolation routines. For [Fe/H] = 0.00, the 6.4 Gyr isochrones from both models, provide the best fit to the V 12 components. For [Fe/H] = -0.1, the best-fit VRSS isochrone has an age of 6.0 Gyr, and the best fit isochrone has an age of 5.9 Gyr. Table 9 lists the isochrone ages for the two different models and the two different chemical compositions considered. We adopt an age of Gyr for V 12 and NGC 188. Thus, for solar metallicity, we agree with the age of 6.2 Gyr obtained by VandenBerg & Stetson (2004). We also confirm the age of 6.4 Gyr derived from solar metallicity diffusive models by Michaud et al. (2004) and the result by Salaris et al. (2004), which is Gyr for [Fe/H] = . In contrast, VandenBerg & Stetson (2004) derive a much higher age (7.7 Gyr) than us for [Fe/H] = -0.10. Overall, the isochrone method applied to the NGC 188 CMD results in a much larger age uncertainty for V 12 than found by our direct method over the same abundance interval.
| Model | [Fe/H] | Age (Gyr) | ||
|---|---|---|---|---|
| VRSS | 0.00 | 0.2768 | 0.0188 | 6.4 |
| -0.10 | 0.2684 | 0.0150 | 6.0 | |
| 0.00 | 0.2662 | 0.0181 | 6.4 | |
| -0.10 | 0.2589 | 0.0145 | 5.9 |
In Figure 8 we present mass-luminosity comparisons with models. On the theoretical side, the luminosity is independent of the mixing length assumed for convection; this is not the case for the radius. On the observational side, the luminosity includes uncertainties for the temperature calibration. In general, the models that best fit the components in the mass-radius plane are too luminous, with only the solar metallicity 6.4 Gyr model marginally within the component errors. The best fit of VRSS and models to the masses and luminosities of the binary components gives ages of 6.1 Gyr and 6.3 Gyr for [Fe/H] = 0.0, and 5.3 Gyr and 5.4 Gyr for [Fe/H] = -0.1. To reach agreement between the model ages determined from the mass-radius and mass-luminosity diagrams would require an increase in the effective temperature of the V 12 components. The necessary temperature changes are 150 K and 400 K for the [Fe/H] = 0.0 and [Fe/H] = -0.1 VRSS isochrones, and 760 K for the [Fe/H] = -0.1 isochrone. We note that the high sensitivity of luminosity to the effective temperature greatly enhances the uncertainty on the luminosity, making ages derived from the mass-luminosity diagrams less reliable.


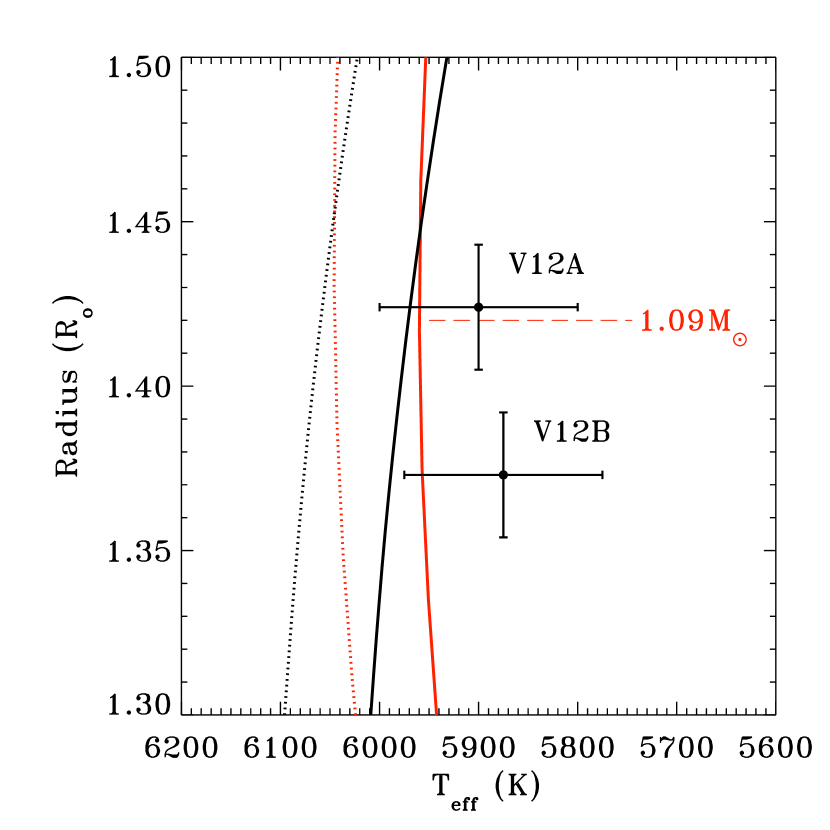
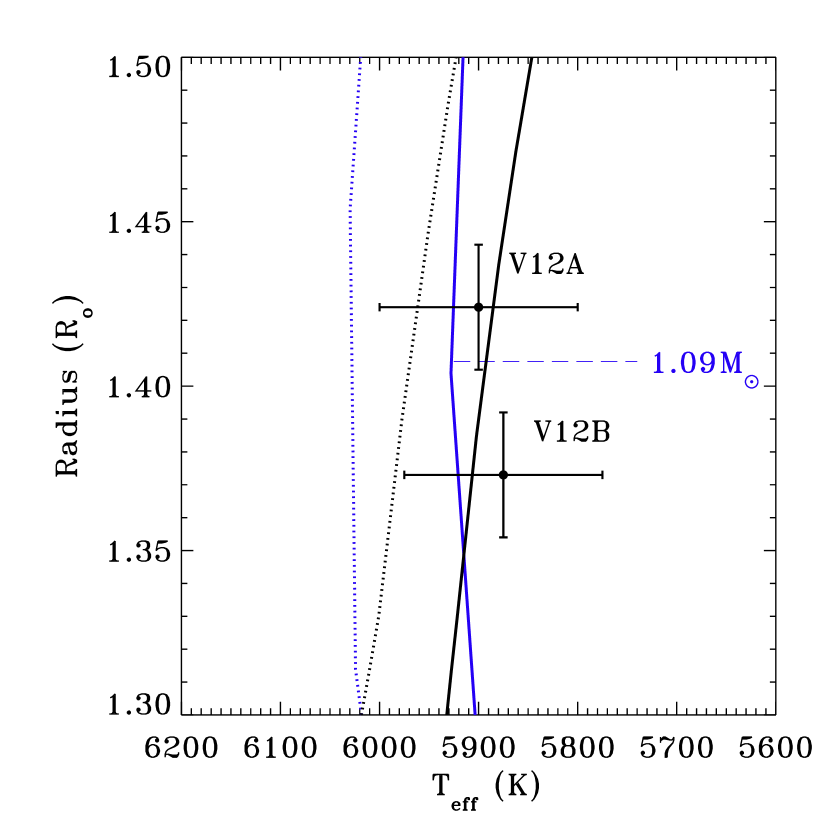
Figure 9 presents the effective temperature vs. radius diagram comparing the values of the V 12 components to those of the VRSS and isochrones and mass tracks. In Figure 9a we show the 6.4 Gyr [Fe/H]=0.0 and the 6.0 Gyr [Fe/H]=-0.1 VRSS isochrones as solid and dotted curves, respectively. In Figure 9b the 6.4 Gyr [Fe/H]=0.0 and the 5.9 Gyr [Fe/H]=-0.1 isochrones are plotted as solid and dotted curves, respectively. In both figures mass tracks corresponding to are shown as grey solid and dashed curves for [Fe/H]=0.0 and [Fe/H]=-0.1, respectively. For solar metallicity, the VRSS isochrone and track only marginally fit the observed quantities of the V 12 components, being slightly hotter, whereas for [Fe/H]=-0.10 both are clearly too hot, especially noting that abundance uncertainties of are included in the temperature errors. Similarly, the isochrone and track for [Fe/H]=-0.10 are also too hot for a proper match to the binary components, although slightly closer in temperature than the corresponding VRSS models. The solar metallicity 6.4 Gyr isochrone and mass-track, however, provide a very close match to the V 12 components. We also note, that the point on the solar metallicity 6.4 Gyr isochrone corresponding to a stellar mass of 1.09 , falls appropriately between the 1.103 and 1.081 components.
From the mass vs. luminosity and effective temperature vs. radius comparisons, the 6.4 Gyr solar-metallicity model provide the best match to the observed and derived properties of the V 12 components. However, we discuss in Section 5 how a zeropoint error in the I-band photometry from Stetson et al. (2004), may cause the derived temperatures for the V 12 components to be too cool by 100-150 K. With a correction for such a temperature offset, the VRSS and isochrones and mass-tracks would fit V 12 equally well.
5 NGC 188 and V 12
The purpose of this section is to present V 12 in the NGC 188 CMD, and to investigate how well the VRSS and isochrones that best fit the V 12 components in the mass-radius diagram, fit the rest of the cluster’s main-sequence, turn-off, and giant branch stars. We show in Figure 10 the NGC 188 V-I vs. V CMD using the photometry from Stetson et al. (2004). All stars brighter than of 4.5 are single radial-velocity and proper-motion members of NGC 188 (Geller et al., 2008; Platais et al., 2003). Stars fainter than of 4.5 are proper-motion members of NGC 188 (Platais et al., 2003). The position of V 12 and of its components are marked using the V magnitudes and V-I colors listed in Table 7. Adopting the distance () and ages of V 12 determined from the analysis of V 12 in Section 4.3, and a reddening of 0.087, we overplot in the left panel of Figure 10 the 6.4 Gyr solar metallicity and the 6.0 Gyr [Fe/H]=-0.1 VRSS isochrones. In the right panel of Figure 10 we have overplotted the 6.4 Gyr solar metallicity and the 5.9 Gyr [Fe/H]=-0.1 isochrones. For the solar metallicity isochrones we have marked the turnoff masses nearest the V 12 primary and secondary components.
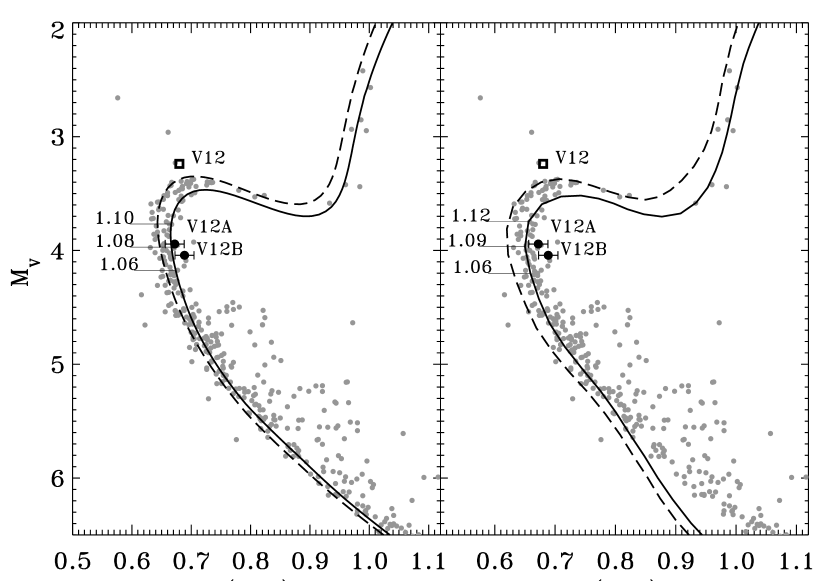
Both VRSS isochrones fit the main-sequence, turnoff, and giant branch of NGC 188 well. The isochrones follow the turnoff curvature well, but both are too blue on the lower main-sequence, and the metal-poor isochrone also falls to the blue of the giant branch. It is clear that without the constraints on the distance and age set by V 12, and on the cluster metallicity by spectroscopic studies, good fits to the cluster stars could be obtained from a range of different cluster metallicities, distances, and ages. For NGC 188, this is demonstrated well by Stetson et al. (2004), who show that ages between 5.9 Gyr and 8.1 Gyr result from the isochrone method when plausible ranges in metallicity and distance modulus are considered. This age-range corresponds to 33% of their mean cluster age of Gyr. With V 12 we provide a constraint on the age of NGC 188 with only a 10% uncertainty due primarily to the uncertainty in the cluster metallicity. Judging from current spectroscopic measurements and from the best fit isochrones to the cluster, it is likely that the cluster metallicity is between solar and = -0.1. With better determination of the cluster metallicity, the age of V 12 and NGC 188 can be further improved.
We note that in the V-I colors from Stetson et al. (2004), V 12 and thus both its components are offset to the red by a few hundreds of a magnitude relative to cluster turnoff. The offset is likely due to a zeropoint error in the I band, because the Stetson et al. B-V color of V12 and its components match the B-V color of the cluster turnoff. Similar offsets for V 12 are found in the B-V and V-I colors in the photometry from Sarajedini et al. (1999). Because we calibrate our photometry using the Stetson et al. (2004) photometry for V 12 (see Section 3.1), we inherit this I band zeropoint shift. Therefore, in Figure 10, V 12 and both its components display a slight red offset with respect to the cluster turnoff. The V-I color offset correspond to 100-150 K and may explain, in part, the discrepancies in luminosity and effective temperature between V12A,B and the VRSS and Y2 isochrones in Figure 8 and Figure 9. The color offset has no affect on the age determination for V12 in this paper because the age is based on the stellar masses and radii only. However, any change in the color of V 12 will affect the distance determined for the binary and thus NGC 188.
6 Summary and conclusions
We have presented time-series photometric and spectroscopic observations of the detached, double-lined, eclipsing spectroscopic binary V 12 in the old open cluster NGC 188. We have determined masses of and , and radii of and for the binary primary and secondary components. The uncertainties in the component masses and radii are not affected by the reddening, metallicity, and the distance to the binary. From the absolute dimensions of the binary components, we derive identical distance moduli of for both components, corresponding to pc.
By comparing the masses and radii of the binary components to the Victoria-Regina (VRSS) and the Yale () model isochrones with [Fe/H] = -0.1 and [Fe/H] = 0.0, we determine a mean age of 6.2 Gyr for V 12 and thus NGC 188, with an uncertainty of 0.2 Gyr. This uncertainty is primarily due to the 0.1 range in [Fe/H] for NGC 188 found in the literature. Our age for V 12 agrees with the age determined by VandenBerg & Stetson (2004) for a solar metallicity isochrone, and with the the ages derived by Michaud et al. (2004) and Salaris et al. (2004). We find good agreement between the ages derived from both the VRSS and models. The solar-metallicity 6.4 Gyr isochrone match well the masses, radii, and effective temperatures of both the primary and secondary components of V 12. The corresponding VRSS isochrone have temperatures slightly hotter () at the component radii, but still fit the components within the errors. A systematic offset in the V-I color of V 12 from Stetson et al. (2004) may explain the temperature discrepancies between the V 12 components and the VRSS isochrones and mass-tracks. Any future correction of the V-I color for V 12 will change its distance.
We use the distance and ages for V 12, together with best estimates for the metallicity and reddening of NGC 188, to investigate the locations of the corresponding VRSS and isochrones relative to cluster members in the CMD. We find that those isochrones fit the cluster cluster giant branch, turnoff, and upper main-sequence reasonably well. However, equally good or better fits to the cluster stars could be obtained by adopting different model metallicities, distances, and ages. This was demonstrated well in Stetson et al. (2004) where plausible changes in the model metallicity and distance result in a range of ages from 5.9 Gyr to 8.1 Gyr for NGC 188 - more than 3 times that resulting from our analysis of V 12.
The age of V 12 and NGC 188 can be further improved from better determination of the metallicity of NGC 188 from spectroscopic studies of main sequence, turn off, and subgiants in NGC 188. Additional radial-velocity measurements, and an effort to obtain improved light curves in more bandpasses, could also provide masses and radii with smaller errors, and thus put better constraints on the stellar models. Finally, additional precise eclipse photometry in e.g. the K-band can make possible an independent determination of the distance to V12 via surface-brightness relations (e.g. di Benedetto, 1998; Kervella et al., 2004).
References
- Alonso et al. (1996) Alonso, S., Arribas, S., & Martínez-Roger, C. 1996, A&A, 313, 873
- Andersen (1991) Andersen, J. 1991, A&AR, 3, 91
- Bonatto et al. (2005) Bonatto, C., Bica, E., & Santos, Jr., J. F. C. 2005, A&A, 433, 917
- Caputo et al. (1990) Caputo, F., Chieffi, A., Castellani, V., Collados, M., Roger, C. M., & Paez, E. 1990, AJ, 99, 261
- Cardelli et al. (1989) Cardelli, J. A., Clayton, G. C., & Mathis, J. S. 1989, ApJ, 345, 245
- Casagrande et al. (2006) Casagrande, L., Protinare, L., & Flynn, C. 2006, MNRAS, 373, 13
- Castelli (1999) Castelli, F. 1999, A&A, 346, 564
- Claret (2000) Claret, A. 2000, A&A, 363, 1081
- Clausen (2004) Clausen, J. V. 2004, New Ast. Rev., 48, 679
- Clausen & Giménez (1987) Clausen, J. V. & Giménez, A. 1987, in 10th European Regional Astronomy Meeting of IAU, Evolution of Galaxies, ed. J. Palous, 185
- Clausen et al. (2008) Clausen, J.V., Torres, G., Bruntt, H. et al. 2008, A&A487, 1095
- Cutri et al. (2003) Cutri, R.M., Skrutskie, M.F., van Dyk, S., et al. 2003, http://www.ipac.caltech.edu/2mass/releases/allsky/doc/explsup.html
- Dean et al. (1978) Dean, J. F., Warren, P. R., & Cousins, A. W. J. 1978, MNRAS, 183, 569
- Demarque & Larson (1964) Demarque, P. R., & Larson, R. B. 1964, ApJ, 140, 544
- Demarque et al. (1992) Demarque, P., Green, E. M., & Guenther, D. B. 1992, AJ, 103, 151
- Demarque et al. (2004) Demarque, P., Woo, J.-H., Kim, Y.-C., & Yi, S. K.,2004, ApJS, 155, 667
- di Benedetto (1998) di Benedetto, G. P., 1998, A&A, 339, 858
- Dinescu et al. (1995) Dinescu, D. I., Demarque, P., Guenther, D. B., & Pinsonneault, M. H. 1995, AJ, 109, 2090
- Eggen & Sandage (1969) Eggen, O. J. & Sandage, A. R. 1969, ApJ, 158, 669
- Etzel (1981) Etzel, P. B. 1981, in Photometric and Spectroscopic Binary Systems, edited by E. B. Carling, & Z. Kopal, 111
- Etzel (2004) Etzel, P.B. 2004, SBOP: Spectroscopic Binary Orbit Program (San Diego State University)
- Flower (1996) Flower, P. J. 1996, ApJ, 469, 355
- Friel & Janes (1993) Friel, E. D. & Janes, K. A. 1993, A&A, 267, 75
- Friel et al. (2002) Friel, E. D., Janes, K. A., Tavarez, M. et al. 2002, AJ, 124, 2693
- Fornal et al. (2007) Fornal, B., Tucker, D. L., Smith, J. A., Allam, S. S., Rider, C. J., & Sung, H. 2007, AJ, 133, 1409
- Geller et al. (2008) Geller, A. M., Mathieu, R. D., Harris, H. C. & McClure, R. D., 2008, AJ, 135, 2264
- Giménez & Clausen (1996) Giménez, A. & Clausen, J. V. 1996, in The Origins, Evolution, and Destinies of Binary Stars in Clusters, A.S.P. Conf. Ser., Vol. 90, eds. E.F. Milone, J.-C. Mermilliod, 44
- Grundahl et al. (2008) Grundahl, F., Clausen, J. V., Hardis, S., & Frandsen, S. 2008, arXiv:0810.2407
- Guinan et al. (1998) Guinan, E. F., Fitzpatrick, E. L., DeWarf, L. E., et al. 1998, ApJ, 509, L21
- Hobbs et al. (1990) Hobbs, L. M., Thorburn, J. A., & Rodriguez-Bell, T. 1990, AJ, 100, 710
- Hynes & Maxted (1998) Hynes, R. I. & Maxted, P. F. L. 1998, A&A, 331, 167
- Iben (1967) Iben, I. J. 1967, Science, 155, 785
- Kaluzny et al. (2006) Kaluzny, J., Pych, W., Rucinski, S.M., & Thompson, I.B. 2006, Acta Astron., 56, 237. astro-ph/0609380
- Kervella et al. (2004) Kervella, P., Thévenin, F., Di Folco, E., Ségransan, D., 2004, A&A, 426, 297
- Kraft & Landolt (1959) Kraft, R. P. & Landolt, A. U. 1959, ApJ, 129, 287
- Kupka et al. (1999) Kupka, F., Piskunov, N., Ryabchikova, T.A., Stempels, H.C., & Weiss, W. 1999, A&AS, 138, 119
- Kurucz (1993) Kurucz, R. L., 1993, in Light Curve Modelling of Eclipsing Binary Stars, ed., E. F. Milone, Springer Verlag, 93
- Kwee & van Woerden (1956) Kwee, K. K., & van Woerden, H. 1956, Bull. Astron. Inst. Netherlands, 12, 327
- López-Morales, M. & Shaw, J. S. (2007) López-Morales, M. and Shaw, J. S. 2007, PASP, 362, 26
- Martynov (1973) Martynov D. Ya. 1973, in Eclipsing Variable Stars, ed. V.P. Tsesevich, Israel Program for Scientific Translation, Jerusalem
- Masana et al. (2006) Massana, E., Jordi, C., & Ribas, I. 2006, A&A, 450, 735
- Mathieu (2000) Mathieu, R. D. 2000, ASP Conf. Ser. 198: Stellar Clusters and Associations: Convection, Rotation, and Dynamos, 517
- Michaud et al. (2004) Michaud, G., Richard, O., Richer, J., & VandenBerg, D. A. 2004, ApJ606, 452
- Meynet et al. (1993) Meynet, G., Mermilliod, J.-C., & Maeder, A. 1993, A&AS, 98, 477
- Mochejska et al. (2008) Mochejska, B. J., Stanek, K. Z., Sasselov, D. D., Szentgyorgyi, A. H., Cooper, R. L., Hickox, R. C., Hradecky, V., Marrone, D. P., Winn, J. N., & Schwarzenberg-Czerny, A., 0811.2896
- Nelson & Davis (1972) Nelson, B., & Davis, W. D. 1972, ApJ, 174, 617
- Platais et al. (2003) Platais, I., Kozhurina-Platais, V., Mathieu, R. D., Girard, T. M., & van Altena, W. F. 2003, AJ, 126, 2922
- Popova & Kraicheva (1984) Popova, M. & Kraicheva, Z. 1984, Astrofiz. Issled. Izv. Spets. Astrofiz. Obs. 18, 64
- Popper (1980) Popper, D. M. 1980, ARA&A, 18, 115
- Popper & Etzel (1981) Popper, D. M., & Etzel, P. B. 1981, AJ, 86, 102
- Ramírez & Meléndez (2005) Ramírez, I. & Meléndez, J. 2005, ApJ, 626, 465
- Randich et al. (2003) Randich, S., Sestito, P., & Pallavicini, R. 2003, A&A, 399, 133
- Sahade & Davila (1963) Sahade, J. & Davila, F. R. 1963, Ann. d’Astrophys. 26, 153
- Salaris et al. (2004) Salaris, M., Weiss, A., & Percival, S. M. 2004, A&A, 414, 163
- Sandage (1962) Sandage, A. 1962, ApJ, 135, 349
- Sarajedini et al. (1999) Sarajedini, A., von Hippel, T., Kozhurina-Platais, V., & Demarque, P. 1999, AJ, 118, 2894
- Schlegel et al. (1998) Schlegel, D. J., Finkbeiner, D. P., & Davis, M. 1998, ApJ, 500, 525
- Semeniuk (1962) Semeniuk, I. 1962, Acta Astron., 12, 122
- Simon & Sturm (1994) Simon, K. P., & Sturm, E. 1994, A&A, 281, 286
- Southworth & Clausen (2006) Southworth, J. & Clausen, J.V. 2006, Ap&SS, 304, 197
- Southworth et al. (2004a) Southworth, J., Maxted, P. F. L., & Smalley, B. 2004a, MNRAS, 351, 1277
- Southworth et al. (2004b) Southworth, J., Zucker, S., Maxted, P. F. L., & Smalley, B. 2004b, MNRAS, 355, 986
- Southworth et al. (2005) Southworth, J., Maxted, P. F. L., & Smalley, B. 2005, A&A, 429, 645
- Stetson (1987) Stetson, P. B., 1987, PASP, 99, 191
- Stetson (1990) Stetson, P. B., 1990, PASP, 102, 932
- Stetson et al. (2003) Stetson, P. B., Bruntt, H., & Grundahl, F. 2003, PASP, 115, 413
- Stetson et al. (2004) Stetson, P. B., McClure, R.D., & VandenBerg, D. A., 2004, PASP, 116, 1012
- Torres & Ribas (2002) Torres, G., & Ribas, I. 2002, ApJ, 567, 1140
- Torres et al. (1997) Torres, G., Stefanik, R. P., Andersen, J., Nordstrom, B., Latham, D. W., & Clausen, J. V. 1997, AJ, 114, 2764
- Torres et al. (2006) Torres, G., Lacy, C. H., Marschall, L. A., Sheets, H. A., & Mader, J. A. 2006, ApJ, 640, 1018
- Twarog & Anthony-Twarog (1989) Twarog, B. A., & Anthony-Twarog, B. J. 1989, AJ, 97, 759
- Valenti & Piskunov (1996) Valenti, J., & Piskunov, N. 1996, A&AS, 118, 595
- Van Hamme (1993) Van Hamme, W. 1993, AJ, 106, 2096
- VandenBerg & Clem (2003) VandenBerg, D. A., & Clem, J. L. 2003, AJ, 778, 802
- VandenBerg & Stetson (2004) VandenBerg, D. A., & Stetson, P. B. 2004, PASP, 116, 997
- VandenBerg et al. (2006) VandenBerg, D. A., Bergbusch, P. A., & Dowler, P. D. 2006, ApJS, 162, 375
- Worthey & Jowett (2003) Worthey, G. & Jowett, K. J. 2003, PASP, 115, 96
- Zhang et al. (2002) Zhang, X.B., Deng, L., Tian, B., & Zhou, X. 2002, AJ, 123, 1548
- Zhang et al. (2004) Zhang, X. B., Deng, L., Zhou, X., & Xin, Y. 2004, MNRAS, 355, 1369
- Zucker & Mazeh (1994) Zucker, S. & Mazeh, T., 1994, ApJ, 420, 806