Internal Kinematics and Stellar Populations of the Poststarburst+AGN Galaxy SDSS J230743.41+152558.4111Based on observations made with ESO Telescopes at the La Silla or Paranal Observatories under programme ID 077.B-0657
Abstract
We present the first 3D spectroscopic observations of a nearby Hi detected poststarburst, or E+A, galaxy, SDSS J230743.41+152558.4 (catalog ), obtained with the VIMOS IFU spectrograph at ESO VLT. Using the NBursts full spectral fitting technique, we derive maps of stellar kinematics, age, and metallicity out to 2–3 half-light radii. Our analysis reveals a large-scale rapidly rotating disc ( km s-1) with a positive age gradient (0.6 to 1.5 Gyr), and a very metal-rich central region ([Fe/H]=+0.25 dex). If a merger or interaction is responsible for triggering the starburst, the presence of this undisturbed disc suggests a minor merger with a gas-rich satellite as the most plausible option, rather than a disruptive major merger. We find spectroscopic evidence for the presence of a LINER or AGN. This is an important clue to the feedback mechanism that truncated the starburst. The presently observed quiescent phase may well be a temporary episode in the galaxy’s life. SDSS J230743.41+152558.4 (catalog ) is gas-rich and may restart forming stars, again becoming blue before finally settling at the red sequence.
1 Introduction
In the nearby universe, galaxies have a bimodal color distribution, with a blue peak of star forming galaxies separated from a red sequence of quiescent galaxies by a sparsely populated gap (Strateva et al., 2001; Baldry et al., 2004; Balogh et al., 2004). The number of red galaxies has roughly doubled since (Bell et al., 2004). Red galaxies, on average, are more luminous than blue galaxies. Therefore, a simple cessation of star formation in a fraction of the blue galaxies followed by fading and reddening cannot explain this build-up of the red sequence. Starbursts are often suggested as a way of increasing a blue galaxy’s stellar mass before letting it fade onto the red sequence (Bell et al., 2004; Labbé et al., 2007), with mergers and interactions as possible starburst triggers (Bekki et al., 2005; di Matteo et al., 2008). Mergers and starbursts have the additional appeal that they offer an explanation for the cessation of star formation : gas is being consumed by the starburst (di Matteo et al., 2007) and is being expelled by AGN or supernova feedback (Buyle et al., 2008; Kaviraj et al., 2007). Thus, previously blue galaxies turn red and, through further dry mergers, can lead to the formation of the most massive elliptical galaxies observed in the nearby universe (Bell et al., 2006; Naab, Khochfar, Burkert, 2006). This prompted us to investigate the crucial but transient poststarburst phase, during which a galaxy crosses the color gap, of this particular evolutionary pathway.
Poststarburst galaxies (PSGs, or E+A galaxies) have optical spectra with strong Balmer absorption lines, revealing young stars, but faint if any emission lines, ruling out major star formation (Dressler & Gunn, 1983; Couch & Sharples, 1987; Dressler et al., 1999). PSGs offer us a unique window on how starbursts affect galaxy evolution. The starburst population is fading but still quite prominent and we can study both the burst and the underlying intermediate-age and/or old stellar populations. Due to their high surface brightness, we can study their stellar kinematics out to several half-light radii (). Clearly, the poststarburst phase is of crucial importance to furthering our understanding of the photometric evolution of the galaxy population.
In this Letter, we present for the first time two-dimensional spatially-resolved kinematics and stellar population parameters for a gas-rich PSG, selected from the Goto et al. (2003) catalog, SDSS J230743.41+152558.4 (catalog ). With a redshift , luminosity distance Mpc (adopting a spatially flat cosmology with km s-1 Mpc-1, , ), distance modulus mag, and a spatial scale 1.27 kpc arcsec-1, this is a relatively nearby PSG. The few galaxies with known systemic velocities in a 200 kpc wide search column centered on SDSS J230743.41+152558.4 (catalog ) do not coincide in redshift and are spread over a very large redshift range (), making it unlikely that they are physically connected with SDSS J230743.41+152558.4 (catalog ). We confirm the classification of SDSS J230743.41+152558.4 (catalog ) by Yagi & Goto (2006) as a field PSG.
This is the first paper in a series based on our VLT/VIMOS observations of 3 PSGs.
2 Observations and Data Reduction
The data have been obtained with the integral field unit (IFU) mode of the VIMOS spectrograph at ESO/VLT-Melipal by ESO staff in mid-2006. With the high-resolution “HR-blue” spectral setup, the 0.67′′ per lens spatial scale provides a field of view (FoV) of (4040 lenses). This setup offers a spectral resolving power between 4200 and 6300 Å. In total, we use eleven out of twelve obtained exposures, spatially dithered in order to work around broken IFU fibers, and each with an on-source time of 2,000 sec. The seeing FWHM varies between 0.7 and 1.2′′. Arc line and flat field calibration frames have been taken for every Observing Block (OB).
For the data recuction, we use the generic IFU data reduction pipeline implemented in ITT IDL. A brief description of the data reduction steps can be found in Chilingarian et al. (2007b). Detailed information including all VIMOS-specific aspects concerning these data will be provided in a forthcoming paper. Each of the four VIMOS quadrants, labeled Q1 through Q4, of every OB was reduced independent from the others until the flux calibration step. The relative flux calibration of the quadrants is performed using twilight sky frames and requires extra care since we use spatial dithering. The absolute flux calibration was done using observations of spectrophotometric standards included in the standard VIMOS calibration plan.
Night sky spectra are reconstructed from the lenses outside 5 re of the galaxy to minimize contamination by the galactic stellar continuum and are subtracted from the science frames. Then, individual exposures are co-added, applying iterative sigma-clipping to remove cosmic ray hits, spatial and spectral shifts to account for spatial dithering, different heliocentric corrections and atmosphere differential refraction. Noise frames are computed using photon statistics and are processed through the same reduction steps as the science frames, up to the sky subtraction.
We use twilight and science frames contaminated by Moon (4 out of 12) to assess the data reduction quality and obtain quantitative estimates of the VIMOS spectral line spread function variations across the FoV, along the wavelength axis, and between different OBs. We fit the solar spectrum, taken from the ELODIE.3.1 stellar library (Prugniel et al., 2007), against the observed spectra in every lens at six wavelength intervals between 4000 and 6300Å using the PPXF procedure (Cappellari & Emsellem, 2004). From this test, we conclude that (1) wavelength calibration quality is better than 5 km s-1 between 4000 and 5900Å; (2) spectral resolution () exhibits no significant variations across the FoV for individual quadrants, neither between observing blocks, although (3) it does change along wavelength (60 to 40 km s-1 from blue to red) and between quadrants; (4) high-order moments of the Gauss-Hermite parametrisation ( and , van der Marel & Franx, 1993) are close to zero except Q3 at Å, where is modestly negative due to imperfect focusing; (5) systematic errors of the wavelength calibration become very important at Å, changing significantly between individual OBs so we restrict our analysis to shorter wavelengths.
3 Data Analysis
We use the NBursts full spectral fitting technique (Chilingarian et al., 2007a) with high-resolution () pegase.hr (Le Borgne et al., 2004) simple stellar population (SSP) models to extract kinematics and stellar population from the absorption-line spectra. First, we rebin the data to a target signal-to-noise ratio of 15 per bin using the Voronoi adaptive tessellation technique (Cappellari & Copin, 2003). We use only that part of the VIMOS IFU FoV where the sky-subtraction uncertainty is sufficiently small, with a size of 1818 lenses (). The subsequent fitting procedure comprises the following steps: (1) a grid of SSP spectra with a fixed set of ages (spaced nearly logarithmically from 20 Myr to 18 Gyr) and metallicities (from 2.0 to 0.5 dex) is convolved with the wavelength-dependent instrumental response of VIMOS in every Voronoi tessella as explained in Chilingarian et al. (2007b); (2) a non-linear least square fitting against an observed spectrum is done for a template picked from the pre-convolved SSP grid using 2D-spline interpolation on age (), and metallicity (), broadened with the line-of-sight velocity distribution (LOSVD) parametrized by , , , and and multiplied pixel-by-pixel by an order Legendre polynomial (multiplicative continuum), resulting in parameters to be determined (we use ).
We exclude narrow 12Å-wide regions around the H, H, [Oiii] (Å), and [Ni] (Å) lines from the fit in order to be able to detect faint emission lines. As shown in Chilingarian et al. (2007b, 2008), reliable SSP-equivalent age and metallicity estimates are obtained even if the Balmer absorption lines are excluded. Using the approach described in Chilingarian (2009) we estimate the excluded regions to contain only % of age-sensitive information.
4 Results
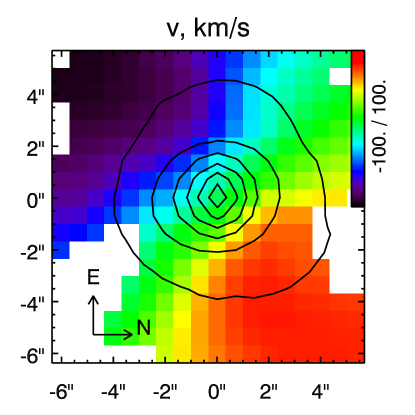
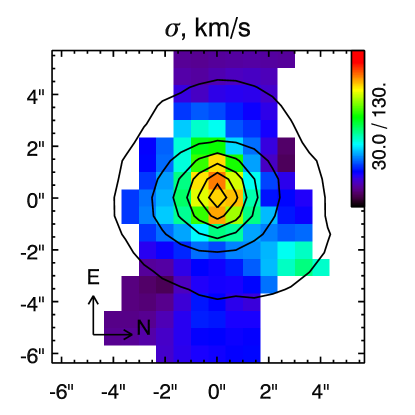
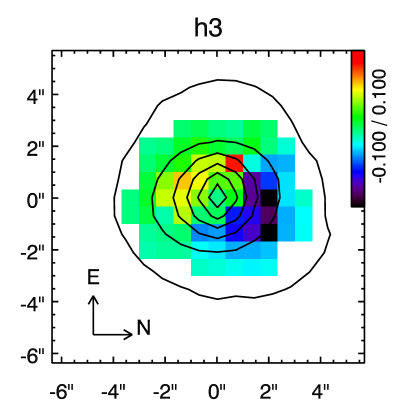
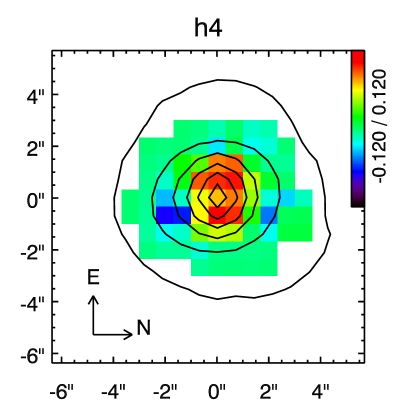
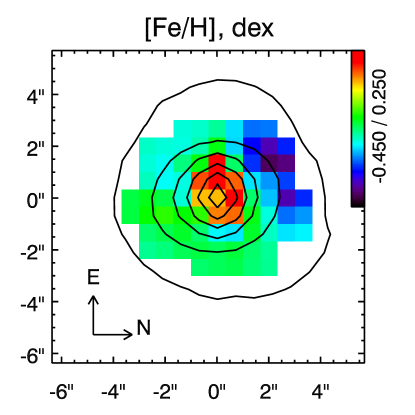
We present the maps derived from the full-spectrum fitting in Fig 1. Those regions where the parameters have large uncertainties (e.g. km s-1 for and ) or are not fit ( and in the outer regions) are masked. The isophotes from the reconstructed continuum image (datacube collapsed along the spectral dimension) are shown as black solid contours. Line-of-sight velocities can be determined with adequate precision out to larger radii from the galaxy centre than the velocity dispersion and the stellar population parameters, because they are insensitive to the sky subtraction.
4.1 Kinematics and dynamics
SDSS J230743.41+152558.4 (catalog ) exhibits very regular, symmetric pure disc rotation with a semi-amplitude of 90 km s-1 without any evidence for significant isovelae twist. However, there is a significant misalignment of the kinematical and photometrical axes. We mention the evident large-scale bar oriented exactly along the galaxy’s minor axis (roughly North-South), which is visible on SDSS images and also noticeable here in the reconstructed image. The rotation curve flattens out at from the centre, corresponding to kpc or (Buyle et al., 2006) (see Fig. 2). The velocity dispersion declines from a central maximum of 110 km s-1 to km s-1 at 6′′. The rather high in the outskirts of the galaxy also argue for the presence of a disc. One has to be careful with interpreting the high very central values, because a rapidly rotating circumnuclear component smeared by atmospheric seeing may produce very similar effects. Weighing all the evidence, SDSS J230743.41+152558.4 (catalog ) is best classified morphologically as a barred lenticular or SB0 galaxy. This is not surprising since, although the diversity is quite large, many E+As have S0-like morphologies (Yang et al., 2008).
We use a technique similar to that proposed by van Moorsel & Wells (1985) to determine the galaxy’s inclination, , and the position angle of the major axis, PA, from the stellar radial velocity field (the main difference being the non-parametric representation of the rotation curve). Fitting the velocity field in elliptical annuli in the radial range gives PA deg and deg. These values agree well with the shape and axial ratio of the outer isophote displayed in Fig 1. The peak projected velocity km s, after correcting for inclination effects, yields km s-1 for the mean tangential velocity. We adopt the value , provided by SDSS, for the exponential scale-length of the stellar density profile. Using these numbers, we estimate the circular velocity at a radius of 4′′, corrected for asymmetric drift using the method outlined in paragraph 4.8.2(a) of Binney & Tremaine (2008). For the outskirts of the galaxy, we assume the rotation curve to be flat () and the velocity dispersions to be independent of radius. We then arrive at the following expression for the circular velocity:
| (1) |
Here, is the tangential velocity dispersion. Unfortunately, along the major axis, is a function of both and , the vertical component of the velocity dispersion tensor. If we assume we are dealing with a thin disc then and km s-1. In the case of an isotropic velocity dispersion tensor, km s-1. The first case yields ; the latter leads to . The velocity width (W20) of the Hi 21 cm emission of this galaxy is km s-1. This corresponds to a circular velocity km s km s-1 (Buyle et al., in prep.), sitting comfortably between the two extreme values derived from stellar kinematics. We will adopt it here as our best-guess value. Using these numbers, we estimate the total dynamical mass within a 5 kpc radius at M⊙.
With a total B-band absolute magnitude M mag (Buyle et al., in prep.), logarithm of the peak circular velocity , logarithm of the central velocity dispersion , SDSS J230743.41+152558.4 (catalog ) sits exactly on the Tully-Fisher (1977) relation for elliptical and S0 galaxies (Bedregal, Aragón-Salamanca, Merrifield, 2006; De Rijcke et al., 2007). It is slightly offset from the E/S0 Faber-Jackson relation (Faber & Jackson, 1976; Gerhard et al., 2001; De Rijcke et al., 2005), being almost mag too bright in the B-band for its velocity dispersion.
In Fig. 3, we present the Fundamental Plane (FP, Djorgovski & Davis, 1987) in -space (Bender et al., 1992). On the vs. plot (the plane’s “face-on view”), the distinct regions are occupied by dwarf (van Zee et al., 2004; Geha et al., 2003; De Rijcke et al., 2005; Chilingarian et al., 2008) and intermediate luminosity and giant early-type galaxies (Bender et al., 1992). The latter region is extended towards the upper-left corner of the plot by low-luminosity bulges and compact elliptical galaxies with M59cO (Chilingarian & Mamon, 2008) being the most extreme case. SDSS J230743.41+152558.4 (catalog ), indicated by the red filled circle, falls in the region occupied by high-surface brightness low-luminosity bulges and ellipticals. Since the FP is defined for early-type galaxies (E/S0) assumed to be virialised systems, we should include the rotational energy into the total balance at a first approximation as . This moves SDSS J230743.41+152558.4 (catalog ) to the position indicated by the end of the green vector in Fig 3, toward the locus of bright E/S0 galaxies.
4.2 Stellar populations and nuclear activity
In the stellar population maps, we clearly see a barely resolved core with a shape and size similar to that of the central -bump. The galaxy center reaches a significantly super-solar metallicity, up to dex. The central SSP-equivalent age is 650 Myr, increasing to approximately 3 Gyr at 3′′ from the galaxy nucleus. The starburst region, where the very young population resides, is about 2 arcsec (2.5 kpc) across. Yagi & Goto (2006) observed SDSS J230743.41+152558.4 (catalog ) using long-slit spectroscopy and found large H equivalent widths out to 2.5 arcsec. The VIMOS data confirm the existence of an extended region showing a young stellar population, although the positive age gradient is significant. For a comparison with the SDSS DR6 spectrum (Adelman-McCarthy et al., 2008) of this galaxy, we integrate the light in the data-cube inside a 3′′ circular aperture and apply the full-spectrum fitting technique to both spectra. We find excellent agreement: all the kinematical and stellar population parameters, including , are consistent within the uncertainties.
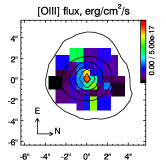
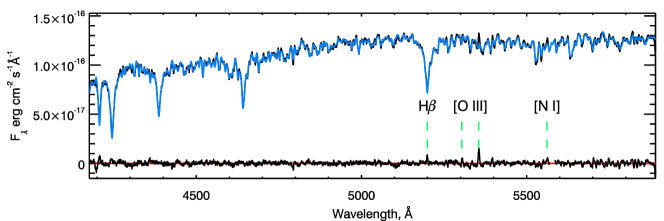
We fit the brightest emission line ([Oiii] Å) with a Gaussian to determine its amplitude (see Fig 4a). Unfortunately, no precise measurements of radial velocities can be made due to the very low emission-line flux. The [Oiii] emission is very centrally concentrated, arguing for the presence of a spatially unresolved emitting region. Careful inspection of the fitting residuals in the central region (Fig 4b) reveals barely-detectable emission in the forbidden [Ni] line ( Å), which is a typical signature of a LINER or AGN. We therefore connect the central peak of the [Oiii] distribution to possible nuclear activity. Fitting the SDSS DR6 spectrum in the full wavelength range of pegase.hr ( Å) and subtracting the best-fitting template from the data reveals strong emission lines in H and [Nii] (Å). The high Nii6584]/H and Oiii5007]/H ratios support the LINER interpretation (Baldwin et al., 1981; Kewley et al., 2006). This would make SDSS J230743.41+152558.4 (catalog ) the second well-studied PSG to date in which low-power nuclear activity has been detected (Liu et al., 2007). As proposed by Kaviraj et al. (2007), AGN feedback may play a crucial role in quenching star formation in massive PSGs by expelling the gas. Buyle et al. (2008) find that most of the Hi gas in the binary PSG system EA01A/B resides outside the stellar bodies of the galaxies, suggesting a feedback process powerful enough to physically displace large quantities of gas, such as AGN feedback (Silk & Rees, 1998; Schawinski et al., 2009). At the same time, the faint H and [Oiii] (Å) emission lines are detected almost everywhere out to from the galaxy centre, suggesting weak ongoing star formation over a large part of the galaxy.
5 Past and future evolution
The distance to SDSS J230743.41+152558.4 (catalog ) corresponds to a light travel time of Myr. We estimate its -band luminosity evolution using the PEGASE.2 (Fioc & Rocca-Volmerange, 1997) evolutionary synthesis code. If we imagine SDSS J230743.41+152558.4 (catalog ) evolving passively during this period, it will fade by, at maximum, 1 mag if all its stars formed 700 Myr ago. In the more plausible case of a composite stellar population, the effect on the total magnitude will be even smaller, because the old population evolves slower than the young one, which has a lower mass fraction. This will make SDSS J230743.41+152558.4 (catalog ) resemble present-day intermediate-luminosity early-type galaxies (E/S0) in its position on the Faber-Jackson relation, the Kormendy relation (Kormendy, 1977), and the Fundamental Plane (see red vector in Fig 3). 4′′, or , encloses about 75 % of the light, resulting in a mass-to-light ratio of in solar units. After 700 Myr of passive evolution, this will have increased to , at maximum. This is compatible with present-day early-type galaxies (Gerhard et al., 2001).
SDSS J230743.41+152558.4 (catalog ) turns to be a fast rotator if one applies the recently proposed classification (Emsellem et al., 2007). However, despite its regular morphology, given the presence of a dominating large-scale dynamically cold disc, we should not classify this object as a typical early-type galaxy. Major mergers and interactions may lead to strong, abruptly truncated star formation episodes, as shown statistically using numerical simulations by di Matteo et al. (2007), resulting in the E+A phenomenon. Such violent events heat and often even completely destroy the discs, leaving little opportunity to explain the observed velocity field of SDSS J230743.41+152558.4 (catalog ). On the other hand, a minor merger of a large disc-dominated lenticular or early-type spiral with an intermediate-mass gas-rich satellite may be an acceptable explanation: young stars will actively form in the disc from the accreted intermediate-metallicity ISM while the central star formation peak will consume the metal-rich gas often present in the circumnuclear regions of early-type galaxies.
Given the presence of neutral gas (Buyle et al., 2006), the quenching of star formation in SDSS J230743.41+152558.4 (catalog ) could very well be a transient phase. For instance, the gaseous component could have been dispersed by supernova or AGN feedback and may re-accrete after several hundred Myrs, possible restarting the star formation. If this object had been observed during a star-forming episode, it would have been classified as a barred late-type spiral (SBcd).
Deep Hi radio observations have led to the detection of 21 cm emission in about 60 per cent of the targeted PSGs (Buyle et al., 2006). Some of the detected PSGs are as gas-rich as local LIRGS and mergers, possible progenitors of PSGs in the local universe (Kaviraj et al., 2007). The presence of large quantities of gas indicates that many PSGs might actually be observed during an inactive phase of the star-formation duty cycle. This suggests that the evolution from blue to red galaxy may encompass several cycles back and forth in the colour–magnitude diagram before the galaxy finally settles on the red sequence.
References
- Adelman-McCarthy et al. (2008) Adelman-McCarthy, J. K., Agüeros, M. A., Allam, S. S., et al. 2008, ApJS, 175, 297
- Baldry et al. (2004) Baldry, I. K., Glazebrook, K., Brinkmann, J., et al. 2004, ApJ, 600, 681
- Baldwin et al. (1981) Baldwin, A., Phillips, M. M., & Terlevich, R. 1981, PASP, 93, 5
- Balogh et al. (2004) Balogh, M. L., Baldry, I. K., Nichol, R., et al. 2004, ApJ, 615, L101
- Bedregal, Aragón-Salamanca, Merrifield (2006) Bedregal, A. G., Aragón-Salamanca, A., Merrifield, M. R., 2006, MNRAS, 373, 1125
- Bekki et al. (2005) Bekki, K., Couch, W. J., Shioya, Y., & Vazdekis, A. 2005, MNRAS, 359, 949
- Bell et al. (2004) Bell, E. F., Wolf, C., Meisenheimer, K., et al. 2004, ApJ, 608, 752
- Bell et al. (2006) Bell, E., Naab, T., McIntosh, D. H. 2006, ApJ, 640, 241
- Bender et al. (1992) Bender, R., Burstein, D., & Faber, S. M. 1992, ApJ, 399, 462
- Binney & Tremaine (2008) Binney, J. & Tremaine, S., 2008, Galactic Dynamics, Second Edition, Princeton University Press, Princeton NJ, USA
- Buyle et al. (2008) Buyle, P., De Rijcke, S., & Dejonghe, H. 2008, ApJ, 684, L17
- Buyle et al. (2006) Buyle, P., Michielsen, D., De Rijcke, S., et al. 2006, ApJ, 649, 163
- Cappellari & Copin (2003) Cappellari, M. & Copin, Y. 2003, MNRAS, 342, 345
- Cappellari & Emsellem (2004) Cappellari, M. & Emsellem, E. 2004, PASP, 116, 138
- Chilingarian (2009) Chilingarian, I. 2009, accepted to MNRAS, arXiv:0812.3272
- Chilingarian et al. (2007a) Chilingarian, I., Prugniel, P., Sil’chenko, O., & Koleva, M. 2007a, in IAU Symposium, Vol. 241, Stellar Populations as Building Blocks of Galaxies, ed. A. Vazdekis & R. R. Peletier (Cambridge, UK: Cambridge University Press), 175–176
- Chilingarian et al. (2008) Chilingarian, I. V., Cayatte, V., Durret, F., et al. 2008, A&A, 486, 85
- Chilingarian & Mamon (2008) Chilingarian, I. V. & Mamon, G. A. 2008, MNRAS, 385, L83
- Chilingarian et al. (2007b) Chilingarian, I. V., Prugniel, P., Sil’chenko, O. K., & Afanasiev, V. L. 2007b, MNRAS, 376, 1033
- Couch & Sharples (1987) Couch, W. J. & Sharples, R. M. 1987, MNRAS, 229, 423
- De Rijcke et al. (2005) De Rijcke, S., Michielsen, D., Dejonghe, H., Zeilinger, W. W., & Hau, G. K. T. 2005, A&A, 438, 491
- De Rijcke et al. (2007) De Rijcke, S., Zeilinger, W. W., Hau, G. K. T., Prugniel, P., & Dejonghe, H. 2007, ApJ, 659, 1172
- di Matteo et al. (2008) di Matteo, P., Bournaud, F., Martig, M., et al. 2008, A&A, 492, 31
- di Matteo et al. (2007) di Matteo, P., Combes, F., Melchior, A.-L., & Semelin, B. 2007, A&A, 468, 61
- Djorgovski & Davis (1987) Djorgovski, S. & Davis, M. 1987, ApJ, 313, 59
- Dressler & Gunn (1983) Dressler, A. & Gunn, J. E. 1983, ApJ, 270, 7
- Dressler et al. (1999) Dressler, A., Smail, I., Poggianti, B. M., et al. 1999, ApJS, 122, 51
- Emsellem et al. (2007) Emsellem, E., Cappellari, M., Krajnović, D., et al. 2007, MNRAS, 379, 401
- Faber & Jackson (1976) Faber, S. M. & Jackson, R. E. 1976, ApJ, 204, 668
- Fioc & Rocca-Volmerange (1997) Fioc, M. & Rocca-Volmerange, B. 1997, A&A, 326, 950
- Geha et al. (2003) Geha, M., Guhathakurta, P., & van der Marel, R. P. 2003, AJ, 126, 1794
- Gerhard et al. (2001) Gerhard, O., Kronawitter, A., Saglia, R. P., & Bender, R. 2001, AJ, 121, 1936
- Goto et al. (2003) Goto, T., Nichol, R. C., & Okamura, S. e. a. 2003, PASJ, 55, 771
- Kaviraj et al. (2007) Kaviraj, S., Kirkby, L. A., Silk, J., & Sarzi, M. 2007, MNRAS, 382, 960
- Kewley et al. (2006) Kewley, L. J., Groves, B., Kauffmann, G., & Heckman, T. 2006, MNRAS, 372, 961
- Kormendy (1977) Kormendy, J. 1977, ApJ, 218, 333
- Labbé et al. (2007) Labbé, I., Franx, M., Rudnick, G., et al. 2007, ApJ, 665, 944
- Le Borgne et al. (2004) Le Borgne, D., Rocca-Volmerange, B., Prugniel, P., et al. 2004, A&A, 425, 881
- Liu et al. (2007) Liu, C. T., Hooper, E. J., O’Neil, K., et al. 2007, ApJ, 658, 249
- Naab, Khochfar, Burkert (2006) Naab, T., Khochfar, S., Burkert, A. 2006, ApJ, 636, L81
- Prugniel et al. (2007) Prugniel, P., Soubiran, C., Koleva, M., & Le Borgne, D. 2007, ArXiv Astrophysics e-prints
- Schawinski et al. (2009) Schawinski, K., Lintott, C. J., Thomas, D., et al. 2009, ApJ, 690, 1672
- Silk & Rees (1998) Silk, J. & Rees, M. J. 1998, A&A, 331, L1
- Strateva et al. (2001) Strateva, I., Ivezić, Ž., & Knapp, G. R. e. 2001, AJ, 122, 1861
- Tully & Fisher (1977) Tully, R. B. & Fisher, J. R. 1977, A&A, 54, 661
- van der Marel & Franx (1993) van der Marel, R. P. & Franx, M. 1993, ApJ, 407, 525
- van Moorsel & Wells (1985) van Moorsel, G. A. & Wells, D. C. 1985, AJ, 90, 1038
- van Zee et al. (2004) van Zee, L., Skillman, E. D., & Haynes, M. P. 2004, AJ, 128, 121
- Yagi & Goto (2006) Yagi, M. & Goto, T. 2006, AJ, 131, 2050
- Yang et al. (2008) Yang, Y., Zabludoff, A. I., Zaritsky, D., Mihos, J. C. 2008, ApJ, 688, 945
 |
 |
 |
 |
 |
 |


 |
 |