High resolution NaI and CaII absorption observations towards M13, M15 and M33.
Abstract
We present high resolution (R = 60,000) measurements of the NaI D1 D2 (5890Å) and CaII K (3933Å) interstellar absorption line profiles recorded towards several post-AGB stars located within the M13 and M15 globular clusters, supplemented with a lower resolution spectrum of the CaII K-line observed in absorption towards an Ofpe/WN9 star in the central region of the M33 galaxy. The normalized interstellar absorption profiles have been fit with cloud component velocities, doppler widths and column densities in order to investigate the kinematics and physical conditions of the neutral and partially ionized gas observed along each sight-line. Our CaII observations towards M13 have revealed 4 absorption components that can be identified with galactic Intermediate Velocity Clouds (IVCs) spanning the -50 Vlsr -80 km s-1 range. The NaI/CaII ratio for these IVC’s is 0.3, which characterizes the gas as being warm (T 103K) and partially ionized. Similar observations towards two stars within M15 have revealed absorption due to a galactic IVC at Vlsr +65 km s-1. This IVC is revealed to have considerable velocity structure, requiring at least 3 cloud components to fit the observed NaI and CaII profiles.
CaII K-line observations of a sight-line towards the center of the M33 galaxy have revealed at least 10 cloud components. A cloud at Vlsr -130 km s-1 is either an IVC associated with the M33 galaxy occurring at +45 km s-1 with respect to the M33 local standard of rest, or it is a newly discovered HVC associated with our own Galaxy. In addition, 4 clouds have been discovered in the -165 Vlsr -205 km s-1 range. Three of these clouds are identified with the disk gas of M33, whereas a component at -203 km s-1 could be IVC gas in the surrounding halo of M33.
1 Introduction
It has long been known that the Galaxy is surrounded by ionized and neutral gas clouds in the form of a hot and ionized galactic halo (Spitzer, 1956), in addition to the numerous neutral intermediate-velocity (IV) and high-velocity (HV) gas clouds (Wakker van Woerden, 1997). These two types of cloud are normally defined by their observed radial velocities, such that IVCs have velocities of VLSR 30 - 90 km s-1 and HVCs have velocities of VLSR 90 km s-1. Understanding the physical and chemical characteristics of both types of gas cloud is fundamental in defining our current ideas on how matter is exchanged between the Galaxy and the surrounding intergalactic medium. Although the origins of both IVCs and HVCs are still hotly debated (Spitoni et al., 2008), it seems likely that they are linked to either expelled gas from a supernova-driven galactic fountain (Bregman, 1980) or they represent accumulations of tidally-stripped or condensed and cooled gas (Putman et al., 2003; Maller Bullock, 2004). Irrespective of their true origin, it is generally agreed that IVCs and HVCs are providing infalling gas, which is theorized to be required in order to sustain both the star formation process and the presence of an interstellar medium in our Galaxy (van den Bergh, 1962). If IVCs and HVCs are a major source of this gaseous infall, then knowledge of the mass and chemical composition of each cloud are key input parameters for any model of galactic evolution and star formation Alibes et al. (2001).
The chemical composition and physical state of gas in HVCs and IVCs are best determined through absorption measurements at ultraviolet wavelengths (Wakker, 2001; Richter et al., 2001; Collins et al., 2007). These data suggest that the majority of neutral HVCs have subsolar metallicities, implying that some fraction of the gas is of a primordial extragalactic origin. However recent observations of a new type of highly ionized HVCs that are not associated with neutral HI emission, have revealed supersolar metallicity values which suggests a galactic origin for the gas in these particular HVCs (Fox et al., 2006; Zech et al., 2008). Similarly, the gas associated with IVCs also appears to possess near solar abundances (Richter et al., 2001), except that the majority of IVCs are relatively nearby objects of distance 2kpc compared with the more distant HVCs of distance 5 kpc (Olano, 2008). However, we note that all these assumptions are based on relatively few observations of HVCs and IVCs, with the data often being of a low S/N ratio because of the relative faintness of the background sources used in the absorption observations.
However, with the advent of high resolution spectrographs coupled to very large aperture ground-based telescopes, it is now possible to routinely investigate the interstellar gas residing beyond our own Galaxy through classical absorption spectroscopy techniques that involve distant (d 5 kpc) background stellar sources. In particular, the well-known interstellar lines of NaI-D (5890Å) and CaII-K (3933Å) have been extremely useful in revealing the presence of, and determining accurate distances to, IVCs and HVCs (Smoker et al., 2004, 2007; Kennedy et al., 1998). In particular, interstellar absorption observations of the sight-lines towards hot post-AGB stars within globular clusters of known distance has proven highly fruitful. Their sight-lines can provide (a) distance limits to absorption arising within foreground IVCs and HVCs as seen in their visible NaI and CaII interstellar absorption spectra (Lehner et al., 1999) and (b) metal abundance determinations of foreground IVC and HVC gas, through interstellar absorption spectra of numerous ultraviolet resonance lines (Zech et al., 2008).
In this Paper we present high resolution (R 60,000) observations of the NaI D-lines and the CaII K-line seen in absorption towards two post-AGB stars in the globular cluster NGC 7078 (M15) and toward one post-AGB star in NGC 6205 (M13). We also present a lower resolution CaII K-line spectrum of the hot star UIT-236 which resides in a planetary nebula in the central regions of the M33 galaxy. Using these data we discuss the velocity structure of the interstellar absorption observed along each sight-line and attempt to associate these cloud components with a galactic, extended halo or extra-galactic origin. These data will also supplement a forthcoming abundance analysis of these 4 sight-lines using ultraviolet absorption observations (with a resolving power of 20,000) using the Cosmic Origins Spectrograph due to be flown in mid-2009 on Servicing Mission 5 to the Hubble Space Telescope.
2 Observations and Data Reduction
We present absorption observations of the interstellar NaI D-line doublet at 5890Å and the CaII K-line at 3393Å recorded towards hot post-AGB stars in the M13 (NGC 6205) and M15 (NGC 7078) globular clusters, in addition to the Of/WN9 star UIT-236 in the M33 galaxy. The 4 target stars, together with associated astronomical information and appropriate references, are listed in Table 1. These data were obtained during service observing runs performed during 2008 March to July with the High Dispersion Spectrograph (Noguchi et al., 2002) on the 8.2m Subaru telescope of the National Astronomical Observatory of Japan in Hawaii. The spectrograph was configured with a cross-disperser angle of 5.52∘ to receive light passing through a 0.6 arc sec wide x 5 arc sec long slit, with the spectra being recorded on two 4k x 2k pixel EEV CCD’s. Spectra were recorded separately for the NaI lines (using the StdYb instrumental set-up) and the CaII line (using the StdBc instrumental set-up). Unfortunately this set-up configuration precluded measurement of the CaII H-line at 3368Å, which appeared in an echelle order very close to the edge of the detector.
The raw data were reduced in a similar manner to that described in Sfeir et al. sfeir99 (1999), which includes cosmic ray removal, CCD bias subtraction, flat-fielding and inter-order background subtraction. The spectra were wavelength calibrated using Th-Ar calibration lamp spectra, which resulted in a wavelength accuracy of 2 km s-1. The spectral resolution of the M13 and M15 spectra was determined to be 5 km s-1, whereas the resolution of the spectrum recorded towards M33 (which was recorded with 2 pixel binning) was 9 km s-1. The telluric water vapor lines that contaminate the NaI absorption spectra were removed using a synthetic transmission spectrum described in Lallement et al. lall93 (1993). The spectra were all well-exposed with typical S/N ratios in excess of 20:1. Finally, the spectral data were converted into velocities in the local standard of rest (LSR) frame.
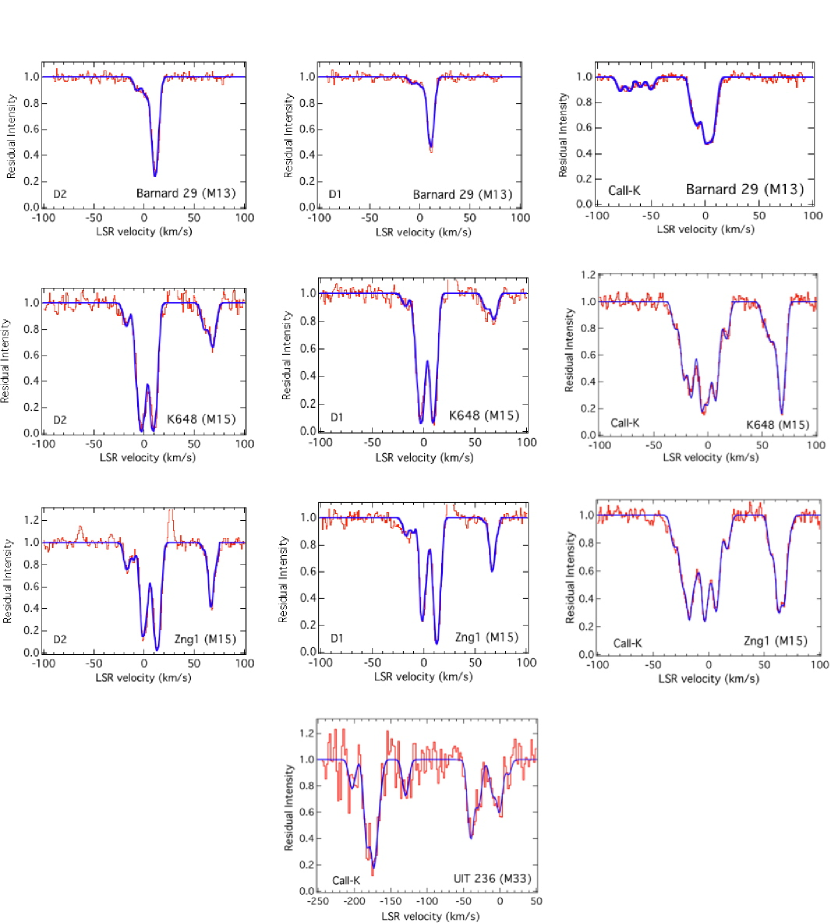
The calibrated spectra were fit with a high order polynomial to produce local continua in order to establish normalized residual intensities for the absorption lines of interest. These normalized profiles were then fit with multiple absorption components (i.e. interstellar clouds) using a line-fitting program described in Sfeir et al. sfeir99 (1999). This program assigns a 3-parameter model fit to the observed profiles using values for the interstellar gas cloud velocity, V, a Gaussian velocity dispersion, and a cloud component column density, . For the case of the NaI D1 and D2 line-doublet, the best-fit was performed simultaneously on both line profiles. Fits were carried out using the number of absorption components, with the addition of extra components only being deemed necessary if the 2 residual error between the observed and model data points decreased by more than 11.1 (Vallerga et al., 1993). In order to derive meaningful interstellar gas temperatures for these fits, the -values were constrained to be 2.9 km s-1 (20,000K ) for the CaII components and to be 3.3 km s-1 ( 15,000K) for the NaI components. The resultant best-fit values of Vlsr, and for the NaI and CaII absorption lines are listed in Table 2, and in Figure 1 we show the observed spectra and their respective model fits. We have also included upper limit estimates for certain important IV components where no absorption feature was detected with significance. These values were derived from conservative estimates of the strength of a potential absorption feature appearing at a level 2.5- above the rms value of the local continuum. The corresponding upper limit on the column density of such features was determined under the assumption of a linear curve of growth and is reported in Table 2.
3 Discussion
3.1 The sight-line to Barnard 29 in the M13 globular cluster
The 7.2kpc sight-line to Barnard 29 in the M13 globular cluster ( = 59∘, = +41∘) passes through the galactic Hercules shell (GS 57+41) at a distance of 150pc (Lilienthal et al., 1992), as well as an Intermediate Velocity Cloud (IVC) first observed in 21cm HI emission (Kerr Knapp, 1972). The observations of Barnard 29 by de Boer and Savage deBoer83 (1983) revealed IV gas at a velocity centered at 80 km s-1 in the MgII, CII and OI absorption lines. Due to the similar velocities of the UV and the HI data it was argued that this absorption arises at an unknown distance within the galactic halo. More recent Leiden-Dwingeloo HI observations have revealed the IV cloud to possess a central velocity of -64.8 km s-1 (smok06, 2006), and the HI maps of Kuntz Danly kuntz96 (1996) show that M13 lies just off the boundary that defines the spatial extent of the IV Arch, a feature that extends over a large portion of the northern galactic hemisphere. Previous NaI D-lineand CaII K-line observations of sight-lines towards several stars within M13 (but not Barnard 29) have revealed IV absorption over the -65 to -72 km s-1 range (Shaw et al., 1996). Observations of the CaII K-line in the sight-line towards Barnard 29 by Bates et al. bates95 (1995) have shown a blend of at least three IV absorption components spanning the -40 to -90 km s-1 range, whereas the more recent measurements of Smoker et al. smok06 (2006) have revealed a similarly broad absorption feature that was fit with only one component centered at Vlsr = -48.4 km s-1. Both sets of data are consistent with our present CaII-K observations that reveal 4 components at Vlsr = -50.1, -59.6, -70.1 and -78.6 km s-1. Our NaI D-line spectra show no measurable absorption at velocities in the -40 to -90 km s-1 range (to a detection level of 5 mÅ for the D2 line), in contrast with other (lower S/N) absorption observations of sight-lines towards 3 angular close stars in M13 (Shaw et al., 1996).
Our integrated value of CaII column density for all 4 IV components is log N(CaII) = 11.64 cm-2, which can be compared with the similar values of log N(CaII) = 11.65 and 11.92 cm-2 measured respectively by Smoker et al smok06 (2006) and Bates et al. bates95 (1995). Additionally, we note in Figure 3 of Smoker et al. smok06 (2006) there appears to be absorption features in both of the D2 and D1 line spectra of Barnard 29 in the -20 to -80 km s-1 range. Unfortunately the velocities of these features are not common to both NaI lines, suggesting that they may be due to incomplete removal of telluric water vapor lines in this wavelength region. If this is the case, then both of our NaI D-line profiles argue against any measurable IV absorption formed over the same velocity range as the CaII-K line. There is a large ( factor of 100) variation in the abundance of Na for high- and intermediate-velocity gas compared with that measured for low-velocity gas (Wakker, 2001), which may explain why, although NaI IV components have been detected along several other sight-lines to M13 (Shaw et al., 1996), we have not been able to detect similar IV NaI towards Barnard 29.
The NaI/CaII ratio for all four of the presently detected IV components is 0.3, which is a value found widely for interstellar clouds that can be characterized as being warm (T 103K), of low density (nH 1 cm-3 and partially ionized (Hobbs, 1975). It has also been shown that the NaI/CaII ratio does not depend on velocity for sight-lines through IVCs and HVCs, since the ratio depends mostly on N(HI) which has lower values at higher velocities (Wakker, 2001). The physical conditions of this IV gas can be compared with the main absorbing cloud at Vlsr +10 km s-1, whose higher NaI/CaII ratio of 3.0 is typical for clouds that are present in colder, more neutral and denser interstellar regions.
As discussed in the Introduction measurement of the distance to IVCs and HVCs is an important parameter. We are able to place a lower limit to the distance of the IV absorption of d = 265pc, based on CaII absorption measurements towards the star HD 156633 ( = 56.4∘, = +33.1∘) which does not reveal any measurable absorption components for Vlsr - 30 km s-1 (Welsh Lallement, 2009)). The upper limit of d = 7.2kpc is obtained from the distance to the M13 globular cluster. Although we did not detect any IV absorption in the NaI lines, we note that this is also consistent with the NaI measurements towards the foreground star HD 147113 ( = 61∘, = +46∘) of distance 600pc (Lilienthal et al., 1992).
3.2 The sight-lines to K648 and Zng1 in the M15 globular cluster
Both of the 10.3 kpc long sight-lines towards the M15 globular cluster (= 65∘, =-27.3∘) pass through a previously known IVC with Vlsr +70 km s-1 (Cohen, 1979; Kerr Knapp, 1972). More recent, higher resolution optical and HI observations of this IV gas (often called the ‘g1’ cloud) have resulted in a distance estimation of between 1.8 to 3.8 kpc to this IVC (Wakker et al., 2008; Smoker et al. 2002a, ; 2002b, ). The absorbing gas within this cloud complex has been shown to exhibit significant small-scale structure with NaI column densities varying by up to a factor 16 across the foreground cloud (Meyer Lauroesch, 1999).
The star Zng-1 has been previously observed at a spectral resolution of 7.5 km -1 in both the NaI and CaII absorption lines (Smoker et al. 2002a, ; 2002b, ). These data revealed appreciable low velocity absorption covering the -30 to +20 km s-1 range, which can be associated with gas in the galactic disk (and perhaps lower halo). An absorption feature centered at Vlsr = +64 km s-1 was observed in both the NaI and CaII lines, which matched the velocity of the HI emission from the foreground IVC gas recorded towards M15. An extra absorption component at Vlsr = +53 km s-1 was also tentatively suggested by these visible observations. Under the assumption that a value of the HI column density to Zng-1 is N(HI) = 5 x 1019 cm-2, the authors derived values of N(CaII) / N(HI) 5 x 10⁻⁸ and N(NaI) / N(HI) 1.3 x 10⁻⁸ for the entire IV gas cloud.
The star K648, which is thought to be the central star of a planetary nebula lying within M15, has been observed in the ultraviolet and has been shown to possess a significant stellar wind with the nebula expanding at 15 km s-1 with respect to the ambient medium (Bianchi et al., 2001) . No previous visible interstellar absorption observations exist for this star.
Our present higher resolution NaI and CaII measurements towards both Zng-1 and K648 (which are separated by only 1.25 arc minute on the sky) show very similar patterns of visible absorption (see Figure 1). These profiles are dominated by low velocity ( -30 to +20 km s-1) absorption originating in the galactic disk/halo, in addition to an IVC absorption centered at Vlsr +65 km s-1. The low-velocity galactic components generally have NaI/CaII ratios 1.0, consistent with the sight-lines sampling a cold and neutral diffuse interstellar medium. In contrast, the NaI/CaII ratios for all of the components associated with the IVC have values 1.0, suggestive of a warm, partially ionized and low density interstellar cloud medium. Our data also clearly show that the IVC gas sampled towards both stars has considerable velocity structure, requiring at least 3 cloud components to fit the observed NaI and CaII absorption profiles. This structure of the IVC, in which several clouds with similar velocities are present (i.e. +55 Vlsr +75 km s1), is consistent with the theoretical scenario in which possible cloud-to-cloud collisions could result in triggering the star formation process within such complexes (Christodoulou et al., 1997).
3.3 The sight-line towards the star UIT-236 in the M33 galaxy
M33, the Triangulum spiral galaxy (NGC 598), is a member of the Local Group lying at a distance of 820 kpc in the direction (= 133.6∘, =-31.3∘) and is about one quarter the size of both the Milky Way and Andromeda galaxies. It has a systemic velocity of Vlsr -180 km s-1 and is viewed near face on. The metallicity of the galaxy is sub-solar, with a radial abundance gradient that differs for different elements (Rosolowsky Joshua, 2008).
The interstellar sight-line towards the Of-type star UIT-236, which is part of the NGC 588 giant HII region, is close to the nucleus of the galaxy and low resolution ultraviolet observations have revealed significant mass-loss (through P-Cygni wind profiles) from this star (Bianchi et al., 2004). Low resolution far ultra-violet absorption observations of UIT-236 recorded with have revealed the presence of both hot 300,000∘K OVI and lower temperature CII gas at Vlsr 180 km s-1 that can be definitely associated with the host galaxy’s ISM (Wakker et al., 2003; Hutchings Butler, 2004). Observations of interstellar molecular H2 and several low ionization ions towards the core of NGC 588 (i.e. UIT-236) with have revealed a common absorption at Vlsr -140 km s-1 (Bluhm et al., 2003). This is a very similar absorption velocity to that of the ‘weak’ component seen in 21cm HI emission towards M33 by Rogstad et al. rog76 (1976).
Our present CaII-K absorption observations towards UIT-236 shown in Figure 1 reveal five major absorption systems centered at Vlsr -205, -175, -130, -35 and 0 km s-1. Unfortunately we have no accompanying interstellar NaI observations towards this star. However, we can associate the two sets of components observed at Vlsr = 0 and -35 km s-1 with absorption due to foreground galactic (and possibly inner galactic halo) interstellar gas. We note that the component at Vlsr -35 km s-1 is consistent with the velocity of gas associated with the outer region of the IVC HI gas which has been termed the ‘PP Arch’ (Wakker, 2001). This stream of IV gas has an implied distance of 1.0 to 2.7 kpc with velocities in the -30 to -60 km s-1 range (Wakker et al., 2008). If we assume an integrated HI column density of N(HI) 5 x 1019 cm-2 for the IV gas (-25 to -45 km s-1) in this direction, then we obtain a N(CaII)/N(HI) ratio of 6 x 10⁻⁸ for the IV cloud complex. Wakker Mathis wakk00 (2000) discovered an empirical relationship between observed values of N(CaII) and N(HI) along many sight-lines, such that for the PP Arch IVC they predict a N(CaII)/N(HI) ratio that is slightly larger than our observed value. This supports the current notion that IVC’s seem deficient in ionized calcium compared with HVCs.
The cloud component observed at Vlsr -130 km s-1 poses the question as to whether it is a high negative velocity HVC belonging to the Milky Way galaxy, or whether it is an IVC associated with the M33 galaxy that occurs at +45 km s-1 with respect to the M33 local standard of rest? The observed velocity of this absorption component is very similar to that of both UV molecular H2 and several low ionization lines measured towards NGC 588 with (Bluhm et al., 2003). This is also very similar velocity to that of the ‘weak’ component seen in 21cm HI emission by Rogstad et al. rog76 (1976), who theorized that this absorption could be due to gas residing above and below the plane of the M33 galaxy. In addition the all-sky map of galactic HVC’s shows only highly negative (V -300 km s-1) velocity gas present in the general direction of M33 (Wakker et al., 2008). We have not been able to confirm the presence of such HV gas with our present interstellar observations to a level of N(CaII) 1011 cm-2. Until future, more extensive, UV absorption observations of the Vlsr -130 km s-1 component are performed, we favor this component’s association with an IVC of the M33 galaxy.
The interstellar CaII gas clouds observed in absorption with velocities in the range -175 Vlsr - 200 km s-1 can be directly associated with gas of the M33 galaxy, since such velocities are close to the systemic velocity of the host galaxy. As noted previously, the FUV absorption lines of interstellar molecular hydrogen, CII (1036Å), FeII (1144Å), ArI (1048Å) and OVI (1032Å) have also been detected with similar velocities towards M33 (Bluhm et al., 2003; Hutchings Butler, 2004). The cloud component at Vlsr -173 km s-1 is saturated and is therefore most probably associated with gas in the disk of M33, which we are viewing almost face-on. The HI emission maps of M33 by Rogstad et al. (rog76, 1976) show the presence of the main velocity components (-150 to - 200 km s-1) occurring in the region within 5 arc min of the galaxy center.
The component with Vlsr = -203 km s-1 could be an IVC of M33 with a relative velocity of -30 km s-1 wrt the disk gas. We note that Grossi et al. gross08 (2008) have recently found several HI clouds surrounding M33 that fall into this velocity range. The current view of M33 is that it is a satellite of the larger M31 galaxy and the complex of surrounding HI (and HII) clouds may be either debris flowing into M33 from the IGM or from a previous interaction with M31. Gaining gas phase abundances of this component (from forthcoming UV absorption observations) would be extremely informative with respect to a better determination of the origin of this cloud.
4 Conclusion
We have presented high resolution (R = 60,000) absorption measurements of the interstellar lines of NaI D1 D2 (5890Å) and CaII-K (3933Å) recorded towards post AGB stars in the M13 and M15 globular clusters, supplemented with a lower resolution spectrum of the CaII-K line seen towards an Ofpe/WN9 star in the central region of the M33 galaxy. The absorption line-profiles have been fit with cloud component velocities and column densities such that the kinematics and physical conditions of the neutral and partially ionized gas components can be investigated.
Four CaII-K absorption components that can be identified with galactic IVC’s spanning the -50 to -80 km s-1 range have been detected towards the M13 globular cluster. The associated NaI/CaII column density ratio for this IVC gas is 0.3, which suggests that the gas is warm (T 103K) and partially ionized. The observations of two stars within M15 have revealed absorption due to a galactic IVC at Vlsr +65 km s-1, which requires at least 3 separate cloud components (closely spaced in velocity) to adequately fit the NaI and CaII profiles.
CaII K-line observations of the sight-line to the M33 galaxy have revealed at least 10 gas cloud components. A cloud at Vlsr -130 km s-1 is either an IVC associated with the M33 galaxy (occurring at +45 km s-1 with respect to the M33 local standard of rest), or it is an newly discovered HVC associated with our own Galaxy. Also, 4 gas clouds have been detected in the -165 to -205 km s-1 range, of which three are probably associated with the disk gas of M33. The cloud at Vlsr = -203 km s-1 could be an IVC residing in the surrounding halo of M33.
Finally, we note that these high resolution visible data will be extremely useful in providing sight-line velocity templates for the forthcoming lower resolution UV absorption studies of these same stars to be carried out with the newly installed Cosmic Origins Spectrograph on the Hubble Space Telescope in mid-2009.
References
- Alibes et al. (2001) Alibes, A., Labay, J. and Canal, R., 2001, A&A, 370, 1103
- (2) Bates, B., Shaw, C., Kemp, S. et al., 1995, ApJ, 444, 672
- Bianchi et al. (2001) Bianchi, L., Bohlin, R., Catanzaro, G. et al., 2001, AJ, 122, 1538
- Bianchi et al. (2004) Bianchi, L., Bohlin, R. and Massey, P., 2004, ApJ, 610, 228
- Bluhm et al. (2003) Bluhm, H., de Boer, K., Marggraf, O. et al., 2003, A&A, 398, 983
- Bregman (1980) Bregman, N., 1980, ApJ, 236, 577
- Christodoulou et al. (1997) Christodoulou, D., Tohline, J. and Keenan, F., 1997, ApJ, 468, 810
- Cohen (1979) Cohen, J., 1979, ApJ, 231, 751
- Collins et al. (2007) Collins, J., Shull, M. and Giroux, M., 2007, ApJ, 657, 271
- (10) de Boer, K. and Savage, B., 1983, ApJ, 265, 210
- Dixon Hurwitz (1998) Dixon, van D. and Hurwitz, M., 1998, ApJ, 500, L29
- Fox et al. (2006) Fox, A., Savage, B. and Wakker, B., 2006, ApJS, 165, 229
- (13) Grossi, M., Giovanardi, C., Corbelli, E. et al., 2008, A&A, 487, 161
- Hobbs (1975) Hobbs, L., 1975, ApJ, 202, 628
- Hutchings Butler (2004) Hutchings, J. and Butler, K., 2004, AJ, 128, 2234
- Kennedy et al. (1998) Kennedy, D., Bates, B. and Kemp, S., 1998, A&A, 336, 315
- Kerr Knapp (1972) Kerr, F. and Knapp, G., 1972, AJ, 77, 354
- (18) Kuntz, K. and Danly, L., 1996, ApJ, 457, 703
- (19) Lallement, R., Bertin, P, Chassefiere, E. and Scott, N., 1993, A&A, 271, 734
- (20) Lallement, R., Welsh, B.Y., Vergely, J.L. et al., 2003, A&A 411, 447
- Lehner et al. (1999) Lehner, N., Rolleston, W., Ryans, R. et al., 1999, A&AS, 134, 257
- Lilienthal et al. (1992) Lilienthal, D., Hirth, W., Mebold, U. and de Boer, K., 1992, A&A, 255, 323
- Maller Bullock (2004) Maller, A. and Bullock, J., 2004, MNRAS, 355, 694
- Meyer Lauroesch (1999) Meyer, D. and Lauroesch, J., 1999, ApJ, 520, L103
- Mooney et al. (2004) Mooney, C., Rolleston, W., Keenan, F. et al., 2004, A&A, 419, 1123
- Noguchi et al. (2002) Noguchi, K., Aoki, W., Kawanomoto, S. et al., 2002, PASJ, 54, 855
- Olano (2008) Olano, C., 2008, A&A, 485, 457
- Putman et al. (2003) Putman, M., Staveley-Smith, L., Freeman, K. et al., 2003, ApJ, 586, 170
- Richter et al. (2001) Richter, P., Sembach, K., Wakker, B. et al., 2001, ApJ, 559, 318
- (30) Rogstad, D., Wright, M. and Lockhart, I., 1976, ApJ, 204, 703
- Rosolowsky Joshua (2008) Rosolowsky, E. and Joshua, S., 2008, ApJ, 675, 1213
- (32) Sfeir, D.M., Lallement, R., Crifo, F. and Welsh, B.Y., 1999, A&A, 346, 785
- Shaw et al. (1996) Shaw, C., Bates, B., Kemp, S. et al., 1996, ApJ, 473, 849
- (34) Smoker, J., Keenan, F., Lehner, N. and Trundle, C., 2002a, A&A, 387, 1057
- (35) Smoker, J., Haffner, L., Keenan, F. et al., 2002b, MNRAS, 337, 385
- Smoker et al. (2004) Smoker, J., Lynn, B., Rolleston, W. et al., MNRAS, 352, 1279
- (37) Smoker, J., Lynn, B., Christian, D. and Keenan, F., 2006, MNRAS, 370, 151
- Smoker et al. (2007) Smoker, J., Hunter, I., Kalberla, P. et al., 2007, MNRAS, 378, 947
- Spitoni et al. (2008) Spitoni, E., Recchi, S. and Matteucci, F., 2008, A&A, 484, 743
- Spitzer (1956) Spitzer, L.J., 1956, ApJ, 124, 20
- Vallerga et al. (1993) Vallerga, J., Vedder, P., Craig, N. and Welsh, B.Y., 1993, ApJ, 411, 729
- van den Bergh (1962) van den Bergh, S., 1962, AJ, 67, 486
- Wakker (2001) Wakker, B., 2001, ApJS, 136, 463
- (44) Wakker, B. Mathis, J., 2000, ApJ, 544, L107
- Wakker van Woerden (1997) Wakker, B.P. van Woerden, H., 1997, ARAA, 35, 217
- Wakker et al. (2003) Wakker, B., et al., 2003, ApJS, 146,1
- Wakker et al. (2008) Wakker, B.P., York, D., Wilhelm, R. et al., 2008, ApJ, 672, 298
- Welsh Lallement (2009) Welsh, B. and Lallement, R., A&A, (in prep)
- Zech et al. (2008) Zech, W., Lehner, N., Howk, C. et al., 2008, ApJ, 679, 460
| Star | R.A. (2000.) | Decl(2000.) | mv | Teff (K) | E(B-V) | distance (kpc) | Reference |
| NGC 6205: Barnard 29 | 16:41:+34.0 | +36:26:08.2 | 13.14 | 20,000 | 0.02 | 7.2 | (1) |
| NGC 7078: K648 | 21:29:59.4 | +12:10:26.0 | 14.7 | 39,000 | 0.13 | 10.3 | (2) |
| NGC 7078: Zng1 | 21:29:58.1 | +12:11:44.2 | 14.8 | 28,000 | 0.13 | 10.3 | (3) |
| M33: UIT 236 | 01:33:53.6 | +30:38:51.8 | 18.1 | 33,000 | 0.10 | 820 | (4) |
| (1) = (Dixon Hurwitz, 1998), (2) = (Bianchi et al., 2001), (3) = (Mooney et al., 2004), (4) (Bianchi et al., 2004) | |||||||
| Star | Vlsr | N | Vlsr | N | NaI/CaII | ||||
| km s-1 | (1010 cm-2) | km s-1 | (1010 cm-2) | ||||||
| M13–Barnard 29 (catalog ) | |||||||||
| …NaI… | 2.5 | …CaII… | -78.6 | 2.9 | 12.2 | 0.20 | |||
| 2.5 | -70.0 | 2.8 | 12.4 | 0.20 | |||||
| 2.5 | -59.5 | 2.8 | 8.4 | 0.3 | |||||
| 2.5 | -50.0 | 2.9 | 10.5 | 0.24 | |||||
| -11.5 | 2.9 | 26.7 | - | ||||||
| -6.5 | 3.3 | 8.5 | -6.6 | 2.9 | 43.0 | 0.20 | |||
| +2.2 | 3.3 | 11.5 | +0.5 | 2.9 | 66.0 | 0.17 | |||
| +5.0 | 2.9 | 52.0 | - | ||||||
| +11.4 | 3.3 | 121.5 | +9.3 | 2.9 | 40.2 | 3.0 | |||
| M15–K648 (catalog ) | |||||||||
| …NaI… | 5 | …CaII… | -30.4 | 2.9 | 23.3 | 0.21 | |||
| 4 | -22.3 | 2.9 | 92.7 | 0.04 | |||||
| -17.1 | 3.3 | 15.3 | -15.2 | 2.9 | 142 | 0.11 | |||
| -8.5 | 0.3 | 84.4 | -6.0 | 2.9 | 188 | 0.45 | |||
| -2.0 | 3.3 | 560** | -0.5 | 2.9 | 147 | 3.8 | |||
| +9.5 | 3.0 | 555** | +7.2 | 2.9 | 153 | 3.6 | |||
| +17.0 | 2.9 | 34.9 | - | ||||||
| 4 | +53.6 | 2.9 | 22.3 | 0.18 | |||||
| +60.8 | 3.3 | 17.2 | +60.1 | 2.9 | 38.8 | 0.44 | |||
| +68.8 | 3.2 | 32.3 | +68.4 | 2.9 | 238 | 0.14 | |||
| M15–Zng1 (catalog ) | |||||||||
| …NaI… | 3 | …CaII… | -31.5 | 2.9 | 25.8 | 0.12 | |||
| 3 | -23.7 | 2.8 | 65.9 | 0.05 | |||||
| -16.6 | 3.0 | 21.5 | -17.5 | 2.9 | 150 | 0.14 | |||
| -9.5 | 0.3 | 21.4 | -11.0 | 2.9 | 53.5 | 0.4 | |||
| -1.5 | 1.1 | 855** | -3.7 | 2.9 | 157 | 5.5 | |||
| +1.8 | 3.2 | 83.6 | +1.4 | 2.9 | 35.4 | 2.4 | |||
| - | +6.9 | 2.9 | 127 | - | |||||
| +13.2 | 2.6 | 668** | +16.0 | 2.9 | 29.3 | 22.8 | |||
| +56.0 | 2.2 | 29.8 | 0.1 | ||||||
| +60.0 | 1.2 | 3.8 | +63.0 | 2.5 | 127 | 0.03 | |||
| +67.0 | 1.8 | 66.3 | +68.0 | 1.6 | 96.2 | 0.7 | |||
| +72.1 | 2.5 | 12.2 | +72.5 | 2.5 | 14.3 | 0.85 | |||
| M33–UIT-236 (catalog ) | |||||||||
| …NaI… | …CaII… | -203 | 2.9 | 42.2 | - | ||||
| -183 | 2.3 | 347 | - | ||||||
| -173 | 2.9 | 906** | - | ||||||
| -165 | 1.8 | 36.3 | - | ||||||
| -130 | 2.9 | 55.5 | - | ||||||
| -40.0 | 2.9 | 211 | - | ||||||
| -29.3 | 2.9 | 75.1 | - | ||||||
| -10.0 | 2.8 | 49.2 | - | ||||||
| -0.6 | 2.6 | 93.8 | - | ||||||
| +12.0 | 0.7 | 22.6 | - | ||||||
| ** = saturated component | |||||||||