An HST/ACS View of the Inhomogeneous Outer Halo of M31††thanks: Based on observations made with the NASA/ESA Hubble Space Telescope, obtained at the Space Telescope Science Institute, which is operated by the Association of Universities for Research in Astronomy, Inc., under NASA contract NAS 5-26555.
Abstract
We present a high precision photometric view of the stellar populations in the outer halo of M31, using data taken with the Hubble Space Telescope Advanced Camera for Surveys (HST/ACS). We analyse the field populations adjacent to 11 luminous globular clusters which sample the galactocentric radial range and reach a photometric depth of magnitudes below the horizontal branch (m mag). The colour-magnitude diagrams (CMDs) are well populated out to and exhibit relatively metal-rich red giant branches, with the densest fields also showing evidence for prominent red clumps. We use the Dartmouth isochrones to construct metallicity distribution functions (MDFs) which confirm the presence of dominant populations with to dex and considerable metallicity dispersions of 0.2 to 0.3 dex (assuming a 10 Gyr population and scaled-Solar abundances). The average metallicity over the range 30–60 kpc is [Fe/H] dex, with no evidence for a significant radial gradient. Metal-poor stars ([Fe/H]) typically account for of the population in each field, irrespective of radius. Assuming our fields are unbiased probes of the dominant stellar populations in these parts, we find that the M31 outer halo remains considerably more metal-rich than that of the Milky Way out to at least 60 kpc.
keywords:
galaxies: evolution—galaxies: formation—galaxies: halo—galaxies: individual (M31)—galaxies: stellar content—galaxies: structure1 Introduction
Understanding the nature and origin of stars at extreme distances from galaxy centres is of paramount importance. Modern theories predict that the stellar halos of massive galaxies result from the continued accretion and disruption of smaller satellite systems [from Searle & Zinn (1978) to Bullock & Johnston 2005; De Lucia & Helmi 2008]. The stellar populations these systems donate to their host halos are unique in terms of their mix of ages, chemical compositions and kinematics. In the outer halos of galaxies, where the mixing timescales are of the order of several gigayears (Johnston et al., 1996), fossil signatures of these accretion events are expected to be well-preserved and detailed studies of the stellar populations in these parts can constrain the number, nature and timescales of both recent and ancient accretion events (e.g., Johnston et al., 2008). Such information is required in order to rigorously test hierarchical growth models against the more traditional monolithic collapse models, in which halo stars form entirely in situ (e.g., Eggen et al., 1962).
The last decade has seen tremendous advances in our understanding of our nearest large neighbour, M31. A particular highlight has been the first detailed exploration of the large-scale stellar distribution and content outside the main body of the galaxy. The Isaac Newton Telescope wide-field imaging survey of M31 mapped a kpc2 region down to magnitudes below the red giant branch (RGB) tip and revealed copious substructure in the spatial distribution of stars (Ibata et al., 2001; Ferguson et al., 2002; Irwin et al., 2005). Follow-up work with the Hubble Space Telescope Advanced Camera for Surveys (HST/ACS) and the DEIMOS spectrograph on Keck has shown that almost all of this inner halo substructure can be explained by a combination of giant stream debris and perturbed disk material (Ibata et al., 2004, 2005; Ferguson et al., 2005; Brown et al., 2006; Fardal et al., 2007; Gilbert et al., 2007; Faria et al., 2007; Richardson et al., 2008), suggesting that there has only been one significant accretion event onto the inner halo of M31 over the last several gigayears.
Attention has recently been turned to the more remote regions of M31’s halo. Using MegaCam on the Canada-France-Hawaii Telescope (CFHT), efforts are underway to map the stellar distribution out to a radius of 150 kpc around M31, with an extension towards M33 (Ibata et al., 2007; McConnachie et al., 2008). In addition to the discovery of several new dwarf galaxies and halo globular clusters (GCs) (Martin et al., 2006; Mackey et al., 2006, 2007; Huxor et al., 2008; McConnachie et al., 2008), this survey has also uncovered new faint debris streams as well as an extremely extended stellar halo with a shallow radial fall-off of . Spectroscopy of individual RGB stars in these outlying regions has yielded the first evidence for a pressure-supported metal poor ([Fe/H]) population in the halo (Chapman et al., 2006; Kalirai et al., 2006; Koch et al., 2008), although it remains unclear whether this component - as opposed to a more metal-rich population associated with discrete substructures - dominates the stellar halo mass in these parts.
In this paper, we present a high precision view of the stellar content in the outer halo of M31 using data taken with the HST/ACS. We analyse the field populations adjacent to 11 luminous GCs which lie at projected radii of . The HST/ACS data yield accurate photometry with high completeness to 2.5 magnitudes below the horizontal branch and thus enable the construction of colour-magnitude diagrams (CMDs) and metallicity distribution functions (MDFs) that are a vast improvement over those obtained from ground, where Galactic foreground and background galaxy contamination pose significant challenges at even moderately bright magnitudes.
The paper is outlined as follows. In § 2 we describe the observations and subsequent treatment of the data while in § 3 we compare and contrast the detailed CMDs of the fields and derive their metallicity distribution functions. In § 4 we discuss our results in the context of theoretical predictions and current literature and in § 5 we summarise our findings.
2 Observations and data reduction
| Field | R.A. | Dec | a | b | c | d | e | f |
|---|---|---|---|---|---|---|---|---|
| (J2000.0) | (J2000.0) | (kpc) | (′′) | () | (dex) | () | ||
| GC7F | 00:38:49.4 | 42:22:48.0 | 18.2 | 0.062 | 40 | 0.3 | -0.78 | 12.0 |
| GC3F | 00:30:27.3 | 41:36:20.4 | 31.8 | 0.075 | 45 | 2.7 | -0.82 | 17.0 |
| GC2F | 00:29:44.9 | 41:13:09.8 | 33.4 | 0.073 | 45 | 3.3 | -0.87 | 21.4 |
| EC2F | 00:42:55.1 | 43:57:28.5 | 36.8 | 0.087 | 50 | 1.0 | -0.81 | 15.5 |
| GC8F | 00:54:25.0 | 39:42:55.5 | 37.1 | 0.051 | 45 | 3.8 | -0.60 | 12.6 |
| GC9F | 00:55:44.0 | 42:46:16.1 | 38.9 | 0.099 | 45 | 1.6 | -0.67 | 10.0 |
| GC1F | 00:26:47.8 | 39:44:45.5 | 46.4 | 0.070 | 40 | 10.3 | -0.67 | 10.3 |
| GC4F | 00:31:09.9 | 37:53:59.7 | 55.2 | 0.058 | 45 | 4.7 | -1.03 | 34.6 |
| EC4F | 00:58:15.5 | 38:03:01.1 | 60.0 | 0.049 | 40 | 2.5 | -0.78 | 15.5 |
| GC5F | 00:35:59.7 | 35:41:03.6 | 78.5 | 0.065 | 45 | 44.0 | ||
| GC10F | 01:07:26.4 | 35:46:49.7 | 99.9 | 0.055 | 45 | 16.8 |
aProjected radial distance assumes (McConnachie et al., 2005).
b values are interpolated from the reddening map of Schlegel et al. (1998).
c is the radial cut imposed to exclude GC stars.
d is the percentage of foreground stars predicted in the region of the CMD used to compute the MDF (through large-area realisations of the Besançon model).
e is the average metallicity calculated from the MDF (Section 3.1).
f is the metal-poor fraction, given by relative number of stars in the MDF that have ([Fe/H]-1.3 dex).
The observations were obtained with the Wide Field Channel of the HST/ACS as part of the Cycle 13 program GO 10394 (PI Tanvir). The original aim of this program was to obtain deep high resolution photometry of outer halo GCs in M31 that were discovered in the course of the the Isaac Newton Telescope and CFHT MegaCam surveys (Huxor et al., 2005; Martin et al., 2006; Huxor et al., 2008, see) and results from this analysis are reported elsewhere (Mackey et al. 2006, 2007; Tanvir et al. in prep.). In the present paper, we focus instead on the field populations imaged alongside the GCs.
Fields were observed in the HST/ACS F606W and F814W filters for and respectively, with small dithers between various sub-exposures. Full details of the photometric reduction are provided in Mackey et al. (2006). In brief, we used the ACS module of the DOLPHOT program (Dolphin, 2000) to obtain point-spread function (PSF) fitting photometry for each image. Next, quality information provided by DOLPHOT was used to clean the source catalogue of any non stellar sources such as background galaxies and blended stars. Specifically, tests showed that strong stellar detections satisfied the conditions , and signal-to-noise ratio 4. The data were further pruned according to the distribution of the magnitude error, of the PSF, and sharpness as a function of magnitude. Finally, magnitudes were transformed to the VEGAmag scale using the zero-points of Sirianni et al. (2005) and were corrected for foreground reddening by interpolating within the maps of Schlegel et al. (1998).
Thirteen GC fields were imaged in total. Two of these sample rich substructure in the inner halo of M31 and have previously been presented in Richardson et al. (2008); we will not discuss these fields further here. Extensive artificial star tests on those fields demonstrated they were complete at and . Given that they are a factor of times more crowded than fields analysed in this paper, these values serve as a lower limit to our completeness. Stars belonging to the GCs have been excluded from our analysis by masking a circular region of radius around each GC (see Table 1). This corresponds to one tidal radius () for GC10 and at least for all other clusters (Tanvir et al. in prep). Table 1 lists the location and projected radius from the centre of M31 for each pointing, as well as the reddening value derived from the Schlegel et al. (1998) maps. Field names follow the nomenclature of Mackey et al. (2006, 2007). For example, GC1F is the field population around the classical globular cluster GC1, and EC2F is the field population associated with extended globular cluster EC2.
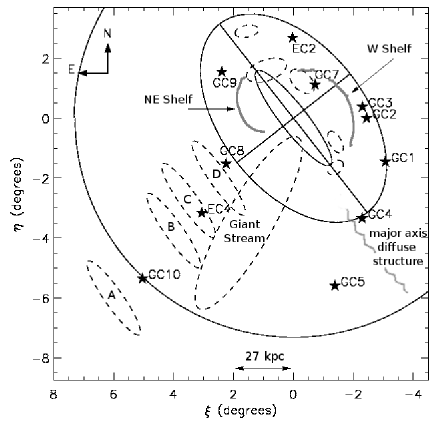
Figure 1 shows the locations of the GC fields around M31. All but one of the fields probe what we will refer to as the outer halo () of M31. This boundary marks a key transition point in the radial surface brightness profile of the galaxy where the behaviour switches from a steep inner fall-off (often described with an R1/4 law) to a shallower power-law form (Irwin et al. 2005, Ibata et al. 2007; hereafter I07). Using the extended disk parameters of PA and from Ibata et al. (2005), the field locations analysed here correspond to de-projected radii of which makes it highly unlikely that they contain any substantial disk component.
3 Analysis
3.1 Colour-Magnitude Diagrams (CMDs)
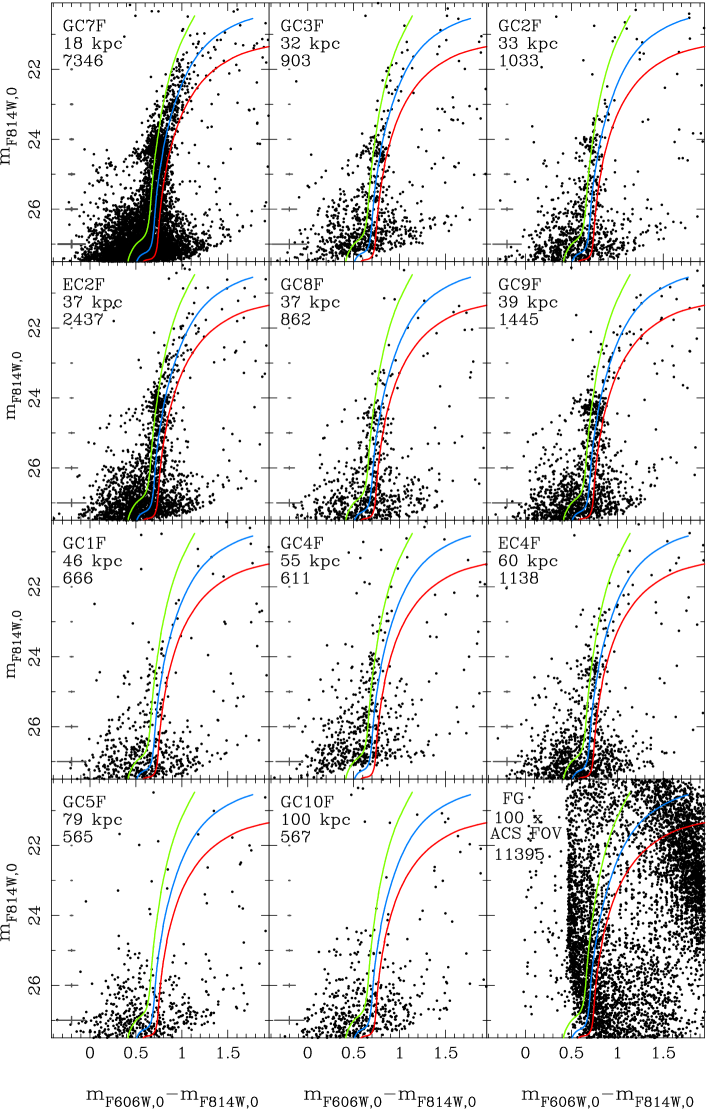
Figure 2 shows the CMDs plotted in order of increasing projected galactocentric radius. The average photometric errors returned by DOLPHOT are indicated towards the left hand side of the panels. Theoretical isochrones of [Fe/H]= dex for [/Fe] and age have been obtained from the Dartmouth Stellar Evolution Database (DSED; Dotter et al. 2007) and are superimposed. They have been shifted to the distance modulus of M31 (; McConnachie et al. 2005).
The CMDs range from being well-populated ( stars at R = 18 kpc) to being very sparse ( stars at R kpc). As a result, it is prudent to first consider the level of contamination that might be present from the foreground Milky Way (MW) population. Since our fields span almost 10 degrees in Galactic latitude, the foreground population towards each field is expected to vary substantially depending on the proximity of the line-of-sight to the Galactic Plane. We have used the Besançon Galactic model (Robin et al., 2003) to obtain large area realisations (100 larger than the ACS field of view) of the foreground population towards each field which we subsequently scale down to the size of an ACS pointing in order to reduce the shot noise in a given simulation. The error function measured in each field was fed into the model and the results were de-reddened in the same way as the data. We find the number of foreground stars predicted to lie in the region of the CMD used to derive the MDFs (§ 3.2) is less than or equal to in all but the two outermost fields (see in Table 1). Furthermore, we find that the colour and magnitude distribution of foreground stars is unlike that of our observed CMDs. The bottom right-hand panel of Figure 2 shows the CMD of a large area realisation of the Besançon model towards a representative field (GC2F) for increased resolution. This CMD contains two orders of magnitude more stars than are predicted to fall within a single ACS field and is intended as a comparison only. The CMD of the foreground clearly does not reproduce any of the distinct features observed in the GC fields, such as the red clump at , , nor does it follow the curvature of the RGBs. We can therefore be confident that foreground contamination is not a major issue for most of our fields.
Figure 2 shows prominent RGB sequences in all fields out to with the bulk of the stars well-bounded by the [Fe/H] = -1.5 dex and -0.2 dex isochrones. The mean RGB loci are consistent with a moderately high metallicity of [Fe/H] although one field, GC4F, appears more metal poor with most stars lying between the [Fe/H] and dex isochrones. The widths of the RGBs are considerably larger than the photometric error bars for magnitudes brighter than suggesting an intrinsic spread in metallicity. It is worth considering whether line-of-sight effects could artificially create this width. In overlaying the isochrones, we have assumed that the stars in each field all lie at the systemic distance of M31, whereas in reality they will span a range of line-of-sight distances. We checked the effect a distance spread would have on the CMDs by plotting isochrones with varying distance moduli and measuring the resulting colour width. In the extreme case of shifting the dex isochrone to lie in front (behind) M31, this induced a colour broadening of mag at mag and mag at mag. This accounts for less than and of the width of the RGB at those magnitudes respectively and implies the RGB spreads are for the most part intrinsic.
A red clump (RC) due to core helium burning stars is detected in most fields with a well-populated RGB (GC7F, GC3F, GC2F, EC2F, GC9F, EC4F) and indicates the presence of an intermediate age and/or metal-rich population (Girardi & Salaris, 2001). There is a tentative detection of an old, metal-poor extended horizontal branch (HB) in a few fields (e.g. GC7F, GC3F, EC2F, GC9F) which can be traced from mag, mag to mag, mag. This feature may also be present in GC8F and EC4F but there are too few stars detected to be certain. Indeed, the sparseness of most of the CMDs makes it impossible to do comparative analyses of the RC/HB morphologies in different fields, as was done in Richardson et al. (2008).
Figure 2 also highlights the presence of star count (i.e. surface brightness) and stellar population inhomogeneities throughout the halo. For example, EC2F, GC8F and GC9F lie in the projected radial range of yet their total star counts fluctuate by a factor of three ( and respectively) indicating genuine variations larger than the Poisson uncertainties. Furthermore, EC4F and GC4F lie in the projected radial interval , however EC4F exhibits a wider RGB than GC4F. The former also contains twice as many stars () as GC1F (), a field which lies 15 kpc further in. Since the fields have a uniform depth and completeness these patterns indicate the that they do not probe a smooth well-mixed stellar component of M31.
Although we detect stars in fields GC5F () and GC10F (), the CMDs are too sparsely populated to reliably constrain their stellar populations. Most of the sources in these CMDs cluster around the base of the RGB sequences and while at least some of them will be genuine RGB stars (note that in the more populated fields, the density of stars with scales with the RGB and RC), there will also be a high contribution from unresolved background galaxies and foreground stars. Without knowledge of the true background populations along these sight-lines, it is impossible to disentangle these different components at faint magnitudes ( mag).
3.2 Metallicity Distribution Functions (MDFs)
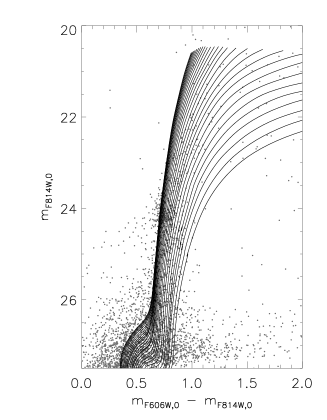
In order to further characterise the stellar populations in each field, we determine the MDFs using a set of theoretical isochrones from the DSED (Dotter et al. 2007) with age 10 Gyr and a Solar-scaled abundance mixture. Figure 3 shows the RGB sequences of the selected isochrones shifted to the distance of M31 and overlaid onto the photometry of EC2F. We have selected isochrones which form a finely-spaced grid ranging from [Fe/H] dex to dex in [Fe/H] dex steps. With such sampling, the metallicities of RGB stars can simply be derived by comparing their , values to the isochrone grid and assigning the metallicity of the closest isochrone.
In order to minimise contamination, the MDFs are computed from RGB stars selected within the range , and sandwiched between the -2.5 and +0.3 dex isochrones. By selecting stars brighter than mag, we limit the influence of unresolved background sources and ensure a minimum completeness rate of . This lower magnitude limit marks the ‘knee’ in the luminosity function of the co-added fields beyond which the source count rises very rapidly. The upper cut-off of mag minimises the inclusion of bright asymptotic giant branch (AGB) stars and the colour cut () avoids areas where the density of stars on the CMD is very small and therefore liable to increased influence from the MW foreground. An additional area () was cut to exclude the RC region. Although RGB stars fainter than the RC have less metallicity sensitivity than their brighter counterparts, they represent the bulk of the RGB populations in these sparse fields and are essential for providing a sufficient sample of stars. We have verified that our results do not change significantly if we only use stars exclusively above or below the RC.
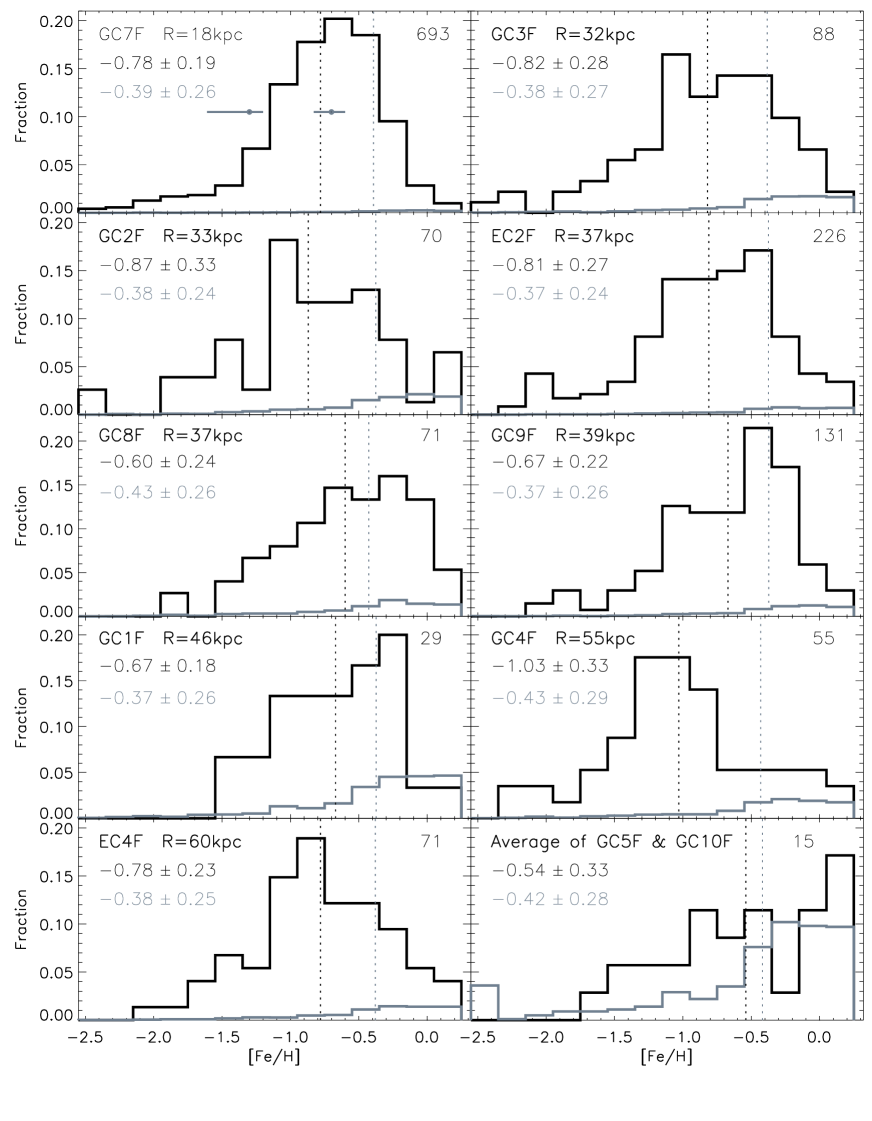
We present the resultant MDFs of the fields in Figure 4 (solid black lines). The average metallicity and standard deviation of each field are quoted in the panels and marked on the MDF by a black dashed line (see also Table 1). Out to , the MDFs are generally characterised by broad distributions which peak at intermediate metallicities , confirming inferences from visual inspection of the CMDs alone. We reiterate that some of the metallicity spread might be due to photometric errors and line-of-sight depth but these will not dominate (see the top panel of Figure 4). Averaging over GC fields in the 30–60 kpc range, the mean stellar metallicity is found to be . As previously mentioned, there is no significant RGB detected in GC5F and GC10F and hence we are unable to compute individual MDFs for these fields. However, they provide a useful probe of the contamination’ in our MDF selection box from non-M31 sources, namely unresolved background galaxies and foreground dwarf stars. The bottom left-hand plot shows the MDF derived for the average of the GC5F and GC10F fields.
Also shown in Figure 4 are solid grey lines representing MDFs for the MW foreground towards each field as predicted by the Besançon Galactic model (Robin et al., 2003). These are computed by taking the simulations described previously and computing an MDF in an identical manner to our GC fields. These are obviously not true representations of the metallicities of MW foreground stars since this population is dominated by dwarfs and not RGB stars on which our analysis is based. Nevertheless, this procedure provides additional insight into the degree to which the foreground might be biasing our results. The average metallicity of the foreground is listed in grey and highlighted with a grey dashed line. The foreground MDF peaks at high metallicities ([Fe/H] dex) and has a long metal poor tail, a shape which is rather different from that observed in any of the fields out to 60 kpc. Thus, foreground stars alone cannot explain the observed form of the MDFs with their strong peaks at intermediate metallicities (although the foreground could explain a large fraction of the Solar metallicity stars observed). We examined the impact of subtracting the MW foreground MDFs from each field and found it to be minimal. The average metallicities decreased by only dex in all fields except for GC1F, which became 0.08 dex more metal-poor, while the metallicity dispersions remained essentially unchanged.
| Age | ||
|---|---|---|
| (Gyr) | (dex) | (dex) |
| 12 | 0.0 | -0.01 |
| 10 | 0.0 | 0.00 |
| 10 | 0.2 | -0.04 |
| 8 | 0.0 | +0.02 |
| 6 | 0.0 | +0.05 |
The shape of the average MDF of the GC5FGC10F fields and the Bescançon model prediction are generally in good agreement which suggests a large fraction of the contamination in the MDFs is due to foreground stars. To test this further we performed a two-sided Kolmogorov-Smirnov (KS) test and found a high probability (P = 0.95) that the MDFs of GC5FGC10F and the Besançon foreground are drawn from the same parent distribution. Note that this is true only for bright stars which were incorporated into the MDFs. At magnitudes fainter than GC5F and GC10F suffer additional contamination from unresolved background galaxies. The surplus of stars at [Fe/H] dex here may be a mixture of bright unresolved background sources and true metal-poor M31 halo stars, or else it may highlight a slight normalisation problem with the Galactic model.
Many of the MDFs contain stars with metallicities reaching as low as dex (this being the lower limit considered in our MDF derivation). Interestingly, the fraction of metal-poor () stars () is relatively invariant from field to field at although one field, GC4F at , has a slightly larger metal-poor fraction (see Table 1). Since it is possible that some of this population could be due to AGB stars on the blue edge of the RGB, this number provides an upper limit to the fraction of metal-poor halo stars sampled by our fields.
In deriving the MDFs, we have made the simplifying assumption that the stellar populations are uniformly 10 Gyr old. The benefit of choosing an old age to compute an MDF is that the position of an old star within the RGB is mostly determined by its metallicity and largely insensitive to its age. In reality, our fields will contain composite stellar populations with varying age and metallicity (e.g., Brown et al., 2008). We have examined the effect of a straight scaling of the age and alpha-enhancement of the isochrones on the derived MDF (Table 2). Specifically, we reconstructed the MDF of each field exactly as before but with a new set of isochrones as described in Table 2. The mean shift in average metallicity () was calculated from the resulting MDFs of all fields. When isochrones of 6 Gyr are used, there is only a modest +0.05 dex increase in the average metallicity. On the other hand, increasing to +0.2 has the effect of shifting the mean metallicity by -0.04 dex. While the assumption of a fixed age and alpha-enhancement will undoubtedly introduce uncertainties into our results, we do not believe that these will be significant.
4 Discussion
Our analysis of the stellar populations in the vicinity of M31 outer halo GCs indicates a field-to-field variation in the mean metallicity of to dex with a typical dispersion of 0.2–0.3 dex. These relatively high metallicities are supported by both CMD morphologies (e.g. mean RGB colours and the presence of prominent RCs) as well as the MDFs. The average metallicity over the range 30–60 kpc is [Fe/H] dex, with no evidence for a significant radial gradient.
Our findings for the M31 outer halo are in good agreement with expectations from models in which stellar halos are built predominantly from satellite accretion (Font et al., 2006, 2008; De Lucia & Helmi, 2008). These models predict stellar halos to be highly structured in their outskirts with discrete substructures becoming increasingly dominant at large radius, an effect mostly driven by the long mixing times in these parts (e.g., Johnston et al., 2008). While the pencil beam observations discussed here cannot test how the fraction of substructure increases with radius, the field-to-field variations we observe in RGB star counts provide good support for the notion that the outer regions are poorly mixed in terms of stellar density.
4.1 Connections to Known Substructures
Even though our fields were selected purely on the basis of their encompassing a luminous outer halo GC, Figure 1 reveals that a good fraction of them lie on, or near, discrete substructures identified in the CFHT MegaCam survey. This is intriguing but perhaps not completely surprising given that a significant fraction of the halo luminosity out to 60 kpc resides in such structures, which have a large covering area on the sky (I07). GC7F, GC3F and GC2F are situated in reasonable proximity to the diffuse Western shelf and GC9F is near to the North-Eastern Shelf. Both of these substructures are most likely comprised of debris stripped from the metal-rich giant stream progenitor (Fardal et al., 2007; Richardson et al., 2008). GC8F is located in close proximity to the minor axis transverse Stream D, while EC4F probes Stream C. Chapman et al. (2008) have recently found a bimodal spectroscopic metallicity distribution for Stream C with peaks at [Fe/H]= and [Fe/H]= dex. Our MDF for EC4F also supports a bimodal distribution with peaks at [Fe/H]= and [Fe/H]= dex, in good agreement. Fardal et al. (2008) have shown it is plausible that many of these outer halo features originate from the same event, namely the accretion of the (metal-rich) giant stream progenitor. Alternatively, even if the outer halo debris originates from several different accretion events, the spatial coherence and moderately high surface brightness of the streams imply that the progenitors were of intermediate mass and hence metallicity (Font et al., 2008).
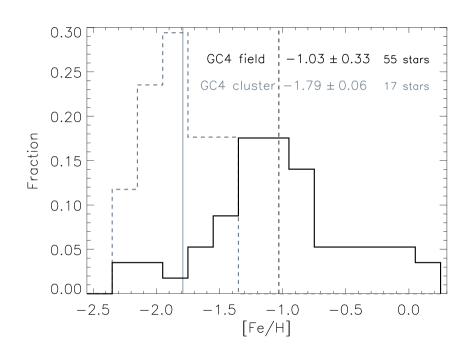
The most metal-poor population identified in our study is GC4F. This field probes the ‘major axis diffuse structure’ discovered by I07, who find a metallicity of [Fe/H]= dex from the colour of the RGB. Our MDF shows a dominant peak at [Fe/H] dex in this structure, which is in reasonable agreement. GC4 has been recently shown to have a population of extra-tidal stars (Federici et al. 2007; Tanvir et al. in prep.). In deriving the GC4F MDF we have taken measures to avoid contamination by this population by masking out the cluster to twice its tidal radius (; Tanvir et al. in prep.) but it is worthwhile considering whether this has been sufficient. In Figure 5 we compare the MDFs of the field and cluster populations where the latter are defined as stars lying within 3 half-light radii (where ; Tanvir et al. in prep.). It can be clearly seen that the cluster and field star MDFs are very different. The cluster MDF shows a dominant peak at [Fe/H] dex and an average metallicity of dex. This is in excellent agreement with the independently derived mean metallicities of [Fe/H]= to dex reported in the literature (Galleti et al., 2005, 2006; Mackey et al., 2007). The more enriched field population ( dex) therefore cannot be due to extra-tidal cluster stars, though some of the metal-poor tail could be. This lends credence to the major axis structure being a genuinely more metal-poor feature that is distinct in origin from the giant stream debris.
4.2 Radial Metallicity Trends
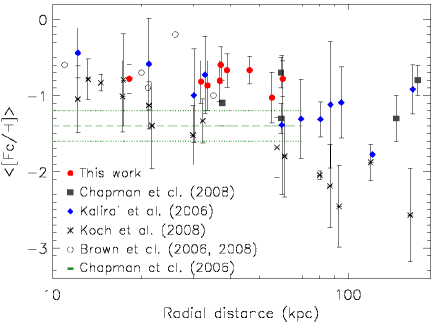
In Figure 6 we present the radial metallicity distribution of M31’s outer halo as derived in this study and compare it to results in the literature. We include here the spectroscopic studies of Chapman et al. (2008), Kalirai et al. (2006), Koch et al. (2008) and Chapman et al. (2006) as well as the photometric studies by Brown et al. (2006, 2008). It is important to note that all the spectroscopic studies invoke some degree of kinematic selection to isolate the sample of halo stars which will somewhat complicate the comparison of their results to those from purely photometric work. Additionally, the metallicities from Brown et al. (2006, 2008) represent average values derived from star formation history fits to the main sequence turn-off in ultra-deep HST CMDs, a method rather different from that which we have employed for our photometric metallicity derivation.
Figure 6 shows that the metallicities we infer in our fields agree well with most other studies which have probed a similar radial range although there is considerable dispersion at all radii. This dispersion may be due to different methods of sample selection and metallicity determination or to intrinsic metallicity variations in stellar populations throughout the halo. In support of the last point we highlight the 1 dex spread in metallicity at where two separate streams (one metal-rich and one metal-poor - see Chapman et al. 2008) are probed.
Despite the general concordance between our results and those in the literature, our measurements are systematically more metal-rich than the spectroscopic metallicities measured by Chapman et al. (2006) and Koch et al. (2008). The discrepancy with Chapman et al. (2006) may be due to the different sample selection; in their analysis, they windowed out any stellar component that rotates within 100 km s-1 of the thin disk over the radial range . The discrepancy with Koch et al. (2008) is more puzzling. These authors have re-analysed much of the same data as Kalirai et al. (2006) using a similar halo sample selection method, but a different method of metallicity determination, and find a strong metallicity gradient which reaches [Fe/H] dex at kpc. It is hard to reconcile such a metal-poor population with the CMD morphology and MDF form that we have observed in our outer halo GC fields.
Considered together, the results plotted in Figure 6 suggest that much of the inner 60 kpc of M31’s stellar halo is dominated by relatively metal-rich populations (). This situation appears vastly different from that in the Milky Way. Carollo et al. (2007) have recently derived metallicities for 1,235 blue horizontal branch stars in the Galactic halo lying in the radial range 5–80 kpc and find the population gets progressively more metal poor with radius, with the dominant population at R kpc having . While the halos of the Milky Way and M31 have been known for some time to differ in their metallicities at smaller radii, this is the first clear demonstration that these differences remain out to significant radii. Unfortunately, few constraints exist on the detailed nature of the M31 stellar populations beyond 80 kpc where very metal-poor populations were hinted at by the ground-based analysis of I07. It may be that only in these parts of M31 a metal poor stellar halo prevails.
Finally, it is worth considering the possibility that by examining the fields surrounding luminous GCs at large radii we have introduced a selection bias. The outer halo GCs targeted in the current study comprise 11 out of the 40 (%) we have identified in this particular quadrant (Huxor et al., 2008). These objects were chosen for high resolution imagery with HST based based on the fact that they were known at the time of proposal writing and span a broad range of projected galactocentric radii; there are no signs that they are unusual compared to other M31 halo GCs. Within the Milky Way, at least eight GCs have been possibly associated with the disrupting Sgr dwarf galaxy, accounting for of all GCs at (Bellazzini et al., 2003). This raises the question as to whether GCs at large galacto-centric radii are preferentially associated with halo tidal stream debris, an intriguing idea which we will explore more in future work.
5 Summary
We have presented high precision photometry of the stellar populations adjacent to 11 luminous outer halo GCs in M31 using HST/ACS data. Our fields sample the extended halo in the radial range and reach a photometric depth of magnitudes below the horizontal branch (m mag). Eight pointings lie at and provide the first detailed view of the properties of halo stars in these remote parts.
The colour-magnitude diagrams (CMDs) are well populated out to and exhibit relatively metal-rich red giant branches, with the densest fields also showing evidence for prominent red clumps. Using the Dartmouth isochrones, we have constructed MDFs which confirm the presence of dominant populations with to dex and considerable internal metallicity dispersions of 0.2 to 0.3 dex (assuming a 10 Gyr population and scaled-Solar abundances). The average metallicity over the range 30–60 kpc is [Fe/H] dex, with no evidence for a significant radial gradient. Although some metal-poor stars ([Fe/H]) are present in each field, they amount to typically of the total population, irrespective of radius.
Significant inhomogeneities are present in the fields in terms of both random fluctuations in star counts and field-to-field variations in metallicity supporting the notion that the stellar populations are not well-mixed beyond 30 kpc, in agreement with results from wide-field surveys and predictions of models in which stellar halos assemble predominantly from satellite accretion. Our photometric metallicity measurements are in good agreement with most, but not all, spectroscopic studies of M31’s outer halo. Assuming that our GC fields are unbiased probes of the dominant stellar populations in these parts, we find that the M31 outer halo remains considerably more metal-rich than that of the Milky Way out to at least 60 kpc.
Acknowledgements
JCR acknowledges the award of an STFC studentship. AMNF, ADM and AH acknowledge support from a Marie Curie Excellence Grant from the European Commission under contract MCEXT-CT-2005-025869. NRT acknowledges financial support from a STFC Senior Research Fellowship. We thank Jay Gallagher, Alan McConnachie and the anonymous referee for helpful suggestions and Jasonjot Kalirai and Andreas Koch for providing data for use in Figure 6.
References
- Bellazzini et al. (2003) Bellazzini M., Ferraro F. R., Ibata R., 2003, \aj, 125, 188
- Brown et al. (2008) Brown T. M., Beaton R., Chiba M., Ferguson H. C., Gilbert K. M., Guhathakurta P., Iye M., Kalirai J. S., Koch A., Komiyama Y., Majewski S. R., Reitzel D. B., Renzini A., Rich R. M., Smith E., Sweigart A. V., Tanaka M., 2008, \apjl, 685, L121
- Brown et al. (2006) Brown T. M., Smith E., Ferguson H. C., Rich R. M., Guhathakurta P., Renzini A., Sweigart A. V., Kimble R. A., 2006, \apj, 652, 323
- Bullock & Johnston (2005) Bullock J. S., Johnston K. V., 2005, \apj, 635, 931
- Carollo et al. (2007) Carollo D., Beers T. C., Lee Y. S., Chiba M., Norris J. E., Wilhelm R., Sivarani T., Marsteller B., Munn J. A., Bailer-Jones C. A. L., Fiorentin P. R., York D. G., 2007, \nat, 450, 1020
- Chapman et al. (2008) Chapman S. C., Ibata R., Irwin M., Koch A., Letarte B., Martin N., Collins M., Lewis G. F., McConnachie A., Peñarrubia J., Rich R. M., Trethewey D., Ferguson A., Huxor A., Tanvir N., 2008, \mnras, 390, 1437
- Chapman et al. (2006) Chapman S. C., Ibata R., Lewis G. F., Ferguson A. M. N., Irwin M., McConnachie A., Tanvir N., 2006, \apj, 653, 255
- De Lucia & Helmi (2008) De Lucia G., Helmi A., 2008, ArXiv e-prints
- Dolphin (2000) Dolphin A. E., 2000, \pasp, 112, 1383
- Dotter et al. (2007) Dotter A., Chaboyer B., Jevremović D., Baron E., Ferguson J. W., Sarajedini A., Anderson J., 2007, \aj, 134, 376
- Eggen et al. (1962) Eggen O. J., Lynden-Bell D., Sandage A. R., 1962, \apj, 136, 748
- Fardal et al. (2008) Fardal M. A., Babul A., Guhathakurta P., Gilbert K. M., Dodge C., 2008, \apjl, 682, L33
- Fardal et al. (2007) Fardal M. A., Guhathakurta P., Babul A., McConnachie A. W., 2007, \mnras, 380, 15
- Faria et al. (2007) Faria D., Johnson R. A., Ferguson A. M. N., Irwin M. J., Ibata R. A., Johnston K. V., Lewis G. F., Tanvir N. R., 2007, \aj, 133, 1275
- Federici et al. (2007) Federici L., Bellazzini M., Galleti S., Fusi Pecci F., Buzzoni A., Parmeggiani G., 2007, \aap, 473, 429
- Ferguson et al. (2002) Ferguson A. M. N., Irwin M. J., Ibata R. A., Lewis G. F., Tanvir N. R., 2002, \aj, 124, 1452
- Ferguson et al. (2005) Ferguson A. M. N., Johnson R. A., Faria D. C., Irwin M. J., Ibata R. A., Johnston K. V., Lewis G. F., Tanvir N. R., 2005, \apjl, 622, L109
- Font et al. (2006) Font A. S., Johnston K. V., Bullock J. S., Robertson B. E., 2006, \apj, 646, 886
- Font et al. (2008) Font A. S., Johnston K. V., Ferguson A. M. N., Bullock J. S., Robertson B. E., Tumlinson J., Guhathakurta P., 2008, \apj, 673, 215
- Galleti et al. (2005) Galleti S., Bellazzini M., Federici L., Fusi Pecci F., 2005, \aap, 436, 535
- Galleti et al. (2006) Galleti S., Federici L., Bellazzini M., Buzzoni A., Pecci F. F., 2006, \apjl, 650, L107
- Gilbert et al. (2007) Gilbert K. M., Fardal M., Kalirai J. S., Guhathakurta P., Geha M. C., Isler J., Majewski S. R., Ostheimer J. C., Patterson R. J., Reitzel D. B., Kirby E., Cooper M. C., 2007, \apj, 668, 245
- Girardi & Salaris (2001) Girardi L., Salaris M., 2001, \mnras, 323, 109
- Huxor et al. (2008) Huxor A. P., Tanvir N. R., Ferguson A. M. N., Irwin M. J., Ibata R., Bridges T., Lewis G. F., 2008, \mnras, 385, 1989
- Huxor et al. (2005) Huxor A. P., Tanvir N. R., Irwin M. J., Ibata R., Collett J. L., Ferguson A. M. N., Bridges T., Lewis G. F., 2005, \mnras, 360, 1007
- Ibata et al. (2004) Ibata R., Chapman S., Ferguson A. M. N., Irwin M., Lewis G., McConnachie A., 2004, \mnras, 351, 117
- Ibata et al. (2005) Ibata R., Chapman S., Ferguson A. M. N., Lewis G., Irwin M., Tanvir N., 2005, \apj, 634, 287
- Ibata et al. (2001) Ibata R., Irwin M., Lewis G., Ferguson A. M. N., Tanvir N., 2001, \nat, 412, 49
- Ibata et al. (2007) Ibata R., Martin N. F., Irwin M., Chapman S., Ferguson A. M. N., Lewis G. F., McConnachie A. W., 2007, \apj, 671, 1591
- Irwin et al. (2005) Irwin M. J., Ferguson A. M. N., Ibata R. A., Lewis G. F., Tanvir N. R., 2005, \apjl, 628, L105
- Johnston et al. (2008) Johnston K. V., Bullock J. S., Sharma S., Font A., Robertson B. E., Leitner S. N., 2008, ArXiv e-prints
- Johnston et al. (1996) Johnston K. V., Hernquist L., Bolte M., 1996, \apj, 465, 278
- Kalirai et al. (2006) Kalirai J. S., Gilbert K. M., Guhathakurta P., Majewski S. R., Ostheimer J. C., Rich R. M., Cooper M. C., Reitzel D. B., Patterson R. J., 2006, \apj, 648, 389
- Koch et al. (2008) Koch A., Rich R. M., Reitzel D. B., Martin N. F., Ibata R. A., Chapman S. C., Majewski S. R., Mori M., Loh Y.-S., Ostheimer J. C., Tanaka M., 2008, \apj, 689, 958
- Mackey et al. (2006) Mackey A. D., Huxor A., Ferguson A. M. N., Tanvir N. R., Irwin M., Ibata R., Bridges T., Johnson R. A., Lewis G., 2006, \apjl, 653, L105
- Mackey et al. (2007) Mackey A. D., Huxor A., Ferguson A. M. N., Tanvir N. R., Irwin M., Ibata R., Bridges T., Johnson R. A., Lewis G., 2007, \apjl, 655, L85
- Martin et al. (2006) Martin N. F., Ibata R. A., Irwin M. J., Chapman S., Lewis G. F., Ferguson A. M. N., Tanvir N., McConnachie A. W., 2006, \mnras, 371, 1983
- McConnachie et al. (2008) McConnachie A. W., Huxor A., Martin N. F., Irwin M. J., Chapman S. C., Fahlman G., Ferguson A. M. N., Ibata R. A., Lewis G. F., Richer H., Tanvir N. R., 2008, \apj, 688, 1009
- McConnachie et al. (2005) McConnachie A. W., Irwin M. J., Ferguson A. M. N., Ibata R. A., Lewis G. F., Tanvir N., 2005, \mnras, 356, 979
- Richardson et al. (2008) Richardson J. C., Ferguson A. M. N., Johnson R. A., Irwin M. J., Tanvir N. R., Faria D. C., Ibata R. A., Johnston K. V., Lewis G. F., McConnachie A. W., Chapman S. C., 2008, \aj, 135, 1998
- Robin et al. (2003) Robin A. C., Reylé C., Derrière S., Picaud S., 2003, \aap, 409, 523
- Schlegel et al. (1998) Schlegel D. J., Finkbeiner D. P., Davis M., 1998, \apj, 500, 525
- Searle & Zinn (1978) Searle L., Zinn R., 1978, \apj, 225, 357
- Sirianni et al. (2005) Sirianni M., Jee M. J., Benítez N., Blakeslee J. P., Martel A. R., Meurer G., Clampin M., De Marchi G., Ford H. C., Gilliland R., Hartig G. F., Illingworth G. D., Mack J., McCann W. J., 2005, \pasp, 117, 1049