SAX J1808.4-3658 : high resolution spectroscopy and decrease of pulsed fraction at low energies
Abstract
XMM-Newton observed the accreting millisecond pulsar SAX J1808.4-3658 during its 2008 outburst. We present timing and spectral analyses of this observation, in particular the first pulse profile study below 2 keV, and the high-resolution spectral analysis of this source during the outburst. Combined spectral and pulse profile analyses suggest the presence of a strong unpulsed source below 2 keV that strongly reduces the pulsed fraction and a hard pulsed component that generates markedly double peaked profiles at higher energies. We also studied the high-resolution grating spectrum of SAX J1808.4-3658, and found several absorption edges and Oxygen absorption lines with whom we infer, in a model independent way, the interstellar column densities of several elements in the direction of SAX J1808.4-3658.
keywords:
stars: pulsars: general — pulsar: individual: SAX J1808.4-36581 Introduction
The accreting millisecond X-ray pulsar (AMXP) SAX J1808.4–3658 (J1808 from now on) was the first X-ray binary found to pulsate in the millisecond range, with a spin period of 2.5 ms (Wijnands & van der Klis, 1998)). It has been observed in outburst 6 times, roughly every 2.5 years since 1996. During the outburst, the magnetic field is thought to channel part of the disc material onto the neutron star magnetic poles. The radiation emitted from the impact region (hot spot) and/or a slab of shocked material above it is then modulated at the neutron star spin period. This radiation is observed as pulsed emission that adds to the unpulsed emission coming from the accretion disc. A possible comptonizing medium surrounding the impact region can upscatter part of the radiation to higher energies (Poutanen & Gierliński, 2003). The pulsations and the X-ray spectrum were observed during previous outbursts by RXTE and a first study of the 1998 outburst was performed using those data (Poutanen & Gierliński 2003, Ibragimov & Poutanen 2008). J1808 was never observed below 2 keV during an outburst (except in the 2000 and 2005 outbursts at very low luminosity levels, see Wijnands 2003 and Campana et al. 2008). This energy range is important to understand the pulse formation mechanism, because it is here that both the hot spot and the accretion disc thermal emissions are expected to peak. Also, many absorption lines from the interstellar medium are expected in this energy range. These lines are important to definitively determine the interstellar column density toward the source. Broadband spectral analyses of this XMM observation were reported by Papitto et al. (2009) and Cackett et al. (2009), who both focused on the study of the iron line emission at 6–7 keV. Here we present the first simultaneous spectral and timing analysis of the pulsations of J1808 as observed with XMM-Newton during the 2008 outburst, with a particular attention to the lower energy range ( keV).
2 X-ray observation
J1808 was observed in outburst with XMM–Newton on 2008 October 1st (MJD 54740), for 63 ks of on–source exposure time. At the time of this observation, J1808 was at the beginning of the exponential decay stage of the outburst, with a relatively high flux level (see Hartman et al. 2009 for a description of the overall outburst lightcurve). The XMM–Newton Observatory (Jansen et al., 2001) includes three 1500 cm2 X-ray telescopes with the European Photon Imaging Camera (EPIC), and a Reflecting Grating Spectrometer (RGS; den Herder et al. 2001). An Optical Monitor is also present (Mason et al. 2001). It is used to follow optical counterparts and will not be considered in this work. The EPIC camera is composed of two MOS CCDs (Turner et al., 2001) and a pn CCD (Strüder et al., 2001). Each EPIC camera has a fixed, mode dependent frame read-out frequency, producing event lists in the 0.1-12 keV energy range. The RGS, is composed of a double array of gratings and produces high resolution spectra in the 0.33 to 2.5 keV energy range.
Data have been processed using SAS version 8.0.1, and we have employed the most recent calibration files (CCF) available at the time the reduction was performed (February 2009). Standard data screening criteria were applied in the extraction of scientific products. After removing solar flares and telemetry dropouts the net pn exposure time is 41 ks. The central CCD of MOS1 was operated in full frame mode with thin filters, and is heavily piled–up. For this reason we do not consider the MOS1 data any further. The MOS2 was operated in timing window mode, and is also excluded from our analysis since the 1.5 ms time resolution is insufficient to study the pulsations, and its spectral capabilities for very bright sources are not as much calibrated as the pn camera. The pn camera was operating in timing mode (with a thin filter),in order to reduce pile–up and allow the high precision timing analysis required for an accreting millisecond X-ray pulsar (AMXP). We extracted the source photons from the pn with RAWX coordinates 26-49. The background is obtained from a region of the same size, at RAWX 2-25. Only photons with PATTERN were used. The extracted spectrum was rebinned before fitting to obtain at least 100 counts per bin and the pn energy resolution was not oversampled by more than a factor three. We also extracted first and second order RGS1 and RGS2 spectra, using the standard procedure reported in the XMM–Newton analysis manual, and again we ensured to have at least 100 counts per spectral bin in any RGS spectrum.
3 Timing analysis
We have first corrected the event times to the barycenter of the Solar System (using the SAS tool barycen, and the optical position given in Hartman et al. 2008) and then we applied the 2008 outburst timing solution published in Hartman et al. (2009) in order to predict the phases of each photon detected and reconstruct the pulse profiles (see Patruno et al. 2009 for a detailed explanation of the timing technique). For the timing analysis we use events in the 0.3–12 keV energy range. The pulse profiles are built by folding data segments of length s for the pulse phase analysis. This length is chosen to guarantee sufficiently high signal-to-noise profiles even if the pulsed fractions are small. The pulses are then decomposed by fitting two harmonics with frequency fixed at the pulse frequency (fundamental, ) and twice the pulse frequency (second harmonic, ) plus a constant representing the non-pulsed emission.
We did not attempt to calculate a new timing solution since the precision of the solution achievable with the short observation baseline of XMM is at least an order of magnitude lower than what was obtained with the RXTE data (Hartman et al., 2009). The short baseline of the observation is also insufficient to model the timing noise that affects the pulse phases and that was extensively discussed in Hartman et al. (2008, 2009) for J1808. If timing noise is present, a systematic error is introduced in the determination of the pulse phases and spin frequency (Patruno et al., 2009).
Therefore we decided to subtract the solution reported in Hartman et al. (2009) and obtain the phase residuals with respect to that constant pulse frequency plus Keplerian circular orbit model. The pulse phase residuals of the fundamental drift by cycles during the observation. We also found a correlation between these pulse phase residuals and the 0.3-12 keV X-ray flux. We fitted the data with a linear relation that gives a of 11.4 for 10 degrees of freedom, and a slope of (we quote the 1 error).
The second harmonic is significantly detected in only of the profiles, where a detection is defined as a ratio between the pulse amplitude and its statistical error larger than 3. When not detected, the second harmonic fractional amplitude upper limit was between 0.4 and 0.6 rms at the 98 confidence level. No correlation between pulse phases and flux was found for the second harmonic.
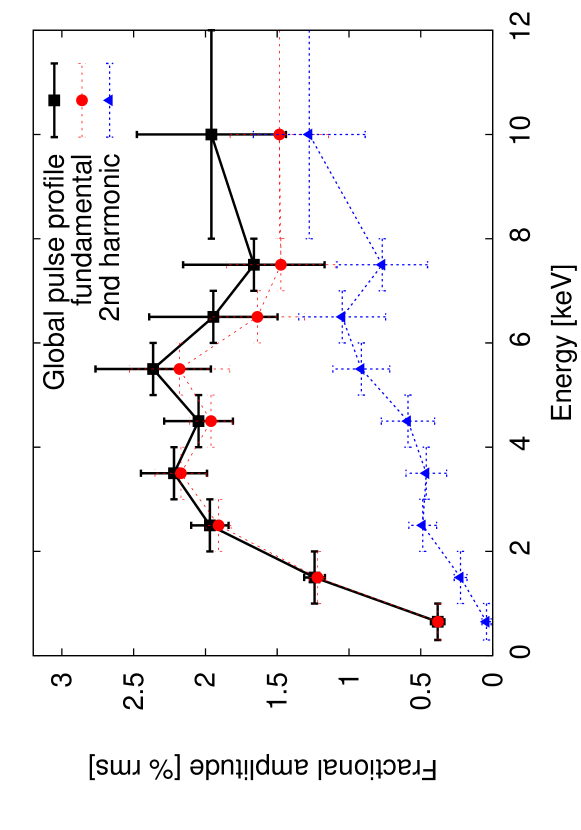
To increase the signal to noise and calculate the harmonic content of the pulsations in the whole energy band, we folded the entire 41 ks data into one single pulse profile. The fractional rms amplitude of fundamental and second harmonic in the 0.3-12 keV energy band is 0.98(2)% rms and 0.33(3)% rms respectively (1 uncertainties).
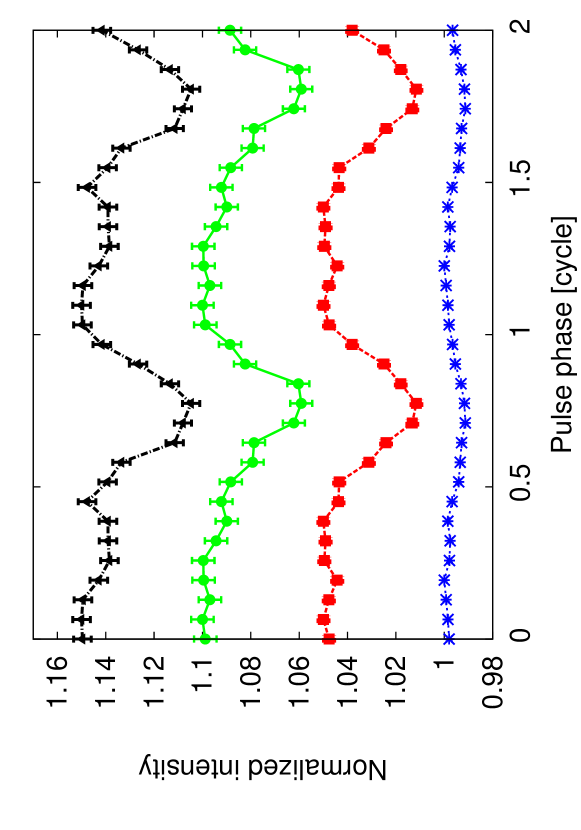
We then repeated the procedure by dividing the observations in 9 energy bands between 0.3 and 12 keV. The fractional amplitude of the pulse profile increases from 0.3 up to 3 keV, and then it remains constant within the errors up to 12 keV (Fig 1). The fundamental tracks the behaviour of the total pulse profile. The second harmonic increases monotonically in the energy range considered. At energies above keV the fractional amplitudes of the fundamental and second harmonic are comparable and the overall pulse profile is double peaked (Fig. 1, see also Hartman et al. 2009).
4 Spectral analysis
We performed spectral analysis using the EPIC-pn spectrum (extracted as reported in § 2) in the 0.6–12 keV energy range, and the RGS1 and RGS2 in the 0.4–1.8 keV energy range for the first order, and 0.7–1.8 keV for the second order. XSPEC version 11.3 was used for the spectral analysis.
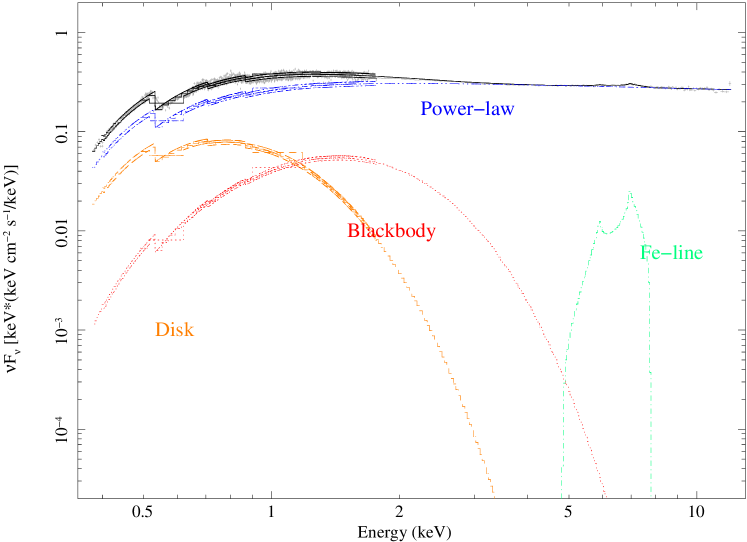
To account for relative flux calibration uncertainties between different instruments, we fitted a multiplicative constant with the model, allowing for up to 10% relative calibration flux scaling between EPIC-pn and RGS111http://xmm2.esac.esa.int/docs/documents/CAL-TN-0052-5-0.ps.gz. The relative offsets between the instruments are found to be less than 4% in all our fits. Furthermore, we included a 1.5% systematic to the errors of each spectral bin (using the relative XSPEC tool) to take into account the calibration inaccuracies of each single instrument used222http://xmm2.esac.esa.int/external/xmm_sw_cal/calib. We first used solar abundances from Anders & Grevesse (1989) and cross-sections from Balucinska-Church & McCammon (1992) for the photoelectric absorption. We tried an absorbed power-law plus a multi temperature disc and a single temperature blackbody model (phabs(diskbb + bbody + powerlaw)) as suggested in Cackett et al. (2009) and Papitto et al. (2009). The was unacceptable, mainly because of unmodelled features in the data points between 0.3–2 keV and 6–7 keV.
The 6-7 keV energy range is where fluorescence lines of Fe are expected (George & Fabian, 1991). Following Cackett et al. (2009) and Papitto et al. (2009) who claimed the detection of a broad iron line in this energy range, we fitted this feature with a diskline model (see Tab. 1). We refer to Cackett et al. (2009) and Papitto et al. (2009) for discussion of this broad iron line. To model the 0.3–2 keV features, we first tried several photoelectric cross-sections, and different element abundances. The residuals are not very sensitive to the photoelectric cross-section parameters, while they strongly depend on the assumed abundances. The best fit model, however not yet satisfactorily, was found using the Balucinska-Church & McCammon (1992) cross-sections, and the Wilms et al. (2000) abundances. The stronger low energy features in the residuals were coming from absorption and emission features close to the oxygen K-edge (-edge) at 0.543 keV. We decided to model only the continuum and the iron line as a first step, ignoring the data between 0.5-0.6 keV. This energy range and the single features it contains were then investigated separately by using the RGS data (see § 4.1, and Table 1 for the continuum and Fe line spectral results).
The two weak features at 1.8 keV and 2.2 keV are known to be due to the instrumental Si and Au K edges, not yet perfectly calibrated, especially when dealing with timing mode observations (see the EPIC calibration report in the footnote). We do not find evidence of a 0.871 keV O VII edge (reported in Papitto et al. 2009), and no other significant edges are detected in the 0.8-1 keV range.
After removing the O-Si-Au edges (0.5-0.6 and 1.6-2.3 keV), we obtain (4051 dof). Given the high quality X-ray spectrum, the relatively high value of is very likely due to inter-calibration problems between the pn and the RGS spectra, and to the calibration uncertainties of each camera which emerge when observing bright sources. In fact, when using only the pn spectrum, we obtain a statistically acceptable fit with a for 235 dof, with the same spectral parameters as reported in Tab. 1. The same model applied to the RGS alone gives a . Therefore we accept the and do not further complicate the spectral model.
4.1 High-resolution spectroscopy
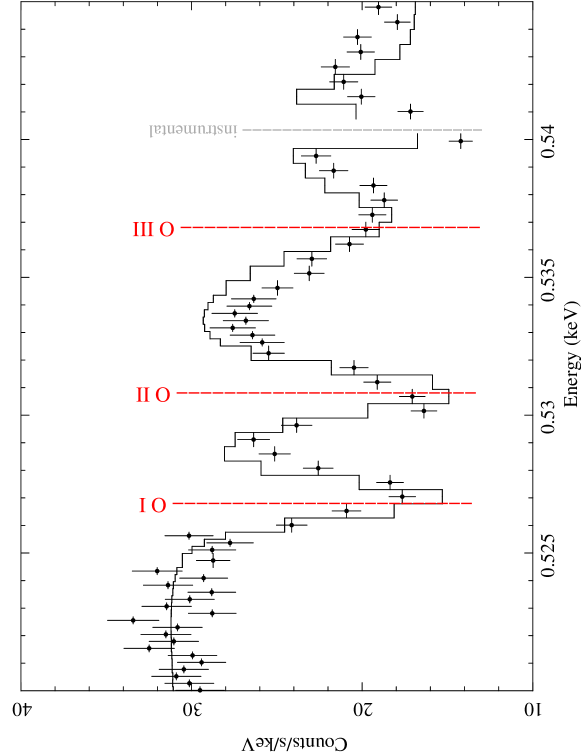
We inferred the interstellar medium (ISM) abundances in a model independent way, by separately fitting the absorption edges to the RGS data. We used only the RGS1 and RGS2 first order spectra, which are the best calibrated and have a higher number of counts. The continuum parameters were kept fixed at the value reported in Table 1. We used vphabs that allows to set fixed abundance parameters with respect to the solar composition and to isolate the single absorption edges. The strongest features were observed around the -edge (; see Fig.3). To model this edge we fixed at zero the oxygen abundance of the vphabs model, and fit only the data around the with an edge model (note that the continuum is relatively constant in the small energy range around the edge itself, hence the modelling is independent on the broadband continuum model).The best fit gives and , with and the photoelectric cross section. With the same method we fitted also the iron L (), neon K (), magnesium K () and silicon K () edges that lie in the RGS band. The column density for each element is reported in Tab.2. The absorption features close to were fitted with Gaussian lines and were identified as atomic transitions of O I, O II and O III. The O IV line lies too close to an instrumental bad column to be detectable. The levels higher than IV are not detected, with a 98% upper limit of eV on the equivalent width (EW). Similar features have been observed in other X-ray binaries like XB 1254–690 (Díaz Trigo et al., 2009) and Cyg X-2 (Takei et al. 2002; Costantini et al. 2005).
From the single absorption edges we calculated the column density of each element () assuming photoelectric cross sections from Gould & Jung (1991). The equivalent hydrogen column density is inferred from the best measured edge (), by using abundances from Wilms et al. (2000). We derived cm-2, consistent with the value derived in the direction of J1808 from both HI and HII measurements ( cm-2 and cm-2; Dickey & Lockman 1990 and Kalberla et al. 2005 respectively).
From the measurement of the EW of the oxygen I, II, and III transitions, using the method of the curve of growth, we have an independent measure of the relative oxygen abundances, using the formula , where is the wavelength of the line, and the oscillator strength for the transition (Spitzer, 1978). We found an consistent with that inferred from the -edge (see Tab. 2).
| Parameters | DiskBB+BB+PL+Diskline |
|---|---|
| NH ( cm-2) | |
| Inner Disc kT (keV) | |
| Disc flux (erg s-1cm-2) | |
| (keV) | |
| BB radius (km) | |
| BB flux (erg s-1cm-2) | |
| Photon Index | |
| PL flux (erg s-1cm-2) | |
| E (keV) | |
| EW (eV) | |
| RIN (km) | |
| ROUT (km) | |
| Incl. (deg) | |
| Fe-line flux (erg s-1cm-2) | |
| Flux (erg s-1cm-2) | |
| Absorbed Flux (erg s-1cm-2) | |
| (dof) | 1.41 (4051) |
| Edge | Energy (keV) | |||
| 5.642 | ||||
| 4.936 | ||||
| 3.523 | ||||
| 2.191 | ||||
| 1.476 | ||||
| 1s-2p | Energy (keV) | EW (eV) | ||
5 Discussion
We observed for the first time the pulsations in the 0.3-2 keV energy range for J1808. The pulse fractional amplitudes sharply decrease below keV during the 2008 XMM–Newton observation. Our spectral analysis required a multi temperature blackbody at low energies that we identify with the accretion disc emission, as well as the main source of unpulsed emission. We interpret the higher energy blackbody as the emission coming from the hot spot of the neutron star. The power law is also a pulsed component, since we measured rms pulse amplitudes up to 12 keV were the power law emission dominates.
The empirical power-law model requires a disc contributing only of the power-law flux below 2 keV (Fig 2). Therefore the disc is not the only responsible of the steep decrease of pulse fractional amplitudes below 2 keV. However, an empirical power-law model is unphysical and a self consistent physical scenario would require a sharp decrease of the power-law component below keV. In that case the unpulsed disc emission might dominate below 2 keV and explain the sudden drop of the pulse amplitudes at those energies. A Comptonization model with a shocked plasma in a slab geometry is expected to cut off below keV and was already proposed by Gierliński & Poutanen (2005) for the AMXP XTE J1751-305. The hot single temperature blackbody would then be produced by the pulsating emission of the hot spot, the multi temperature blackbody by the unpulsed radiation of the accretion disc and the hard component by the pulsed comptonized radiation of the shock around the hot spot.
The origin of the second harmonic can be related to a different pulse profile of the hard emission compared to the lower-energy blackbody as was suggested by Gierliński et al. (2002) and Poutanen & Gierliński (2003) for RXTE observations of J1808, and by Gierliński & Poutanen (2005) for XMM and RXTE observations of XTE J1751-305. This might result from a different angular distribution of the Comptonized radiation, which is expected as it is produced in the optically thin accretion shock, but not at the stellar surface as the blackbody emission.
The reason why the phase of the fundamental is correlated with the X-ray flux while the second harmonic is not, can then be related with different formation processes for the fundamental and the second harmonic. If the hot spot contributes only to the fundamental frequency while the comptonization region contributes to both the fundamental and the second harmonic, the fundamental pulse phase may track the hot spot position. The phase of the second harmonic instead will be affected by the comptonization process and might come from an extended region around the hot spot, covering a large area of the neutron star surface. The hot spot can instead come from a well defined region on the neutron star surface, and can move according to the X-ray flux fluctuations thus producing the pulse phase wandering correlated with X-ray flux (Romanova et al. 2004, Lamb et al. 2008).
We also measured the first model independent column densities of several elements in the line of sight of J1808 (Tab. 2). The most precise measurement comes from the oxygen column density, from which we could derive the equivalent hydrogen column density cm-2, assuming abundances from Wilms et al. 2000. This determination is particularly important: i) in the study of the X-ray emission of this object during quiescence and cooling, where the uncertainty in the assumed value could alter the reliability of the source intrinsic luminosity (see for example Heinke et al. 2009 for cooling studies of SAX J1808.4-3658 and Yakovlev et al. 2005 for a discussion of the problem), and ii) for optical studies who can now rely on a more precise determination of the extintion value toward this system.
It is ineresting to compare the abundances we derived from the edge fitting with the expected value for the ISM (as reported by Wilms et al. 2000). We find that in the direction of J1808, the Ne/O abundance is 0.23, slightly larger than in the ISM (), which maybe be poiting to a Ne-rich environment as observed in other low mass X-ray binaries (Juett et al. 2001).
Acknowledgments
We thank the XMM–Newton observatory for promptly assigning us an observation of SAX J1808.4-3658 through its Director’s Discretionary Time. We thank M. Diaz-Trigo, E. Costantini, A. Watts, A. Raassen and P. Casella for useful suggestions, and J.Poutanen for stimulating discussions on the pulse formation process in accreting pulsars. NR acknowledges support through an NWO Veni Fellowship.
References
- Anders & Grevesse (1989) Anders E., Grevesse N., Jan. 1989, GeCoA, 53, 197
- Balucinska-Church & McCammon (1992) Balucinska-Church M. & McCammon D., 1992, ApJ, 400, 699
- Cackett et al. (2009) Cackett, E. M., Altamirano, D., Patruno, A., Miller, J. M., Reynolds, M., Linares, M., & Wijnands, R. 2009, ApJ accepted
- Campana et al. (2008) Campana, S., Stella, L., & Kennea, J. A. 2008, ApJL, 684, L99
- Costantini et al. (2005) Costantini E., Freyberg M.J., Predehl P., 2005, A&A, 444, 187
- Cui et al. (1998) Cui W., Morgan E.H., Titarchuk L.G., 1998, ApJL, 504, L27+
- Díaz Trigo et al. (2009) Díaz Trigo M., Parmar A.N., et al., 2009, A&A, 493, 145
- Dickey & Lockman (1990) Dickey J.M., Lockman F.J., 1990, ARA&A, 28, 215
- George & Fabian (1991) George, I. M., & Fabian, A. C. 1991, MNRAS, 249, 352
- Gierliński & Poutanen (2005) Gierliński M., Poutanen J., 2005, MNRAS, 359, 1261
- Gierliński et al. (2002) Gierliński M., Done C., Barret D., 2002, MNRAS, 331, 141
- Gould & Jung (1991) Gould R.J., Jung Y.D., 1991, ApJ, 373, 271
- Hartman et al. (2008) Hartman J.M., Patruno A., et al., 2008, ApJ, 675, 1468
- Hartman et al. (2009) Hartman J.M., Patruno A., et al., 2009, ApJ, submitted
- den Herder et al. (2001) den Herder, J. W., et al. 2001, A&A, 365, L7
- Heinke et al. (2009) Heinke, C. O., Jonker, P. G., Wijnands, R., Deloye, C. J., & Taam, R. E. 2009, ApJ, 691, 1035
- Kalberla et al. (2005) Kalberla P.M.W. et al., 2005, A&A, 440, 775
- Ibragimov & Poutanen (2008) Ibragimov, A., & Poutanen, J. 2008, arXiv:0901.0073
- Jansen et al. (2001) Jansen, F., et al. 2001, A&A, 365, L1
- Juett et al. (2001) Juett, F., et al. 2001, A&A, 560, L59
- Lamb et al. (2008) Lamb, F. K., Boutloukos, S., Van Wassenhove, S., Chamberlain, R. T., Lo, K. H., Clare, A., Yu, W., & Miller, M. C. 2008, arXiv:0808.4159
- Lodders (2003) Lodders K., 2003, ApJ, 591, 1220
- Mason et al. (2001) Mason, K. O., et al. 2001, A&A, 365, L36
- Papitto et al. (2009) Papitto A., di Salvo T., et al., Jan. 2009, A&A, 493, L39
- Patruno et al. (2008) Patruno A., Hartman J.M., et al., 2008, ATEL 1760, 1
- Patruno et al. (2009) Patruno A., Hartman J.M., et al., 2009, submitted to ApJ
- Poutanen & Gierliński (2003) Poutanen J., Gierliński M., Aug. 2003, MNRAS, 343, 1301
- Poutanen & Svensson (1996) Poutanen, J., & Svensson, R. 1996, ApJ, 470, 249
- Romanova et al. (2004) Romanova, M. M., Ustyugova, G. V., Koldoba, A. V., & Lovelace, R. V. E. 2004, ApJ, 610, 920
- Spitzer (1978) Spitzer L., 1978, Physical processes in the interstellar medium, New York Wiley-Interscience, 1978. 333 p.
- Strüder et al. (2001) Strüder, L., et al. 2001, A&A, 365, L18
- Takei et al. (2002) Takei Y., Fujimoto R., et al., 2002, ApJ, 581, 307
- Turner et al. (2001) Turner, M. J. L., et al. 2001, A&A, 365, L27
- Verner et al. (1996) Verner D.A., Ferland G.J., et al., 1996, ApJ, 465, 487
- Wijnands & van der Klis (1998) Wijnands, R., & van der Klis, M. 1998, Nat, 394, 344
- Wijnands (2003) Wijnands, R. 2003, ApJ, 588, 425
- Wilms et al. (2000) Wilms J., Allen A., McCray R., 2000, ApJ, 542, 914
- Yakovlev et al. (2005) Yakovlev, D. G., Gnedin, O. Y., Gusakov, M. E., Kaminker, A. D., Levenfish, K. P., & Potekhin, A. Y. 2005, Nuclear Physics A, 752, 590