Antiferromagnetism of SrFe2As2 studied by Single-Crystal 75As-NMR
Abstract
We report results of 75As nuclear magnetic resonance (NMR) experiments on a self-flux grown high-quality single crystal of SrFe2As2. The NMR spectra clearly show sharp first-order antiferromagnetic (AF) and structural transitions occurring simultaneously. The behavior in the vicinity of the transition is compared with our previous study on BaFe2As2. No significant difference was observed in the temperature dependence of the static quantities such as the AF splitting and electric quadrupole splitting. However, the results of the NMR relaxation rate revealed difference in the dynamical spin fluctuations. The stripe-type AF fluctuations in the paramagnetic state appear to be more anisotropic in BaFe2As2 than in SrFe2As2.
The relevance of antiferromagnetism to the pairing mechanism of the high-temperature cuprate superconductivity has been intensively discussed for decades. Last year, a new series of high temperature superconductors containing iron pnictide layers has been discovered[1]. Among them, the ternary compounds with ThCr2Si2 structure, Fe2As2 (=Ba, Sr, Ca; =K, Na)[2, 3, 4, 5], have particularly important features: large crystals can be grown by flux methods and the undoped parent compounds Fe2As2 are reported to become superconducting under high pressure[6, 7, 8, 9]. Thus these materials provide an opportunity to investigate evolution from the antiferromagnetic (AF) to the superconducting states without introducing disorder.
At ambient pressure Fe2As2 shows structural and AF transitions at the same temperature ( K for Sr and K for Ba[2]). The structure is tetragonal with the space group at room temperature, and turns to the orthorhombic structure below . The low-temperature phase has a commensurate stripe-type AF order[10, 11]. Because superconductivity appears when the AF transition is suppressed by substituting Sr/Ba with K or by applying pressure, it is important to clarify the nature of AF fluctuations in the parent compounds. Previously, we have performed 75As nuclear magnetic resonance (NMR) experiments on a self-flux grown single crystal of BaFe2As2[12]. The results of the spin-lattice relaxation rate indicate development of anisotropic spin fluctuations of stripe-type in the paramagnetic state. In this letter, we report the 75As-NMR experiments on a self-flux grown high-quality single crystal of SrFe2As2, which is another member of the ternary series. We discuss different behavior of AF fluctuations between BaFe2As2 and SrFe2As2.
The single crystals of SrFe2As2 were prepared by the self-flux method. The starting elements were mixed in a alumina crucible with the ratio Sr:Fe:As=1:5:5 and sealed in a double quartz tube. Excess FeAs works as flux. We put Zr sponge as a getter in the outer tube and sealed with Ar gas in order to avoid contamination by air diffusing through the quartz wall. The tube was heated up to 1100∘C in 14 hours (including the holding at 700∘C for 3 hours) and slowly cooled down to 900∘C in 50 hours. The resistivity and the magnetic susceptibility showed a sharp transition at 199 K, in agreement with the results by Yan et al.[13]
For NMR experiments, a crystal with the size mm3 was mounted on a two-axis goniometer, which allows fine alignment of crystalline axes along the magnetic field within 0.2∘. The field-swept NMR spectra were taken by Fourier transforming the spin-echo signal with the step-sum technique. The value of was determined by fitting the time dependence of the spin-echo intensity of the central transition line after the inversion pulse to the theoretical formula[14]. Good fitting was obtained in the whole temperature range, 4.2–300 K.
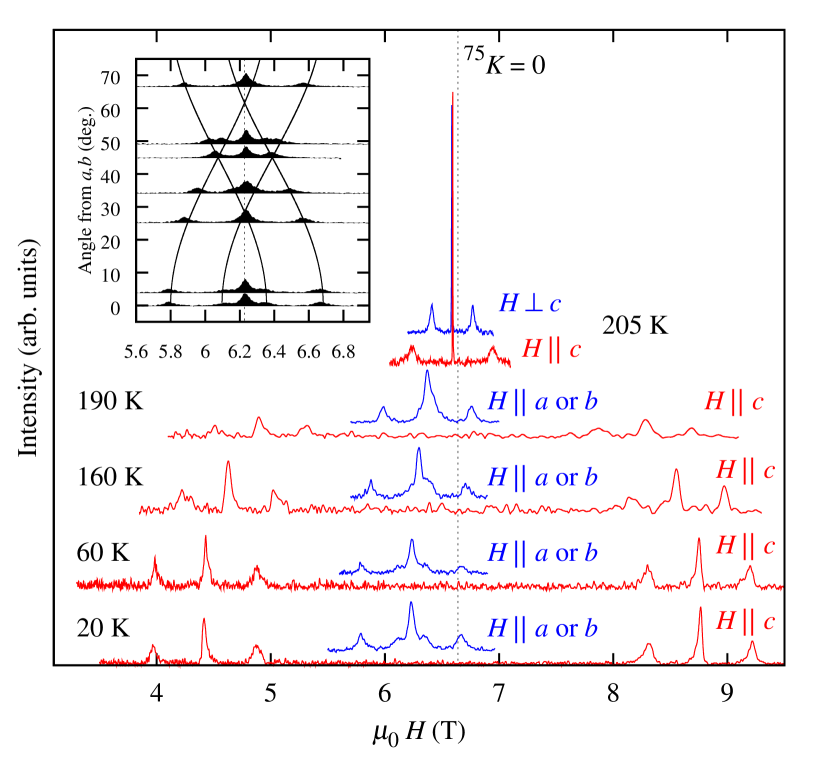
Figure 1 shows the 75As-NMR spectra obtained by sweeping the magnetic field. Since 75As nuclei have spin , the NMR spectrum consists of three transition lines. The central line appears at the magnetic Zeeman frequency and the two satellite lines at split by the quadrupole interaction. Here is the vacuum permeability, MHz/T is the nuclear gyromagnetic ratio and is sum of the external field and the magnetic hyperfine field from neighboring Fe spins. In the paramagnetic state, is proportional to , , being the Knight shift. The quarupole splitting follows the angular dependance,
| (1) |
where is the angle between and the -axis, is the azimuthal angle of in the -plane, and with , , , and being the elementary charge, the electric field gradient (EFG), the nuclear quadrupole moment, and the Planck’s constant, respectively.
In the paramagnetic state (=199 K), a very sharp central line with the full width at the half maximum of 4.5 kHz is observed (Fig. 1). Below , the spectrum split into the two sets of three lines for . For , in turn, the spectrum does not split but shifts to lower fields. This indicates that the AF order produces a staggered hyperfine field along the -axis, . Similar spectral changes were observed in BaFe2As2 and we showed that only the stripe-type AF order can lead to such a hyperfine field[12].
The hyperfine field is generally expressed as the sum of contributions from neighboring Fe spins , , where is the hyperfine coupling tensor to the spin at -th site, and is the factor. The expression can be converted to sum of the Fourier components, . For the stripe-type AF structure (referred to the orthorhombic reciprocal lattice), symmetry consideration concludes that only the -component of is non-zero[12],
| (2) |
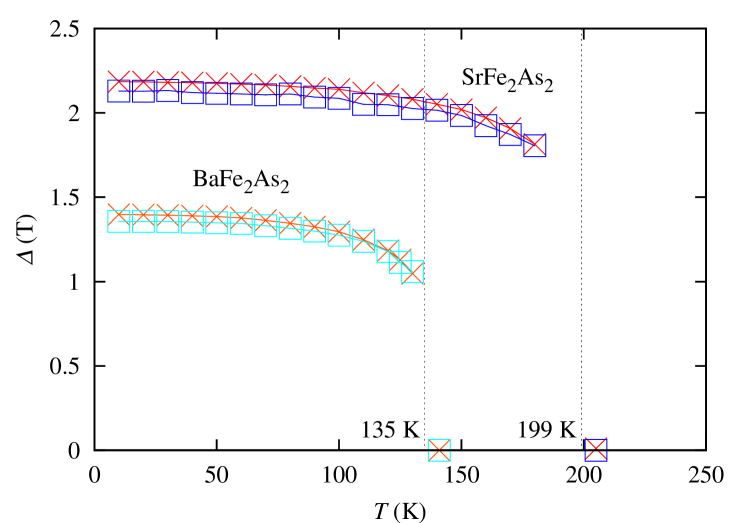
Then, , where is the AF moment per site along the -direction in the unit of the Bohr’s magneton . The temperature dependence of is plotted in Fig. 2. The jump of at is expected for the first-order transition. From the ordered moments determined by the neutron scattering measurements (=1.01 for SrFe2As2[11], and 0.87 for BaFe2As2[10]), are determined as 0.53 T/ for SrFe2As2 and 0.43 T/ for BaFe2As2.
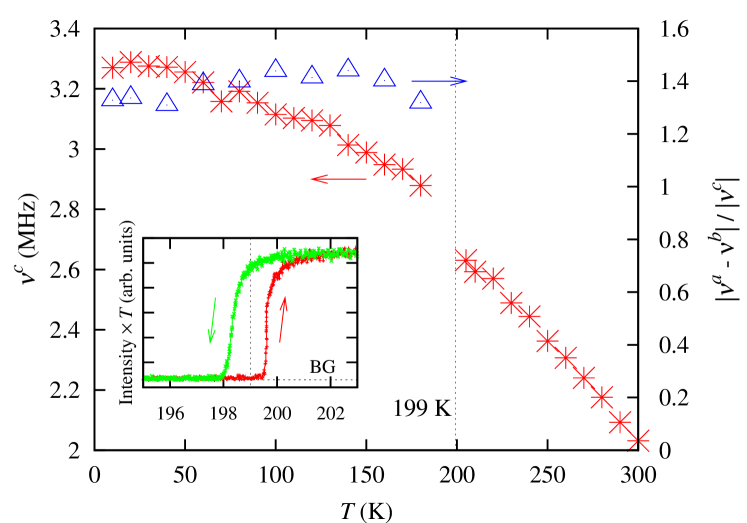
Figure 3 shows the quadrupole splitting as a function of temperature. In the tetragonal phase, the -axis corresponds to the largest principal value of the EFG, and . Thus the asymmetric parameter is zero. Below , it shows a jump, a direct evidence for the first-order structural transition. The value of exceeding unity means that the principal axis of the largest EFG rotates from the -axis above to the - or -axis below . Such a drastic change of EFG has been also observed in BaFe2As2. In the inset of Fig. 3, the peak intensity of the central line for in the paramagnetic phase is plotted near the transition. The hysteresis of about 1 K with the transitional width within 0.5 K demonstrates good homogeneity of the sample.
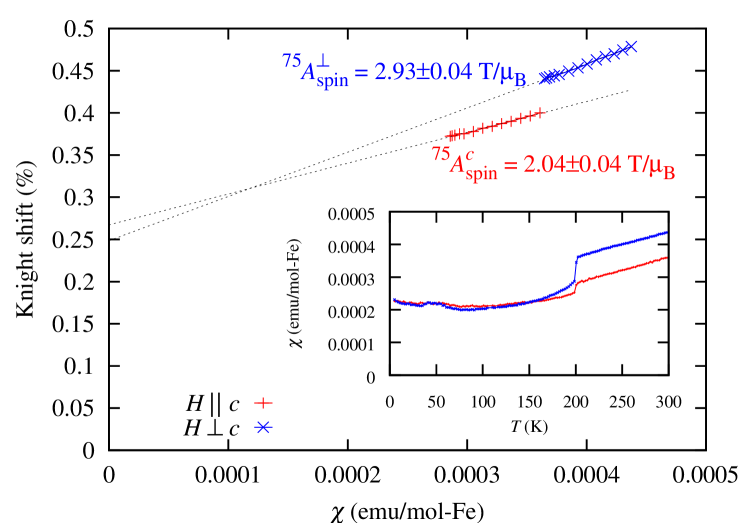
In Fig. 4, the Knight shift is plotted against the susceptibility in the paramagnetic phase, after correcting for the demagnetization field and the second order quadrupolar shift. In general, the Knight shift consists of the -dependent spin shift, and the -independent chemical (orbital) shift, . The spin part of Knight shift is linearly related to the temperature-dependent spin susceptibility via the hyperfine coupling tensor , . Here is the Abogadro’s number. From the slope of the plot in Fig. 4, the hyperfine coupling are obtained as T/ for , and T/ for . The isotropic part , which originates from the Fermi contact interaction with the As- orbitals, is three times larger than the anisotropic part . The latter is mainly due to As- orbitals, which contribute to the conduction bands through hybridization with the Fe- orbitals. Similar result was also reported for BaFe2As2[12]. Although the off-diagonal component also originates from the orbitals, it cannot be determined from the present - analysis, because does not contribute to the uniform () hyperfine field. It plays a key role, however, in the nuclear relaxation as we discuss below.
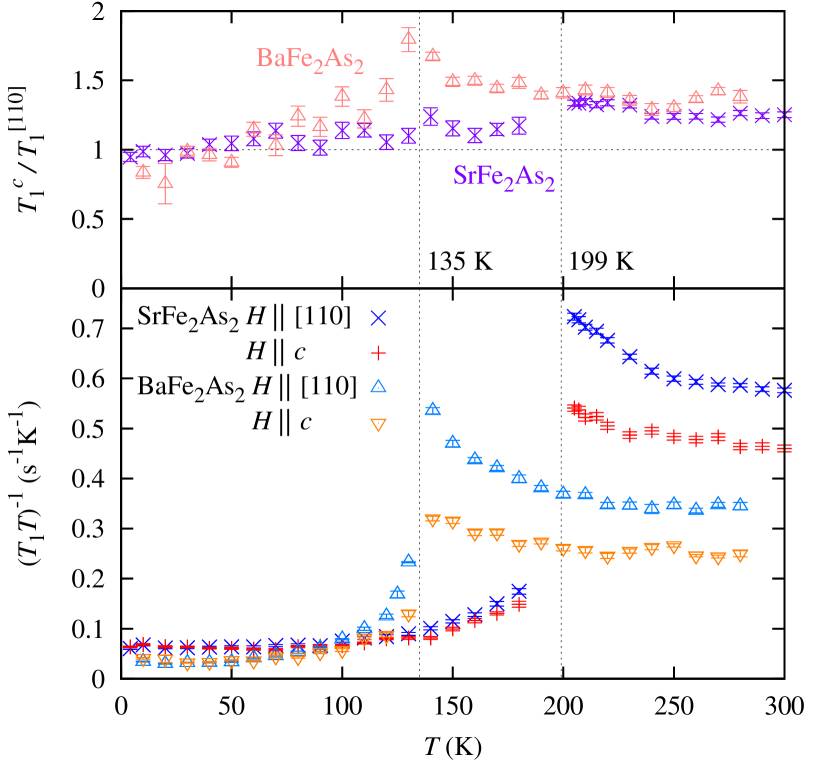
Next, the magnetic fluctuations are discussed based on the results of the spin-lattice relaxation rate . The lower panel of Fig. 5 shows the temperature dependence of the relaxation rate divided by temperature for SrFe2As2 and BaFe2As2. For both compounds, a clear reduction of is observed across the transition. At the lowest temperatures, becomes constant, which is a specific feature of Fermi liquids. This indicates that small Fermi surfaces remain in the AF state, which is consistent with the quantum oscillation experiments[15, 16].
The most prominent feature is the large enhancement of as the temperature approaches , in particular for . This indicates development of strong AF fluctuations in the paramagnetic state, even through critical slowing down of magnetic fluctuations is generally not expected for a first-order phase transition. In order to see the anisotropic behavior, we plotted the ratio against temperature in the upper panel of Fig. 5. This shows that the ratio increases significantly near , i. e. the upturn of is anisotropic, in BaFe2As2. On the other hand, the ratio is nearly independent of temperature in SrFe2As2. The different behavior for the two materials can be understood qualitatively in terms of anisotropic AF fluctuations as follows.
The nuclear relaxation rate can be expressed in terms of the fluctuations of the hyperfine field perpendicular to the magnetic field at the NMR angular frequency . Since both the hyperfine coupling and the spin correlation function are anisotropic, it is necessary to consider not only the imaginary part of the Fe spin susceptibility but the hyperfine field at the As site . Then,
| (3) | ||||
| (4) | ||||
| (5) |
when is the direction of the field and denotes the power spectral density of a time-dependent random variable . The enhancement of should be ascribed to the spin fluctuations near the ordering wave vector [17]. In fact, short range AF order at the same vector has been reported by quasi-elastic neutron scattering in BaFe2As2[18]. We use the orthorhombic notation both above and below to keep consistency.
If we consider only contribution for simplicity, combining with Eqs. (5) and (2), the anisotropy of is given by
| (6) |
Here is the dynamical representation of . Note that the behavior at high temperatures is due to contribution from a broad region in the -space away from , which is not included in the above expression. Hnece the analysis is valid only qualitatively.
In the paramagnetic tetragonal phase or for the case of in the orthorhombic phase, the in-plane anisotropy is averaged. Then,
| (7) |
The neutron diffraction experiments showed the ordered moments in the AF states are directed along the -axis[11, 10]. If the spin fluctuations above are strongly anisotropic [],
| (8) |
On the other hand, if the fluctuations are isotropic [],
| (9) |
The data in the upper panel of Fig. 5 indicate that SrFe2As2 corresponds to the latter isotropic case, while in BaFe2As2 the ratio of exceeds 1.5 near suggesting more anisotropic AF fluctuations. Such difference in the anisotropy of spin fluctuations indicates different roles of the spin-orbit interaction in the two materials. Specifically, the anisotropy of the spin fluctuations can be related to the orbital character of the electronic states as follows. In iron pnictides, the five-fold degeneracy of the orbitals are partially lifted near the Fermi level, the , , and having the dominant weight[19]. Generally the spin excitations are associated with either the intraband or interband transition, which generates orbital fluctuations along specific directions. For example, the transiton between and induces orbital fluctiaions along the direction, while the transition between and (or ) generates fluctuations of and . The preferred direction of the orbital fluctiations thus determined by the geometry and orbital characters of the Fermi surfaces will cause anisotropic spin fluctuations via the spin-orbit interaction. In fact, more detailed and quantitative analysis should be possible by using the tight-binding representation of the band structure. Such an analysis is highly desired.
In summary, we have investigated the detailed 75As-NMR studies in SrFe2As2 at ambient pressure. Clear evidence for the first-order structural and AF phase transition is observed from the change of NMR spectra. The enhanced nuclear relaxation rate in the vicinity of the transition is most probably caused by the stripe AF fluctuations. The anisotropy of indicates that the stripe AF fluctuations become anisotropic in the spin-space in BaFe2As2 near the transition, but remains isotropic in SrFe2As2. It is interesting to see how the AF fluctuations and their anisotropy change when the materials become superconducting by pressure or by doping.
We thank M. Yoshida for helpful discussions. This work was supported partly by the Grant-in-Aids on Priority Areas “Invention of Anomalous Quantum Materials” (No. 16076204), by the Global COE program, and by Special Coordination Funds for Promoting Science and Technology “Promotion of Environmental Improvement for Independence of Young Researchers” from MEXT of Japan. K. K. is financially supported as a JSPS research fellow.
References
- [1] Y. Kamihara, T. Watanabe, M. Hirano, and H. Hosono: J. Am. Chem. Soc. 130 (2008) 3296.
- [2] M. Rotter, M. Tegel, D. Johrendt, I. Schellenberg, W. Hermes, and R. Pöttgen: Phys. Rev. B 78 (2008) 020503(R).
- [3] M. Rotter, M. Tegel, and D. Johrendt: Phys. Rev. Lett. 101 (2008) 107006.
- [4] K. Sasmal, B. Lv, B. Lorenz, A. Guloy, F. Chen, Y. Xue, and C. W. Chu: Phys. Rev. Lett. 101 (2008) 107007.
- [5] G. Wu, H. Chen, T. Wu, Y. L. Xie, Y. J. Yan, R. H. Liu, X. F. Wang, J. J. Ying, and X. H. Chen: J. Phys.:Condens. Matter 20 (2008) 422201.
- [6] H. Kotagawa, H. Sugawara, and H. Tou: J. Phys. Soc. Jpn. 78 (2009) 013709.
- [7] P. L. Alireza, Y. T. C. Ko, J. Gillett, C. M. Petrone, J. M. Cole, G. G. Lonzarich, and S. E. Sebastian: J. Phys.: Condens. Matter 21 (2008) 012208.
- [8] W. Yu, A. A. Aczel, T. J. Williams, S. L. Bud’ko, N. Ni, P. C. Caneld, and G. M. Luke: cond-mat/0811.2554.
- [9] H. Fukazawa, N. Takeshita, T. Yamazaki, K. Kondo, K. Hirayama, Y. Kohori, K. Miyazawa, H. Kito, H. Eisaki, and A. Iyo: J. Phys. Soc. Jpn. 77 (2008) 105004.
- [10] Q. Huang, Y. Qiu, W. Bao, J. Lynn, M. Green, Y. Gasparovic, T. Wu, G. Wu, and X. H. Chen: Phys. Rev. Lett. 101 (2008) 257003.
- [11] K. Kaneko, A. Hoser, N. Caroca-Canales, A. Jesche, C. Krellner, O. Stockert, and C. Geibel: Phys. Rev. B 78 (2008) 212502.
- [12] K. Kitagawa, N. Katayama, K. Ohgushi, M. Yoshida, and M. Takigawa: J. Phys. Soc. Jpn. 77 (2008) 114709.
- [13] J.-Q. Yan, A. Kreyssig, S. Nandi, N. Ni, S. L. Bud’ko, A. Kracher, R. J. McQueeney, R. W. McCallum, T. A. Lograsso, A. I. Goldman, and P. C. Caneld: Phys. Rev. B 78 (2008) 024516.
- [14] A. Narath: Phys. Rev. 162 (1967) 320.
- [15] J. G. Analytis, R. D. McDonald, J.-H. Chu, S. C. Riggs, A. F. Bangura, C. Kucharczyk, M. Johannes, and I. R. Fisher: cond-mat/0902.1172.
- [16] S. E. Sebastian, J. Gillett, N. Harrison, P. H. C. Lau, D. J. Singh, C. H. Mielke, and G. G. Lonzarich: J. Phys.: Condens. Matter 20 (2008) 422203.
- [17] The enhanced anisotropy near for BaFe2As2, indicates . Our argument in Ref. \citenKitagawaBa122 leads to two possibilities; two-dimensional ferromagnetic fluctuations, which is rather unlikely, or anisotropic stripe AF fluctuations.
- [18] K. Matan, R. Morinaga, K. Iida, and T. J. Sato: Phys. Rev. B 79 (2009) 054526.
- [19] H. Ikeda: J. Phys. Soc. Jpn. 77 (2008) 123707.