11email: [ptb;xilouris;johnal;thk;cgoudis]@astro.noa.gr 22institutetext: Astronomical Laboratory, Department of Physics, University of Patras, 26500 Rio-Patras, Greece.
22email: pechris@upatras.physics.gr 33institutetext: Technological Education Institute of Crete, Department of Sciences, P.O. Box 1939, GR-710 04 Heraklion, Crete, Greece.
33email: fotis@stef.teiher.gr
Discovery of optical emission from the supernova remnant G 32.80.1 (Kes 78)
Deep optical CCD images of the supernova remnant G 32.80.1 were obtained where filamentary and diffuse emission was discovered. The images were acquired in the emission lines of HN ii and [S ii]. Filamentary and diffuse structures are detected in most areas of the remnant, while no significant O iii emission is present. The flux–calibrated images suggest that the optical emission originates from shock-heated gas since the [S ii]/H ratio is greater than 1.2. The Spitzer images at 8m and 24m show a few filamentary structures to be correlated with the optical filaments, while the radio emission at 1.4 GHz in the same area is found to be very well correlated with the brightest optical filaments. Furthermore, the results from deep long–slit spectra also support the origin of the emission to be from shock–heated gas ([S ii]/H 1.5). The absence of O iii emission indicates slow shocks velocities into the interstellar clouds” (100 km s-1), while the S ii ratio indicates electron densities up to 200 cm-3. Finally, the H emission is measured to lie between 1.8 to 4.6 erg s-1 cm-2 arcsec-2, while from VGPS Hi images a distance to the SNR is estimated to be between 6 to 8.5 kpc.
Key Words.:
ISM: general – ISM: supernova remnants – ISM: individual objects: G 32.80.1 (Kes 78)1 Introduction
Supernova remnants (SNRs) are important components of a galaxy since during the supernova ejecta they release huge amounts of energy and in subsequent phases heavy elements are mixed into the interstellar medium (ISM). Hence, they play an important role to understand the supernovae mechanism, the interstellar medium (ISM) and their interaction. The majority of the SNRs have been discovered in radio wavelengths from their non-thermal synchrotron emission and only a few of them have been detected in soft X-rays and in the optical (Green gre06 (2006)). Optical observations (i.e. Boumis et al. bou05 (2005); bou08 (2008)) offer an important tool for the study of the interaction of the shock wave with dense concentrations of gas found in the ISM.
The Galactic SNR G 32.8–0.1 (Kes78) was discovered in a 408 MHz radio continuum survey by Kesteven (kes68 (1968)), where it appears as a small source (20′ 10′ in diameter). Several radio observations were perfromed eversince at 30.9, 330, 408, 430, 2700, 5000, 10600 MHz by Kassim (kas89 (1989)), Kassim (kas92 (1992)), Caswell et al. (cas75 (1975)), Dickel & Denoyer (dic75 (1975)), Velusamu & Kundu (vel74 (1974)), Caswell et al. (cas75 (1975)) and Beckel & Kundu (bec75 (1975)) showing its non–thermal emission, while a spectral index between 0.5 and 0.78 was established. Observations in the hydroxyl molecule (OH) at 1720 MHz (Koralesky et al. kor98 (1998)) showed that the emission results from masers that are shock–excited due to the interaction of the SNR and an adjacent molecular cloud. They found a magnetic field of 1.5 0.3 mG and determined a kinematic distance to the SNR at 7.1 kpc. Allakhverdiyev et al. (all83 (1983)) and Case & Bhattacharya (cas98 (1998)) using the radio surface brightness – diameter relationship (–D) calculated a distance at 7.1 kpc and 6.3 kpc respectively. Neutral hydrogen observations at 21 cm (Gosachinskii & Khersonskii gos85 (1985)) resulted to a distance of 9 kpc, an age of 1.2 yr and an explosion energy of 5.3 erg for the SNR. In radio surveys of the surrounding region at 1.4 GHz (Manchester et al. man85 (1985)), no pulsar was found to be associated with G 32.8–0.1 up to 1 mJy of period 10 ms. IRAS observations (Saken et al. sak92 (1992)) showed a barely resolved IR shell to be coincident with the SNR’s radio emission. Spitzer Space Telescope observed the region of interest as part of a large survey to map a large part of the Galactic plane. In a recent study (Reach et al. rea06 (2006)), the radio emission of Kes 78 was compared with the infrared emission of this part of the sky and the comparison was described as “confused” since no clear correlation was evident.
In this paper we report the optical detection of G 32.8–0.1 and present flux calibrated images in major optical emission lines. Deep long slit spectroscopy was also performed in a number of selected areas of interest. In Sect. 2, information about the observations and data reduction is given, while the results of the imaging and spectroscopic observations are presented in Sect. 3 and 4. In Sect. 5, we compare our data with observations at other wavelengths, in Sect. 6 we discuss the optical properties of the SNR, while in Sect. 7 we summarize the results of this work.
2 Observations
A summary and log of our observations are given in Table 1. In the sections below, we describe these observations in detail.
2.1 Imaging
2.1.1 Wide–field imagery
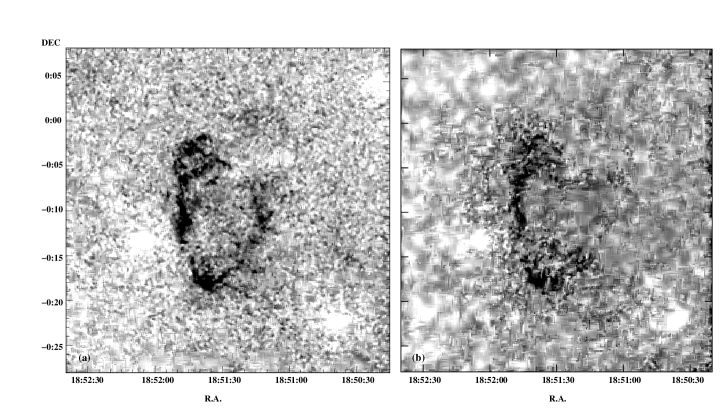
The wide–field imagery of G 32.8–0.1 was obtained with the 0.3 m Schmidt–Cassegrain (f/3.2) telescope at Skinakas Observatory, Crete, Greece in June 7–9, 11 and August 26, 2005. A 1024 1024 Thomson CCD was used which has a pixel size of 19 m resulting in a 70′ 70′ field of view and an image scale of 4″ per pixel. The area of the remnant was observed with the HN ii, [S ii], and [O iii] filters. The exposure time was set to 2400 s for each exposure and 180 s for the continuum red and blue filters. The corresponding continuum images were subtracted from those containing the emission lines to eliminate the confusing star field (see Boumis et al. bou02 (2002), for details of this technique). The continuum–subtracted images of the HN ii and [S ii] emission lines are shown in Fig. 1(a) and 1(b), respectively.
The IRAF and MIDAS packages were used for the data reduction. All frames were bias–subtracted and flatfield–corrected using a series of well exposed twilight frames. A smoothing of 5 5 pixels median box was applied to all images while the stars were removed by appropriately scaling and subtracting the continuum images. The spectrophotometric standards stars HR5501, HR7596, HR7950, HR8634, and HR9087 (Hamuy et al. ham92 (1992)) were used for the absolute flux calibration. The astrometric solution for all data frames was calculated using the Hubble Space Telescope (HST) Guide Star Catalogue (Lasker et al. las99 (1999)). All the equatorial coordinates quoted in this work refer to epoch 2000.
For all images we calculated median smoothing over a 5x5 neighborhood and replace the original value by the median value only using MIDAS command ”filter/median”. A sentence was added in the text to make it clear.
2.1.2 High–resolution imagery
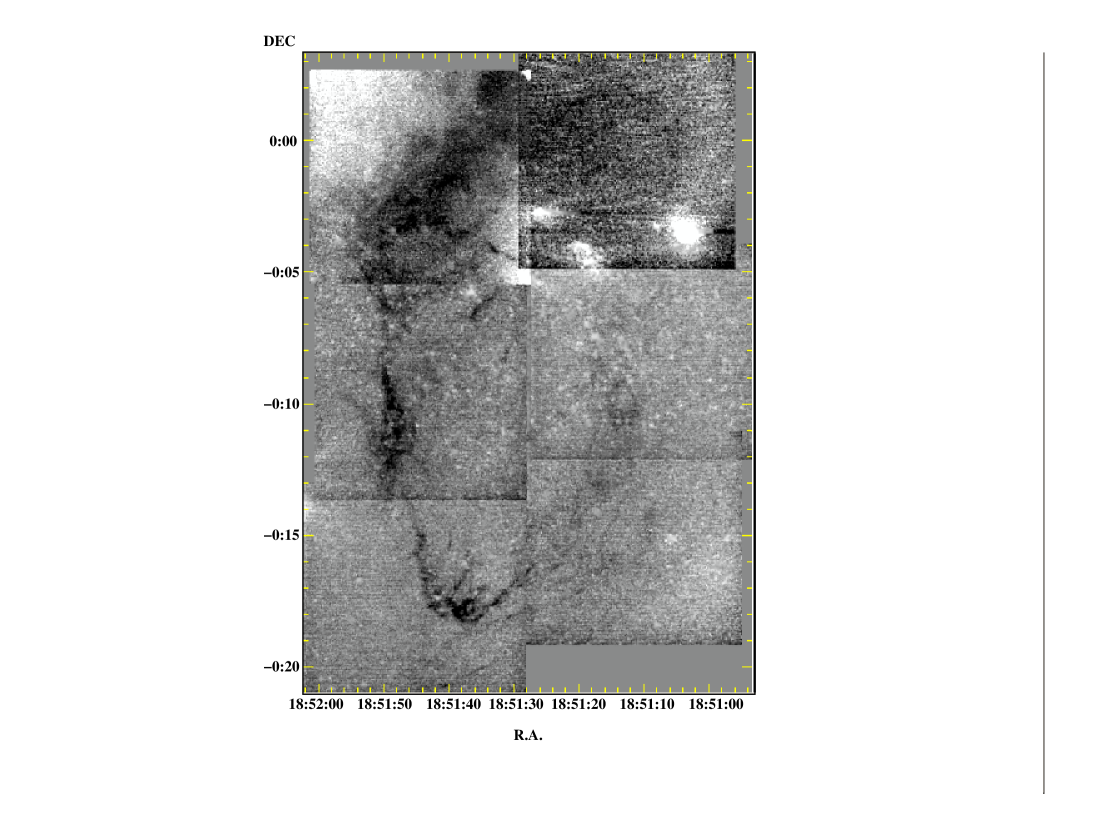
Optical images at higher angular resolution of G 32.80.1 were also obtained with the 1.3 m (f/7.7) Ritchey– Cretien telescope at Skinakas Observatory in July 4–7 and 8–10, 2007, using the H+[N ii] interference filter. The detector was a 1024 1024 SITe CCD with a field of view of 8.5 8.5 arcmin2 and an image scale of 0.5″ per pixel. Six exposures were taken through the H+[N ii] filter, each of 2400 s and six corresponding exposures in the continuum, each of 180 s. After the continuum subtraction, all fields were projected to a common origin on the sky and were subsequently combined to create the final mosaic in HN ii. Note that the upper right field was observed close to the morning twilight, significantly reducing its signal–to–noise in comparison with the surrounding fields. During the observations, the “seeing” varied between 0.8″and 1.5″, while the full width at half maximum (FWHM) of the star images was between 1.1″and 2.1″. The continuum–subtracted mosaic is shown in Fig. 2.
2.2 Spectroscopy
Low dispersion long–slit spectra were obtained with the 1.3 m telescope at Skinakas Observatory in June 4 and 5 and September 7, 2005. The exposure time was 3900 s. The 1300 line mm -1 grating was used with the 2000 800 (13 m) SITe CCD covering the range 4750Å – 6815Å. The 1 Å pixel-1 and the dispersion of 1300 line mm -1 result in a spectral resolution of 8 and 11 Å in the red and blue wavelengths, respectively. The slit has a width of 77 and length of 79 and in all cases was oriented in the south–north direction. The coordinates of the slit centers of each spectrum are given in Table 1. For the absolute flux calibration the spectrophotometric standard stars HR4468, HR5501, HR7596,HR7950, HR8634 and HR9087 were used. The data reduction was performed by using the IRAF package.
3 The HN ii, S ii and O iii emission line images
Optical emission is detected for the first time from this remnant. The most interesting regions lie in the south, east and north, where bright filamentary and faint diffuse structures are present (between 18h51m35s, –00°17′30″; 18h51m51s, –00°08′40″and 18h51m41s, –00°01′20″), which all are very well correlated with the radio emission. The bright HN ii filaments cover most of the emission found in radio wavelengths and extend for 16′ from south to north through the east part of the SNR. In contrast to above results, diffuse emission was mainly detected in the west with only one bright filament between 18h51m09s, –00°09′45″and 18h51m14s, –00°10′48″ (1′ long). No significant emission was found in the image of the O iii medium ionization line and therefore it is not shown here. The morphology of the S ii image is generally similar, though not as bright as, to that of the HN ii image. We detected S ii emission where most of the HN ii emission was found with filamentary bright structures in the south and east areas, while diffuse emission characterizes the rest of the remnant’s emission.
The flux calibrated images of HN ii and S ii provide a first indication to the nature of the observed emission (see Table 2). A study of these images shows that all parts of the optical remnant originate from shock heated gas since we estimate ratios S ii/H1.2 consistent with the spectral measurements. In particular, the eastern and southern areas show S ii/H1.5 and 1.7 respectively, while the northern area shows S ii/H1.3. Only the western area does not show strong S ii emission, hence only upper limits are given.
4 The optical spectra from G 32.80.1
Deep low–resolution spectra were taken on the brightest optical filaments in the eastern and southern parts of the SNR (their exact position are given in Table 1). In Table 3, we present the relative line fluxes taken from two different apertures along the slit. In particular, apertures I and II have an offset (see Table 1) north or south of the slit center because they are free of field stars and at the same time they include sufficient line emission to alloow for an accurate determination of the line fluxes. The background extraction aperture was taken towards the northern or the southern ends of the slit depending on the filament’s position within the slit.
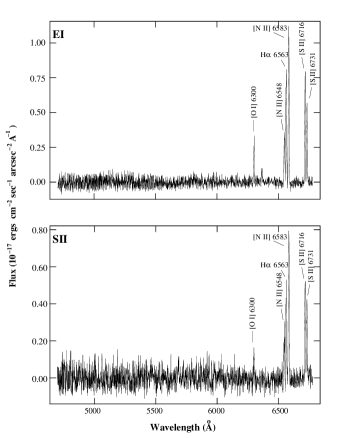
The measured line fluxes indicate emission from shock–heated gas, since S ii/H 1.5. Furthermore, the N ii/H ratio, which takes values between 1.3 and 2.2 (see Table 3), falls well inside the range expected for an SNR (Fesen et al. fes85 (1985)). The signal–to–noise ratios do not include calibration errors, which are less than 10 percent. Typical spectra from the east (E1) and south (SII) are shown in Fig. 3. The absolute H flux covers a range of values from 1.8 to 4.6 erg s-1 cm-2 arcsec-2. The S ii ratio that was measured between 1.3 and 1.5, indicates electron densities below 150 cm-3 (Osterbrock & Ferland ost06 (2006)). However, taking into account the statistical errors on the sulfur lines, it is found that electron densities up to 200 cm-3 are allowed (Shaw & Dufour sha95 (1995)). O iii emission was not detected, while the very weak H emission and the absence of the O iii suggest significant interstellar attenuation of the optical emission. The absence of O iii emission can also be explained by slow shocks propagating into the interstellar clouds ( 100 km s-1; Hartigan et al. har87 (1987)) since higher velocities shocks should produce detectable O iii emission.
5 Observations at other wavelengths
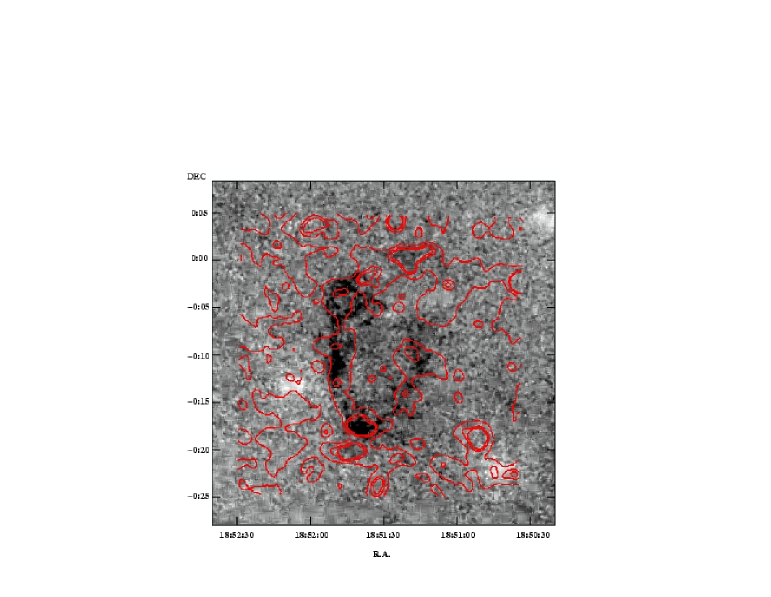
The optical emission matches the radio emission of G 32.80.1 very well at 1.4 GHz, suggesting their association (Fig. 4). The observed filaments are located close to the outer edge of the radio contours but the low resolution of the radio images does not allow us to determine the relative position of the filament with respect to the shock front. We investigate possible correlations of the optical emission with infrared emission.
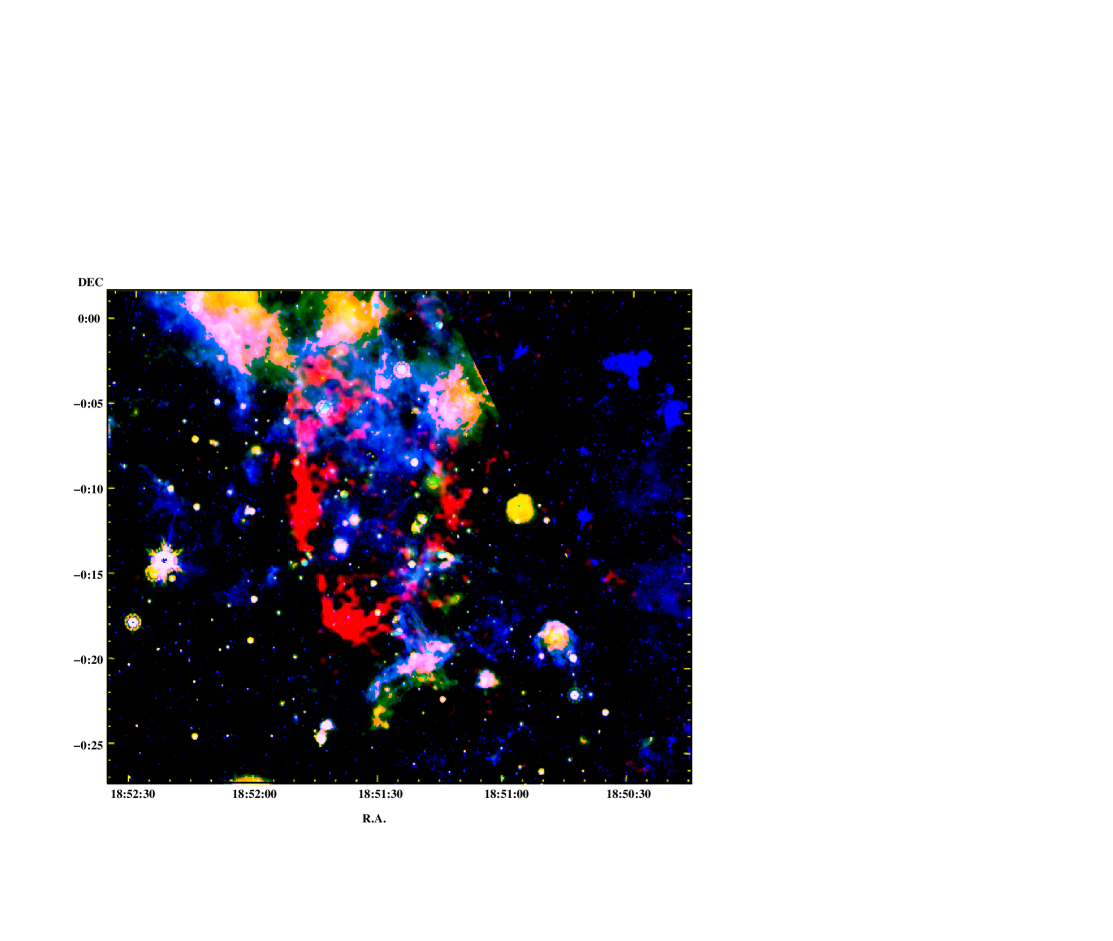
The region of interest has been observed with the Spitzer Space Telescope in both and bands as part of the large surveys GLIMPSE and MIPSGAL (Benjamin et al. ben03 (2003) and Carey et al. car05 (2005), respectively) along the Galactic plane. The superb resolution of Spitzer in these wavelengths allowed us to perform a very careful comparison between optical and infrared emission and look for possible correlations. In Fig. 5, we present a composite image of the H optical emission (red), the emission (green) and the emission (blue). It is evident that although there is quite a lot of structure and confusion in the background due to neighboring emission regions (as already pointed out by Reach et al. rea06 (2006)), there are regions (e.g. in the North, North–West and South) where the optical emission overlaps with infrared (mostly with the ) emission. We also argue that the discontinuity of the shape of the remnant in the North–West part may be due to heavy obscuration due to dust clouds seen in the infrared.
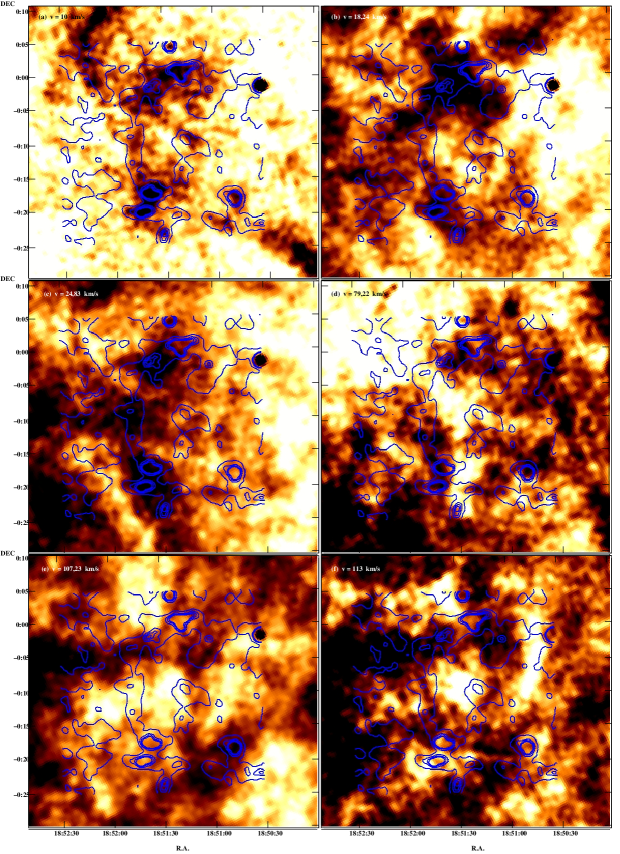
New Hi kinematics data are available from the VLA Galactic Plane Survey (VGPS; Stil et al. sti06 (2006)). The distribution of the atomic gas was examined in detail by searching radial velocities in the range from 113 to 165 km s-1 and looking for signs of interaction between the expanding shock fronts of the SNR and the surrounding medium. In Fig. 6, we present velocities from six different channels and radio contours on top of the Hi emission. The Hi images in the range of 10 to 25 km s-1 (Fig. 6(a)–(c)) are interesting because intense Hi emission is present almost all over the SNR’s radio boundaries. If the Hi emission is due to the SNR’s expanding envelope then using the Galactic rotation curve model and recent measurements of its parameters (R kpc, Eisenhauer at al. eis05 (2005); V km s-1 Feast & Whitelock fea97 (1997)) we can estimate distances in the range of 0.8 to 2 kpc. At velocities greater than 80 km s-1 (Fig. 6(d)–(e)) and especially at 113 km s-1 (Fig. 6(f)) features all around the remnant show signs of interaction of the SNR with the Hi emission. In that case, the distances are estimated to be in the range of 6 to 8.5 kpc.
ROSAT All–sky survey data were also examined, but no significant X–ray emission was detected.
6 Discussion
The supernova remnant G 32.8–0.1 shows up as an almost complete shell in the radio band, its optical emission marginally correlates with the infrared emission and no X–ray emission has been detected so far. The absence of soft X–ray emission may indicate a low shock temperature and/or a low density of the local interstellar medium. The O iii flux production depends mainly upon the shock velocity and the ionization state of the preshocked gas. Therefore, as mentioned in Sect. 3.2, the absence of O iii emission may be explained by slow shocks propagating into the ISM. The HN ii image best describes the newly detected structures. Sulfur line emission is also detected and generally appears less filamentary and more diffuse than in the HN ii image with their position and shape to be in agreement with that of the HN ii. The absence of O iii emission does not allow us to determine whether slow shocks travel into ionized gas or whether faster shocks travel into neutral gas (Cox & Raymond 1985) but we can exclude moderate or fast shocks overtaking ionized gas. The presence of [O i] 6300 Å line emission is also consistent with the emission originating from shock heated gas. Both the calibrated images and the long–slit spectra suggest that the detected emission results from shock heated gas since the S ii/H ratio exceeds the empirical SNR criterion value of 0.4–0.5, while the measured N ii/H ratio also confirms this result.
The interstellar extinction c cannot be accurately determined due to the low significance of the H flux. However, using the H upper limits (see Table 3), the lower limits on c(H) are calculated to 2.2 and 2.7 or AV of 4.51 and 5.53 for the areas in the South and the East, respectively. Both limits derived from our spectra, suggest an area of high interstellar extinction as it is expected for an object being at the galactic plane.
Estimated values of N cm-2 and N cm-2 are given by Dickey & Lockman (dic90 (1990)) and Kalberla et al. (kal05 (2005)) respectively, for the column density in the direction of G 32.80.1. Using the relation of Ryter et al. (ryt75 (1975)), we obtain an N and for the c limits calculated from our spectra, respectively. Both values are consistent with the estimated galactic NH considering the uncertainties involved.
We have also determined the electron density measuring the density sensitive line ratio of S ii. The measured densities lie below 200 cm-3. Assuming that the temperature is close to 104 K, it is possible to estimate basic SNR parameters. The remnant under investigation has not been studied in detail hence the current stage of its evolution is unknown. Assuming that the remnant is still in the adiabatic phase of its evolution the preshock cloud density nc can be measured by using the relationship (Dopita dop79 (1979))
| (1) |
where is the electron density derived from the sulfur line ratio and Vs is the shock velocity into the clouds in units of 100 km s-1. Furthermore, the blast wave energy can be expressed in terms of the cloud parameters by using the equation given by McKee & Cowie (mck75 (1975))
| (2) |
The factor is approximately equal to 1 at the blast wave shock, is the explosion energy in units of 1051 erg and rs the radius of the remnant in pc. By using the upper limit on the electron density of 200 cm-3, which was derived from our spectra, we obtain from Eq. (1) that . Then Eq. (2) becomes , where the distance to the remnant in units of 1 kpc.
Since, there are no other measurements of the interstellar density n0, values of 0.1 and 1.0 will be examined. Following the result of Eq. (2) and assuming the value of 0.53 (Gosachinskii & Khersonskii 1985) for the supernova explosion energy (E51), we find that the remnant may lie at distance greater than 7.9 kpc. Then, the higher interstellar density of 1 cm-3 suggests that the column density is greater than , while for n it becomes greater than . Combining the previous results and assuming that the column density is found in the range of , then the higher interstellar density seems to be more probable. The observed Hi morphology provides clear evidence of the interaction of the SNR with the surrounding ISM. However, in all cases, the actual distance depends also on the adopted Galactic rotation curve even in the case where a correlation is well established. Therefore, the values found is Sect. 5 may be slightly over (or under) estimated, since some contribution of Hi that is not associated with SNR may be included. The kinematic distances in the second case are in aggrement with previous estimates of the distance to the SNR, based on several methods summarized in Section 1. Thus, a distance to the SNR between 6 to 8.5 kpc might be more plausible. However, more observations are needed (e.g. kinematic) in order to confidently determine the current stage of evolution of G 32.80.1.
7 Conclusions
Optical emission from the supernova remnant G 32.80.1 was detected for a first time with both filamentary and diffuse structure to be present. The bright optical filaments are correlated very well with the remnant’s radio emission at 1.4 GHz suggesting their association, while correlation evidences are also shown with the Spitzer Space Telescope mostly at 8m. The flux–calibrated images and the long–slit spectra indicate that the emission arises from shock–heated gas. The surrounding ISM was explored through the Hi 21 cm emission line. From these observation we adopted a distance to the SNR between 6 to 8.5 kpc. Finally, an upper limit for the electron density of 200 cm-3 is calculated.
Acknowledgements.
The authors would like to thank John Meaburn and Jeroen Stil for their helpful discussions on VLSR calculation. JA acknowledges funding by the European Union and the Greek Ministry of Development in the framework of the programme ‘Promotion of Excellence in Research Institutes (2nd Part)’. Skinakas Observatory is a collaborative project of the University of Crete, the Foundation for Research and Technology-Hellas and the Max-Planck-Institut für Extraterrestrische Physik. The National Radio Astronomy Observatory is a facility of the National Science Foundation operated under cooperative agreement by Associated Universities, Inc.References
- (1) Allakhverdiyev A. O., Guseinov O. Kh., Kasumov F. K. & Yusifov I. M., 1983, Ap&SS, 97, 287
- (2) Becker R. H. & Kundu M.R., 1975, AJ, 80, 679
- (3) Benjamin R. A., et al., 2003, PASP, 115, 953
- (4) Boumis P., Mavromatakis F., Palaiologou E. V., Becker W., 2002, A&A, 396, 225
- (5) Boumis P., Mavromatakis F., Xilouris E. M., Alikakos J., Redman M. P., Goudis C. D., 2005, A&A, 443, 175
- (6) Boumis P., Alikakos J., Christopoulou P. E., Mavromatakis F., Xilouris E. M., Goudis C. D., 2008, A&A, 481, 705
- (7) Carey S. J., et al., 2005, AAS, 207, 63.33
- (8) Case G. L. & Bhattacharya D., 1998, ApJ, 504, 761
- (9) Caswell J. L., Clark D. H. & Crawford D. F., 1975, AuJPA, 39
- (10) Dickel J. R. & DeNoyer L. K., 1975, AJ, 80, 437
- (11) Dickey, J. M. & Lockman, F. J. 1990, ARAA, 28, 215
- (12) Dopita, M. A. 1979, ApJS, 40, 455
- (13) Eisenhauer F., Genzel, R., Alexander, T., et al., 2005, ApJ, 628, 246
- (14) Feast M. & Whitelock P., 1997, MNRAS, 291, 683
- (15) Fesen R. A., Blair W. P. & Kirshner R. P., 1985, ApJ, 292, 29
- (16) Gosachinskij I. V. & Khersonskij, V. K., 1985, Ap&SS, 108, 303
- (17) Green D. A., 2006, A Catalog of Galactic Supernova Remnants (2006 April version), Mullard Radio Astronomy Observatory Cambridge
- (18) Hamuy, M., Walker, A. R., Suntzeff, N. B., Gigoux, P., Heathcote, S. R. & Phillips, M. M. 1992, PASP, 104, 533
- (19) Hartigan, P., Raymond, J. & Hartmann, L. 1987, ApJ, 316, 323
- (20) Kalberla P. M. W., Burton, W. B., Hartmann, Dap, Arnal, E. M., Bajaja, E., Morras, R., Pöppel, W. G. L., 2005, A&A, 440, 775
- (21) Kassim N. E., 1989, ApJS, 71, 799
- (22) Kassim N. E., 1992, AJ, 103, 943
- (23) Kesteven M. J. L., 1968, AuJPh, 21, 369
- (24) Koralesky B., Frail D. A., Goss W. M., Claussen M. J.& Green A. J.,1998, AJ, 116, 1323
- (25) Lasker B. M., Russel J. N. & Jenkner H., 1999, in the HST Guide Star Catalog, version 1.1-ACT, The Association of Universities for Research in Astronomy, Inc
- (26) Manchester R. N., D’Amico N. & Tuohy I. R., 1985, MNRAS, 212, 975
- (27) McKee, C. F., & Cowie, L. L. 1975, ApJ, 195, 715
- (28) Olling R. P. & Merrifield M. R., 1998, MNRAS, 297,943
- (29) Osterbrock D. E. & Ferland G. J., 2006, Astrophysics of gaseous nebulae and AGN, eds. University Science Books, US
- (30) Reach W. T., et al., 2006, AJ, 131, 1479
- (31) Ryter, C., Cesarsky, C. J., Audouze, J., 1975, ApJ, 198, 103
- (32) Saken J, M., Fesen R. A.& Shull J. M., 1992, ApJS, 81, 715
- (33) Shaw, R. A. & Dufour, R. J. 1995, PASP, 107, 896
- (34) Stil J. M., Taylor A. R., Dickey J. M., Kavars D. W., Martin P. G., Rothwell T. A., Boothroyd A. I., Lockman F. J. & McClure-Girifiths N. M., 2006, AJ, 132, 1158
- (35) Velusamy T. & Kundu M. R., 1974, A&A, 32, 375
| IMAGING | ||||||
|---|---|---|---|---|---|---|
| Filter | Total exp. time | No of diff. fields | Telescope | |||
| () | () | (sec) | ||||
| H[N ii] 6548 & 6584 Å | 6570 | 75 | 4800 (2)a | 1 | 0.3-m | |
| O iii 5007 Å | 5005 | 28 | 9600 (4) | 1 | 0.3-m | |
| S ii 6716 & 6731 Å | 6720 | 18 | 9600 (4) | 1 | 0.3-m | |
| Cont blue | 5470 | 230 | 180 | 1 | 0.3-m | |
| Cont red | 6096 | 134 | 180 | 1 | 0.3-m | |
| H[N ii] 6548 & 6584 Å | 6570 | 75 | 2400 | 6 | 1.3-m | |
| Cont red | 6096 | 134 | 180 | 6 | 1.3-m | |
| SPECTROSCOPY | ||||||
| Area | Slit centers | Total exp. time | Offsetb | Aperture lengthc | Telescope | |
| (sec) | (arcsec) | (arcsec) | ||||
| South I (SI) | 18h51m40.6s | -00°18′04″ | 7800 (2) | 23.6 N | 13.0 | 1.3-m |
| South II (SII) | 18h51m40.6s | -00°18′04″ | 7800 (2) | 8.3 S | 31.9 | 1.3-m |
| East I (EI) | 18h51m48.6s | -00°09′44″ | 3900 | 37.8 S | 20.1 | 1.3-m |
| East II (EII) | 18h51m48.6s | -00°09′44″ | 3900 | 64.9 S | 10.6 | 1.3-m |
a Numbers in parentheses represent the number of individual frames.
b Spatial offset from the slit center in arcsec: N(North), S(South).
c Aperture lengths for each area in arcsec.
| S | E | N | W | |
|---|---|---|---|---|
| HN ii | 20.8 | 19.8 | 18.7 | 21.3 |
| S ii | 17.5 | 14.7 | 12.3 | 6a |
Fluxes in units of erg s-1 cm-2 arcsec-2
Median values over a 40″ 40″ box.
S=(South), N(=North), W(=West) and E(=East).
a 3 upper limit.
| Area SI | Area SII | Area EI | Area EII | |||||
| Line (Å) | Fa | S/Nb | F | S/N | F | S/N | F | S/N |
| H 4861 | ||||||||
| O i 6300 | 43.5 | (23) | 31.3 | (16) | 31.7 | (33) | 67.0 | (18) |
| [N ii] 6548 | 50.5 | (25) | 54.5 | (25) | 48.6 | (44) | 29.4 | (9) |
| H 6563 | 100 | (45) | 100 | (45) | 100 | (83) | 100 | (26) |
| [N ii] 6584 | 167.6 | (64) | 167.1 | (67) | 135.0 | (101) | 98.8 | (25) |
| [S ii] 6716 | 97.1 | (42) | 93.8 | (41) | 88.1 | (70) | 109.8 | (27) |
| [S ii] 6731 | 74.8 | (32) | 73.9 | (32) | 66.4 | (58) | 74.4 | (19) |
| Absolute H fluxc | 2.5 | 1.9 | 4.6 | 1.8 | ||||
| [S ii]/H | 1.72 0.05 | 1.68 0.05 | 1.54 0.03 | 1.84 0.09 | ||||
| F(6716)/F(6731) | 1.30 0.05 | 1.27 0.05 | 1.33 0.03 | 1.48 0.09 | ||||
| N ii/H | 2.18 0.06 | 2.22 0.06 | 1.84 0.03 | 1.28 0.07 | ||||
| c(H)d | 2.2 | 2.2 | 2.7 | 2.7 | ||||
a Observed fluxes normalized to F(H)=100 and uncorrected
for interstellar extinction.
b Numbers in parentheses represent the signal to noise ratio of the
quoted fluxes.
c In units of erg s-1 cm-2 arcsec-2.
d The logarithmic extinction is derived by c =
1/0.348log((H/H)obs/2.85).
Listed fluxes are a signal to noise weighted average of two fluxes for
area S.
The errors of the emission line ratios are calculated through standard
error propagation.