Soft X-ray excess of clusters: a thermal filament model, and the strong lensing of background galaxy groups
Abstract
The observational and theoretical status of the search for missing cosmological baryons is summarized, with a discussion of some indirect methods of detection. The thermal interpretation of the cluster soft X-ray and EUV excess phenomenon is examined in the context of emission filaments, which are the higher density part of the warm hot intergalactic medium (WHIM) residing at the outskirt of clusters. We derived an analytic radial profile of the soft excess surface brightness using a simple filament model, which provided us a means of observationally constraining the WHIM parameters, especially the total mass budget of warm gas associated with a cluster. We then pointed out a new scenario for soft excess emission, viz. a cluster that can strongly lens the soft X-rays from background WHIM knots. If, as seems quite likely, the missing baryons are mostly in the WHIM halos of galaxy groups, the lensing probability will be quite high ( 10 %). This way of accounting for at least part of a cluster’s soft excess may also explain the absence of O VII absorption at the redshift of the cluster.
Subject headings:
galaxies: clusters; cosmology: large-scale structure of universe1. Introduction
The location of the ‘missing baryons’ in the Universe is an open and important question of contemporary cosmology, as interesting as it is ironic, because the problem manifests itself as a deficit in the mass budget which arises only at low redshifts, i.e. in the space near us. Observationally the total baryonic content in stars, galaxies, and clusters of galaxies ( %, Fukugita et al 1998) is only about half of the amount required by Big Bang Nucleosynthesis models ( %, Burles & Tytler 1998) or from measurements of the cosmic microwave background (, Komatsu et al. 2008 WMAP5, consistent with the Bennett et al 2003 WMAP1 and Spergel et al 2006 WMAP3 results). Cosmological hydrodynamic simulations have shown that this missing 50 % of baryons is concealed in a tenuous filamentary gas of temperature 105 - 107 K, currently referred by many to as the WHIM (the Warm Hot Intergalactic Medium, Cen & Ostriker 1999, Davé et al 2001). It is also possible to derive this result heuristically as follows. Let be a wavelength of bulk motion of the intergalactic medium in the near Universe; when these waves collide and break, the thermal velocity of the shocked gas will typically be , or km s-1 for the cluster size. Thus if gas heating takes place mainly at the ‘nodes’ of cluster-scale mass clumping, the thermal motion would involve a value of that places the gas in the 105-7 K range of temperatures.
Since the arrival of its theoretical prediction, search for the WHIM has been an ongoing effort, with some success but no clinching evidence as yet. At the low end of the WHIM temperature scale, far UV absorption lines have been reported (e.g., Richter et al. 2008, Stocke et al. 2006, Tripp et al. 2006, Savage et al. 2005, Danforth and Shull 2005). At temperatures where the bulk of the WHIM is expected to be, the detection of O VII and O VIII absorption lines in the spectrum of distant quasars (Nicastro 2005) is a more debatable result (Kaastra et al 2006). Although soft X-ray and EUV emission in regions of galaxy concentration (Werner et al 2008, Mannucci et al 2007, Zappacosta et al 2002, Mittaz et al 1998) may also be the signature of warm filaments, the definitive proof of this interpretation, viz. an identifiable line at the appropriate redshift, is still not available. More precisely, the clinching line signature of O VII was claimed (Kaastra et al 2003, Finoguenov et al 2003) and refuted (Lieu & Mittaz 2005, Takei 2008).
We examine if limits can be placed on the WHIM from less direct measurements. The column density of free electrons in the intergalactic medium is proportional to the average WHIM density in a given volume, and it is independent of its state of clumping. To see this, allow the WHIM matter to reside in clumps of number density , each having mass density and radius . By mass conservation inside a large spherical volume of radius R, we have . The average electron column along a random direction and for a given WHIM ionization fraction, being proportional to the product of the mass column of one clump and the number of intercepted clumps , will then , i.e. a constant for any sightline of length that penetrated our large volume.
There are several ways of constraining this electron column. The Sunyaev-Zel’dovich effect (of the WHIM) will be at a very low level, as will reionization, with for characteristic WHIM parameters at the minimum (homogeneous) overdensity of 0.02, viz.
| (1) |
where in obtaining we assumed a fully ionized pure hydrogen plasma. For comparison, the Sunyaev-Zel’dovich effect of a typical massive cluster (K, cm-3, Mpc) is (see Hernández-Monteagudo et al. 2008 for a discussion of the SZE from the WHIM). Another limit might be afforded by the realization that such a column can cause frequency dependent delay on the timescale of minutes to hours in the arrival of 100 MHz emission from distant quasars, except quasars with so rapid a variability as to avail themselves for this test are those very ones affected by plasma scintillations in our local interstellar medium (Dennett-Thorpe and de Bruyn 2002). Angular broadening of quasars caused by WHIM-like scintillation was assessed by Lazio et al 2008, who concluded that the only way of securing a useful observational limit is if an AGN is found to ‘twinkle’ at a position close to that of a pulsar, as data about the latter will enable us to take out the interstellar effects of our Galaxy. Thus, the situation regarding these ‘tangential’ probes is that they too do not deliver any useful verdict.
Here we take a step backwards by returning to the prospect of direct WHIM filament detection at the outskirts of clusters, for reasons that would soon become clear. The most powerful argument for excluding any warm gas association with the central soft X-ray excess of clusters (e.g. Fabian 1996) is the large radiative cooling rate, since the gas (which at 106 K is already at the peak temperature of its cooling curve) has to be clumped to co-exist with the hot cluster medium, making it radiate even faster. On the other hand, the scenario of soft photons seen in projection from a line-of-sight WHIM filament at the cluster’s outskirts is more attractive, not only because the lack of physical contact between the two phases now alleviates the warm gas from its former problems, but also because numerical codes of structure formation (Cen & Ostriker 1999, Davé 2001, Cheng et al 2005) do expect such filaments to preferentially converge at clusters and groups, which are the ‘knots’ of the WHIM network.
The purpose of this paper is to calculate the first analytical formula for the radial profile of soft X-ray surface brightness by employing a simple filament model. We shall see that this already affords a means of placing rather useful observational constraints on the WHIM parameters at the outskirt of a cluster, including and especially the total mass of the warm baryons. We will then propose the possibility of a cluster’s soft excess being due in part to the strong lensing of background WHIM clumps, the largest population of which is galaxy groups. This is quite a radical approach to the problem: it may explain the lack of identifiable O VII absorption at the redshift of the candidate cluster, because if distant WHIM emissions are superposed and focused by the cluster then their O VII absorptions would be likewise, leading to a smearing of the line, or even a ‘re-location’ of the line to an altogether different redshift.
2. Difficulties with a straightforward WHIM interpretation of the cluster soft X-ray excess
We examine more carefully why the idea mentioned in the previous section of the central soft excess being emitted by warm intracluster gas unrelated to the WHIM was not well received. Since the center of a cluster is permeated by the hot X-ray gas at (or close to) the virial temperature, the warm component can only exist for any conceivable length of time if it is clumped into dense clouds to ensure pressure equipartition between the two phases. Now the typical parameters of the hot gas are a few keV and 10-3 cm-3, and because the pressure requirement implies equality of the products , we have 0.01 cm-3 for these clouds. The immediate problem is the radiative cooling time,
| (2) |
which means the cloud cools and collapses on a timescale far shorter than the age of a cluster: it is thermally unstable (note that in eq. (2) we omitted the contribution from line emission which will reduce even more). Apart from cooling, the cloud has difficulty in sustaining itself against photo-ionization by the hot gas, which occurs in a time for O VII, where is the X-ray flux from the gas. Moreover, any ‘balance’ that may result from the two opposing mechanisms of cooling and ionization is bound to be extremely precarious.
In Section 1 we also presented the cluster’s soft X-ray excess emission as possible evidence for the WHIM. Among the possible models for the soft excess (e.g., see review by Durret et al. 2008) is the Cheng et al. (2005) proposal of very dense gas in pressure equilibrium associated with merging structures within clusters. This model relieves the cooling problem described above in this section, since its non-equilibrium emission can be sustained for periods longer than those calculated in Equation 2. Alternatively, the WHIM may be seen in projection against the cluster’s X-ray emission, although the filaments’ brightness is approximately one order of magnitude too faint to explain the soft excess flux (e.g., Dolag et al. 2006; Mittaz et al. 2004). To date, the soft excess has been detected in several clusters at low redshift; the Bonamente et al. (2002) blind survey of the excess emission found that % of the clusters have statistically significant evidence for the excess. Since clusters with high S/N observations preferentially have soft excess, the previous statistic is probably a lower limit. The excess flux is typically % relative to the hot ICM contribution in the soft X-ray band, with a trend of increasing relative flux at larger radii (e.g., Lieu et al. 1999).
Let us now elaborate on the filament origin of the soft excess, by adopting as representative WHIM parameters those of the thermal model of Coma cluster’s soft excess, as listed under ‘warm component 1’ of Lieu et al 1996, Table 3 (see also Tables 2 and 3 of Bonamente et al 2003) 111According to Lieu et al. (1996), the warm component in the 0–3 and 9-12 arcmin regions has a spectral normalization constant of and , respectively; this normalization is proportional to the EM via . We select two regions, the 0 – 3 arcmin and 9 – 12 arcmin annuli, to investigate if the radial profile of soft X-ray surface brightness can accommodate the filament model. For these regions the temperature is still 0.1 keV, but it is the emission integral of the optically thin gas filament, with the value
| (3) |
for 0 – 3 arcmin, where and are respectively the effective length and cross-sectional area of the emitting column, and EM is the emission measure (or column density of emission), that has the physical significance. For a redshift of 0.0232 and a Hubble constant of 0.7, we have 2.15 1047 cm2. Hence the effective length of the filaments (i.e. the total length of sections of emitting plasma (that may belong to different filaments) intercepted by the line of sight) is
| (4) |
Moving outwards to the 9 – 12 arcmin annulus, is found to fall by 3.5 times. The observed EI rises by 2.3 times from the value in Equation 3, viz. EI 1.10 1066 cm-3, causing to decrease by three times because the projected area of this annulus is seven times larger than that of the 0 – 3 arcmin circle. Beware that if the electron density of 10-3 cm-3, which corresponds to a rather large WHIM overdensity of 200, is lowered, will easily become 1 Mpc, i.e. the filaments will have a dimension far exceeding the cluster scale, placing them at ‘intercluster’ venues which further makes it harder to justify the use of 200.
3. Analytic radial profile of the soft X-ray surface brightness of WHIM filaments
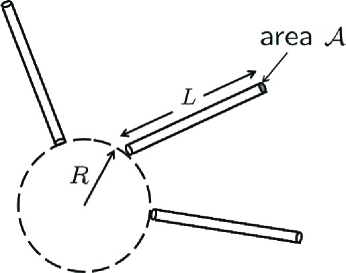
The filament model, viz. linear emitters protruding outwards from beyond some cluster radius, can account for the radially rising trend of the soft X-ray excess reported by observations (Durret et al. 2008; Bonamente et al 2002, 2001; Lieu et al 1999). Yet the surface brightness profile of such a configuration was never evaluated even under the simplest scenario to see if this ‘promise’ is deliverable. We attempt to do so here, by invoking a model of filaments, each of length , cross sectional area , and electron density , which converge to cover a fraction (by area) of the spherical surface at some radius - the radius of filamentary ‘footpoints’ (see Figure 1). The WHIM filling factor at any radius is then given by
| (5) |
The soft X-ray surface brightness of the WHIM, for a line of sight with impact parameter , is then given by , in which is the WHIM plasma emissivity, and the emission measure
| (6) |
where for and for .
The integral of eq. (6) may readily be evaluated, yielding
| (7) |
The two results match each other smoothly at the ‘footpoint’ radius (as they should), and this is also the radius of maximum brightness. Beyond , falls off with as where is the angular distance away from the cluster center. Beneath , however, EM is almost a constant, changing (decreasing) only slightly from at to at . Since we understood from section 2 why the footpoints have to be at a few Mpc to ensure ‘segregation’ between the warm and hot gases, and since all the observations of the rising radial trend of soft excesses (see references above) have thus far involved physical radii less than a few Mpc, this means it is the behavior of EM that matters. The encouraging news is that here, the near flatness of the profile over the entire scale height of the virialized X-ray cluster emission can account for the observed trend of the relative soft excess.
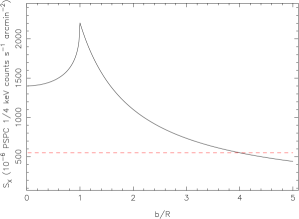
In order to compare this model with the Bonamente et. al (2003) measurements of the soft X-ray surface brightness in the neighborhood of the Coma cluster, we plot in Figure 2 the surface brightness for the parameter values Mpc, cm-3, , and with the emissivity being that of a plasma at keV, metal abundance , and averaged over the ROSAT 1/4 keV band using the APEC model of Smith et al. (2001) at counts cm3 s-1. The red line in Figure 2 represents the 1/4 keV ROSAT All-Sky Survey background within 2-5 degrees of Coma. Given that the excess emission at the outskirts of Coma is on par with the local 1/4 keV background, we see that the filament model can account for the observed magnitude of the outer soft excess.
Such a simple model yields no central peaking of the absolute surface brightness, which could be a consequence of radial dependence in , , or ; although in this paper we would like to discuss an altogether different mechanism that might also play an important role. Note that the effective emission length is irrespective of the actual filament length . The parameter does determine the total mass of the WHIM associated with the cluster, which is
| (8) | |||||
Eq. (8) constrains the filament model: there is far less room for manipulation of the parameters and than previously thought (EM is fixed by observations), and arbitrary choice of their values can easily lead to an unacceptable proliferation of the mass budget.
4. The mass profile of a cluster of galaxies
Before discussing the way in which lensing by a cluster’s gravitational field can affect its soft excess emission, we first summarize our understanding of the mass distribution of clusters, which is found to follow the generalized NFW profile (see Mahhavi et al 2007 for a review). Although in the ‘authentic’ version of it (Navarro et al 1995, 1996, 1997) the density for small , steepening gradually to at intermediate and finally reaching at large , the points at which these transitions occur are not sharp (i.e. the index of changes gradually and continuously), and are determined by the core radius and concentration parameter, both of which can vary from cluster to cluster.
Especially for the inner radii, there is considerable debate about the form of . For example, Tonini et al. (2006) and Schmidt and Allen (2008) find flatter than a dependence, Navarro et al. (2004) and Diemand et al. (2004, 2005) find inner slopes consistent with the slope ( with ), while Moore et al. (1998) determined an inner slope of 1.4. In any case, even those who favor a more gentle slope of 1 invoked high concentration parameter that indicates considerable mass inside these relatively smaller radii. Moreover, little is known about the nuclear region of 10 kpc, where the frequent presence of a bright central galaxy could cause a re-steepening of the slope.
We shall adopt the best-fit NFW profile of the combined Subaru and Hubble ACS data of the cluster Abell 1689 (Broadhurst et al 2005, Diego et al 2005), which represent a comprehensive, model independent weak and strong lensing mass survey of the cluster, as a sufficiently representative mass profile for the purpose of this paper. From Table 3 of Broadhurst et al 2005 one finds the SIS density scaling of between approximately 27 kpc and 430 kpc. At the (14 – 27) kpc radii the slope has still not reached 1, and further inwards are terra incognita: as already mentioned the value of here could increase again. The normalization for within the SIS zone corresponds to an enclosed mass per unit radius of
| (9) |
irrespective of the value of the Hubble constant .
The choice of Abell 1689 as a representative case is motivated by the following considerations. Abell 1689 is a very relaxed massive cluster, according to the morphology of its X-ray emission (e.g., Xue and Wu 2008), with no evidence of significant substructure; moreover, the mass profile based on the lensig data of Broadhurst et al. (2005) is smooth in the region of interest, lending further support to its relaxed nature; finally, the lensing data for this cluster is of the highest quality available.
5. Gravitational lensing of soft X-ray emission from background WHIM clouds
In setting up the prerequisites let be the impact parameter of a light ray under the influence of some spherically symmetric cluster lens, and that of the same ray in the absence of the lens. Since the lens does not expand with the Hubble flow, and are physical dimensions independent of the epoch of lensing. Provided falls within the SIS part of the cluster mass profile, i.e. satisfies where the two limits were defined in section 4, the deflection angle will be given by
| (10) |
(see e.g. Lieu & Mittaz 2005). Essentially is a constant within this SIS zone: it ranges from at to at . Adopting the former, and applying eq. (9), one obtains which we shall henceforth approximate as
| (11) |
The lens equation
| (12) |
then simplifies to
| (13) |
where we defined
| (14) |
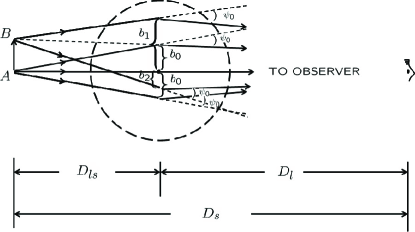
and the reader is referred to Figure 3 for the meaning of the various comoving distance indicators on the right side of eq. (13).
Now consider a small element of the background source that maps to an element on the lensing plane defined by radial and transverse intervals and , with an area of . When the lens is removed, the rays from this same source element would pass through another element with area . The area (or brightness) magnification of this element due to lensing is therefore
| (15) |
The modulus signs are needed because the ratio can be negative if caustics are involved, leading to image reversals.
We proceed to identify the region of strong lensing, which has the characteristic scale length given by the circular caustic that are images of the central spot, where the magnification is infinite. This limiting radius, known as the Einstein radius , is fixed by the condition which becomes, after applying eq. (12),
| (16) |
For finite whilst maintaining , we have from eq. (12)
| (17) |
For the right side of eq. (15) is positive. For , however, it is negative, and the source pixel is on the other side of the optical center as the image pixel, with values of differing by ; images here are reversed. In this case we can still write
| (18) |
Thus for every source pixel with there are two image circles, with radii . As shown in Figure 3, a small and centrally aligned source disk of radius is imaged twice, once onto the annulus between and and once, reversed, onto the disk . For this source, it’s clear that , so the magnifications of the two images are, from eq. (14),
| (19) |
The total magnification is . Hence a centrally aligned source of projected physical radius , or area on the lensing plane and without the lens, will become four times brighter with the help of the lens, because it will then occupy the new area of
| (20) |
Further, according to eq. (18) a smaller aligned source will be magnified by even more, while a much larger source will not be affected very much at all, i.e. it will only be weakly lensed.
There are two limiting scenarios of relevance to WHIM emissions. If a WHIM source lies closely behind the cluster because it is a filament section visible to the observer, we will have , , and the physical size of the source will also be . Hence the strong lensing criterion of would imply a filament width . Since where 5 Mpc is the scale length of a filament, we obtain after applying eq. (11) the requirement of 5 kpc. It would seem unlikely that WHIM filaments are as thin as this. Perhaps an even more serious problem is the smallness of the impact parameters for rays from such a source, as 5 kpc also, i.e. now the lensing takes place inside the nuclear part of the cluster where, as already discussed in section 4, the density profile is not well known and is probably , which gives rise to less lensing than that of the SIS profile currently being considered. In any case, the effect of this kind of brightening process is spatially very limited, it will at best enhance the soft excess in the central few kpc of the cluster which is not easily resolved by X-ray observatories.
The more interesting second possibility is one that involves distant background WHIM clouds, which could find themselves lying directly behind our optical center because as will be shown below the scenario under which any random sightline may intercept one of these clouds with appreciable chance is not so demanding. Assuming (reasonably) that the WHIM network extends to a distance 1 Gpc behind the cluster and the observer is much closer to the cluster than that, we now have , , but the strong lensing criterion of still constrains the physical radius of the source to . For a ‘mid-way’ source of 0.5 Gpc this yields 0.5 Mpc with the help of eq. (11). The lensing is then ‘self consistent’ because it falls within the SIS zone of the cluster, and moreover soft X-ray emitting WHIM clouds with scale sizes 0.5 Mpc or smaller are found by both simulations (see Figure 7 of Mittaz et al 2004a) and observations (see Soltan et al 1996, 1997 and Finoguenov et al 2007, especially the last paper) to be associated with galaxy groups and galaxy halos.
In fact, if all of the 1.56 10 Mpc-3 population of galaxy groups of the ESO survey (Ramella et al 2002) possesses soft X-ray halos of 0.5 Mpc radius and at a density of 10-3 cm-3, this would be sufficient to account for all the missing baryons of section 1 as WHIM constituents. The halo interception probability by a sightline through the cluster center (or any sightline) is
| (21) | |||||
for 0.7, and is by no means negligible as already mentioned. The product of and the emission measure of EM per halo gives the average EM for the sightline in the same form as it was used it sections 2 and 3. It is
| (22) | |||||
for 0.7. Without strong lensing, EM is as given by eq. (21) and is 2.5 times below even the brightness of Coma’s 9 – 12 arcmin soft excess, section 2. It is therefore barely distinguishable from the background. With lensing, however, EM is enhanced by a factor 4, eq. (19), and can now account for 50 % of the 0 – 3 arcmin soft excess.
Moreover, the lensed flux is superposed over a cluster radius of where is defined in eqs. (15) and (13). For the value of 0.5 Mpc we adopted, and using 100 Mpc as Coma’s distance, we obtain 0.17 Mpc assuming a flat Universe where , whereas the mean physical radius of Coma’s 9 – 12 arcmin annulus is 0.31 Mpc. Thus the flux is not dispersed into a large area that includes the outskirts; rather, it affects a substantial and resolvable part of the cluster’s core region. This can then represent a non-negligible fraction of the soft excess there. Note that the calculation here is conservative, because each background WHIM halo was treated as uniform. If their emissions are centrally peaked (due e.g. to a radial scaling of the filaments’ density, cross sectional area, or length, section 3), the strong lensing will enhance the surface brightness of these peak regions by more than a factor of four, eq. (18), and the resulting observed brightness profile of soft X-rays will likewise be even sharper and more interesting. Under such a scenario, lensing of background halos could account for all of the inner soft excess of some clusters.
Given the degrees of freedom of our present model and the uncertainty in the mass profile gradient, it is not possible to establish with certainty what fraction of the excess is due to strong lensing. Our estimate of a 10% probability of lensing, together with the detection of soft excess in 50% of the clusters, suggests that additional mechanisms are responsible for the excess, especially at large radii. Thermal emission due to dense gas (Cheng et al. 2005) or by the filaments themselves (e.g., Mittaz et al. 2004; Dolag et al. 2006), or non-thermal emission (e.g., Sarazin and Lieu 1998; Blasi and Colafrancesco 1999) are viable alternatives to complement the contribution due to the lensing effect.
6. Conclusion
Although there are various indirect ways of detecting the WHIM and confirming (or refuting) the hypothesis that most of the missing baryons at low redshift are in this phase, the more promising search would still appear to be those involving emission and absorption of soft X-rays in the vicinity of clusters of galaxies where the WHIM is expected to congregate.
In this paper we developed a simple model of WHIM filaments to account for the surface brightness profile of the outer cluster soft X-ray excess, in particular the radial rise of the fractional excess relative to the normal X-ray emission. The inner excess, however, necessitates a separate intepretation. We propose that this is due to the strong lensing of background soft X-ray halos (most likely associated with galaxy groups) by the central gravitational potential of clusters. When applied to the Coma cluster, using reasonable parameters for these halos, we have the prospect of explaining 50 % of the 0 – 3 arcmin soft excess The calculations in this paper invokes filaments of constant length, cross-sectional area and electron density, and thus they must be considered as a proof-of-principle for a more realistic model; for example, one which allows the filament properties to change with cluster radius. In the case of some clusters, a possible additional contribution to this excess is the strong lensing by the cluster of WHIM emissions associated with background galaxy groups. If a central gradient is present in the the emission of some of these aligned sources, the lensing will be particularly effective, and will further modify the soft excess profile of the candidate cluster.
References
Bahcall, N., 1998, ARA&A, 26, 631.
Blasi, P. and Colafrancesco, S. 1999, APh 12, 169
Bonamente, M., Lieu, R., & Mittaz, J.P.D., 2001, ApJ, 547, L7.
Bonamente, M., Lieu, R., Joy, M., & Nevalainen, J., 2002, ApJ, 576, 688.
Bonamente, M., Joy, M., & Lieu, R., 2003, ApJ, 585, 722.
Broadhurst, T., Takada, M., Umetsu, K., Kong, X., Arimoto,
N., Chiba, M., &
Futamase, T., 2005, ApJ, 619, L143.
Cheng, L. -M. et al, 2005, A & A, 431, 405.
Danforth, C., Shull, M., 2005, ApJ, 624, 555.
Dennett-Thorpe, J., & de Bruyn, A.G., 2002, Nature, 415, 57.
Diego, J. M., Sandvik, H. B., Protopapas, P., Tegmark, M.,
Ben tez, N., &
Broadhurst, T., 2005, MNRAS, 362, 1247.
Diemand, J., Moore, B. and Stadel, J. 2004, MNRAS, 353, 624
Diemand, J., Zemp, M., Moore, B., Stadel, J and Carollo, M. 2005, MNRAS, 364, 665
Dolag, K. and Meneghetti, M. and Moscardini, L. and Rasia, E. and Bonaldi, A., 2006, MNRAS, 370, 656
Durret, F., Kaastra, J. S., Nevalainen, J., Ohashi, T., & Werner, N. 2008, Space Science Reviews, 134, 51
Finoguenov, A., et al, 2007, ApJS, 172, 182.
Hernández-Monteagudo, C., Trac, H., Verde, L. and Jimenez, Raul 2008, ApJ 652, 1. Kaastra, J., et al, 2006, ApJ, 652, 189.
Komatsu, E. et al. 2008, arXiv:0803.0547v2
Lazio, T.J.W., 2008, ApJ, 672, 115.
Lieu, R., Bonamente, M., Mittaz, J.P.D., Durret, F., Dos
Santos, S., &
Kaastra, J.S., 1999, ApJ, 527, L77.
Lieu, R., & Mittaz, J.P.D., 2004, ASSL, 309, 155 (astro-ph/0409661).
Lieu, R., & Mittaz, J.P.D., 2005, The Identification of
Dark Matter, p18,
World Scientific, Singapore (astro-ph/0501007).
Lieu, R., & Mittaz, J.P.D., 2005, ApJ, 628, 583.
Mahdavi, A., Hoekstra, H., Babul, A., Sievers, J., Myers,
S. T., &
Henry, J. P., 2007, ApJ, 664, 162.
Mannucci, F., Bonnoli, G., Zappacosta, L., Maiolino, R.,
& Pedani, M.,
2007, A & A, 468, 807.
Mazzotta, P., Mazzitelli, G., Colafrancesco, S., & Vittorio, N., 1998, A & AS, 133, 403.
Mittaz, J.P.D., Lieu, R., & Lockman, F.J., 1998, ApJ, 498, L17.
Mittaz, J.P.D., Lieu, R., & Cen, R., 2004a, ASSL, 309, 171 (astro-ph/0409661).
Mittaz, J., Lieu, R., Cen, R., & Bonamente, M., 2004b, ApJ, 617, 860.
Moore, B., Governato, F., Quinn, T., Stadel, J., & Lake, G., 1998, ApJ, 499, L5.
Navarro, J.F., Frenk, C.S., & White, S.D.M. 1995, MNRAS, 275, 56.
Navarro, J.F., Frenk, C.S., & White, S.D.M. 1996, ApJ, 462, 563.
Navarro, J.F., Frenk, C.S., & White, S.D.M. 1997, ApJ, 490, 493.
Navarro, J.F. et al. 2004, MNRAS, 349, 1039
Ramella, M., Geller, M.J., Pisani, A., & da Costa, L.N., 2002, AJ, 123, 2976.
Richter, P., Paerels, F. B. S. and Kaastra, J. S. 2008, Space Science Reviews, 134, 25.
Savage, B., Lehner, N., Wakker, B., Sembach, K., Tripp, T., 2005, ApJ, 626, 776.
Schmidt, R.W. and Allen, S.W. 2007, MNRAS, 379, 209.
Smith, R., Brickhouse, Nancy S., Liedahl, D. and Raymond, J., 2001, ApJ, 556, L91.
Snowden, S., Egger, R., Finkbeiner, D., Freyberg, M., Plucinsky, P., 1998 , ApJ, 493, 715
Soltan, A. M., Hasinger, G., Egger, R., Snowden, S., & Truemper, J., 1997, A & A, 320, 705.
Soltan, A. M., Hasinger, G., Egger, R., Snowden, S., & Truemper, J., 1996, A & A, 305, 17.
Stocke, J., Penton, S., Danforth, C., Shull, M., Tumlinson, J., McLin, K. 2006, ApJ, 641, 217.
Tonini, C., Lapi, A., & Salucci, P., 2006, ApJ, 649, 591.
Tripp, T., Aracil, B., Bowen, D., Jenkins, E., 2006, ApJ, 643, 77.
Xue, S.-J. and Wu, X.-P. 2008, ApJ, 576, 152
Werner, N., Finoguenov, A., Kaastra, J.S., Simionescu, A.,
Dietrich, J.P.,
Vink, J., & B hringer, H., 2008, A & A, n482, L29.
Zappacosta, L. et al. 2002, A & A, 394, 7.