A CO emission line from the optical and near-IR undetected submillimeter galaxy GN10
Abstract
We report the detection of a CO emission line from the submillimiter galaxy (SMG) GN10 in the GOODS-N field. GN10 lacks any counterpart in extremely deep optical and near-IR imaging obtained with the Hubble Space Telescope and ground-based facilities. This is a prototypical case of a source that is extremely obscured by dust, for which it is practically impossible to derive a spectroscopic redshift in the optical/near-IR. Under the hypothesis that GN10 is part of a proto-cluster structure previously identified at in the same field, we searched for CO[4-3] at 91.4 GHz with the IRAM Plateau de Bure Interferometer, and successfully detected a line. We find that the most likely redshift identification is , based on: 1) the very low chance that the CO line is actually serendipitous from a different redshift; 2) a radio-IR photometric redshift analysis; 3) the identical radio-IR SED, within a scaling factor, of two other SMGs at the same redshift. The faintness at optical/near-IR wavelengths requires an attenuation of –7.5 mag. This result supports the case that a substantial population of very high- SMGs exists that had been missed by previous spectroscopic surveys. This is the first time that a CO emission line has been detected for a galaxy that is invisible in the optical and near-IR. Our work demonstrates the power of existing and planned facilities for completing the census of star formation and stellar mass in the distant Universe by measuring redshifts of the most obscured galaxies through millimeter spectroscopy.
Subject headings:
galaxies: formation — cosmology: observations — infrared: galaxies — galaxies: starburst — galaxies: high-redshift — submillimeter1. Introduction
Dust extinction at UV and optical rest frame wavelengths is a major obstacle for obtaining a complete sampling of star formation in the distant Universe. GN10 (also known as GOODS 850-5) is one of the most striking examples of an extremely obscured dusty galaxy. Discovered as a submillimeter emitting galaxy (SMG) by Wang, Cowie and Barger (2004; mJy), it was later confirmed as one of the brightest galaxy in the GOODS-N region at wavelengths between m and 1.25mm (Pope et al. 2006; Dannerbauer et al. 2008; Greve et al. 2008; Perera et al. 2008). Its accurate position on the sky was obtained through interferometric observations of the dust continuum by Wang et al. (2007) with SMA at 870m and by Dannerbauer et al. (2008) at 1.25mm with the IRAM Plateau de Bure Interferometer (PdBI) as well as in the radio at 1.4 GHz with the Very Large Array. The dust continuum emission in the submillimeter and millimeter regime corresponds to an extreme luminosity of order and a star formation rate of order 1000 yr-1, provided that it is at . Despite its huge ongoing star formation activity, the galaxy is undetected in the highly sensitive Hubble Space Telescope (HST) ACS imaging of Giavalisco et al. (2004) down to limits of AB magnitudes, and the galaxy is also undetected to similar levels in the deep near-IR imaging with Subaru and HST+NICMOS of Wang et al. (2009), while a faint but significant emission is seen in the GOODS Spitzer+IRAC data (Pope et al. 2006; Dickinson et al. in preparation).
Dannerbauer et al. (2008) estimated a redshift of for this galaxy using spectral energy distribution (SED) fitting and employing the radio-IR relation, while Wang et al. (2007) suggested an even higher , interpreting the very red m color as being due to a strong, redshifted Balmer/4000Å break from an evolved stellar population. Due to its faintness, it is practically impossible to measure the redshift of GN10 by ordinary means of optical or near-IR spectroscopy. A MIPS flux density of Jy makes it impossible to obtain a redshift with the Spitzer Infrared Spectrograph (IRS), a technique that has been successfully used for SMGs (Menéndez-Delmestre et al. 2007; Pope et al. 2008). The search for CO emission lines, successfully detected in SMGs (review by Solomon & van den Bout 2005), seems to be the only way of measuring a redshift for GN10 before the launch of JWST or the realization of m optical/near-IR telescopes. However, the most sensitive radio and millimeter facilities have quite limited bandwidths, which complicate blind line searches. For example, 3mm observations with the PdBI cover the range of , requiring an accurate foreknowledge of the redshift for CO observations.
Daddi et al. (2009; D09 henceforth) proposed a new radio-IR photometric redshift technique capable of obtaining accuracies of for SMGs. However, this accuracy is still not sufficient for blind CO follow-up. D09 also reported the discovery of a proto-cluster structure at in GOODS-N that includes two SMGs (GN20 and GN20.2a). GN10 has a radio-IR photometric redshift consistent with being part of this proto-cluster structure.
In this letter we report on IRAM PdBI observations of GN10, searching for a possible emission line of CO at based on the hypothesis that GN10 is indeed part of the proto-cluster structure.
2. Observations, data reduction and analysis
We observed GN10 with the IRAM PdBI using the full array (with 6 antennas) for 4.0 hours on source on May 27th 2008 in D-configuration (synthesized beam of ), for 3.8 hours on November 27th 2008 in the C-configuration (synthesized beam of ), and for 6.8 hours on December 29th 2008 and January 5th 2009 in B-configuration (synthesized beam of ). A tuning frequency of 91.375 GHz was used, with a correlator setup yielding a bandpass of 1 GHz with two polarizations. In the B- and D-configuration observations GN10 was 19.7′′ away from phase center, suffering a primary beam attenuation (PBA) of 30%. Those data were obtained while observing a galaxy at as part of a CO survey of normal galaxies described in Daddi et al. (2008; and in preparation). In the C-configuration observations the phase center was at 9.7′′ away from GN10, leading to a PBA of 8%.
We reduced the data with the GILDAS software packages CLIC and MAP, similarly to what is described in D09 and Daddi et al. (2008). The maps obtained using natural weights have noise levels (for the full 1 GHz bandpass) of 113Jy beam-1, 87Jy beam-1 and 63Jy beam-1 for the D-, C- and B-configuration data, respectively.
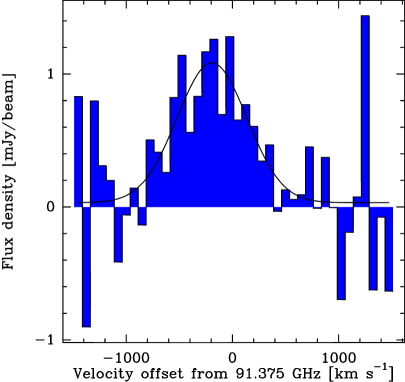
We extracted spectra by independently fitting the reduced uv data of the D-, C- and B-configuration observations sampled with 75 km s-1 spectral bins, using a point source model. We corrected each spectrum for the PBA and averaged them with weighting according to the different noise levels. Fig. 1 shows the result: significant emission is detected, consistent with a CO emission line centered at km s-1 (all velocities are given relative to the tuning frequency) and with a velocity FWHM of km s-1. Integrating the spectrum from -812.5 km s-1 to 387.5 km s-1 (i.e., a total bandwidth of 1200 km s-1) results in a detection with and a flux density of mJy. Integrating the spectrum outside the detected emission line results in a continuum estimate of mJy. Assuming this value for the continuum emission, and accounting for its uncertainty, we derive an integrated flux of Jy km s-1 for the emission line, which is consistent with what found from the Gaussian fit shown in Fig. 1.
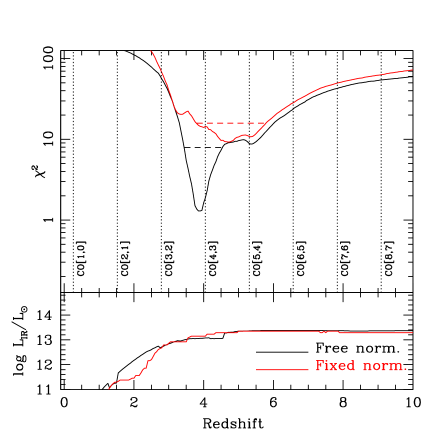
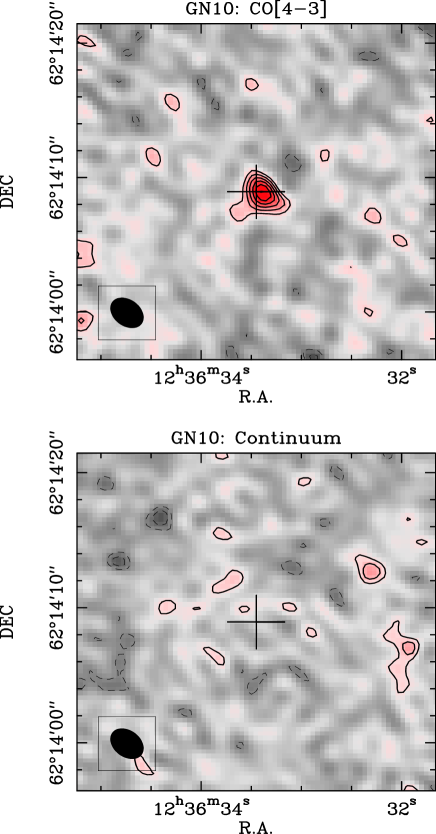
Fig. 2 shows the line (top) and continuum (bottom) maps obtained combining the data from all configurations using natural weighting (resulting in a synthesized beam of ). The emission line is clearly detected, only 0.4′′ to the West of the 1.25mm continuum position of GN10 measured by Dannerbauer et al. (2008; see cross in Fig. 2, top), a small offset which is not significant.
The line does not appear to be significantly resolved. A fit to the combined B-, C- and D- configuration visibilities with a circular Gaussian model results in a FWHM.
3. Redshift identification
The detection of our single CO emission line at 91.4 GHz fixes the redshift as one of , in the case that the observed transition is 111 Detections of other lines (e.g., CI or HCN/HCO+) are unlikely, as they are typically much fainter than the CO lines. We find that there are several convincing reasons supporting the identification of the line with CO[4-3], corresponding to . This is based on 3 lines of argument, discussed in detail in the following.
First, this line is not serendipitously detected. We obtained these PdBI observations in order to verify if GN10 is part of the proto-cluster structure identified by D09 in the GOODS-N field. Our observations searched for possible CO[4-3] emission over the fairly narrow redshift range of . The would place GN10 well inside the velocity range of the proto-cluster structure in GOODS-N (see Fig. 13 in D09) which also includes two other CO detected SMGs (GN20 at and GN20.2a at ; D09), as well as 12 other optically-selected galaxies with concordant optical spectroscopic redshifts (D09; Stern et al., in preparation). The probability of a CO line being detected by chance in our 1 GHz bandwidth is of order of 2%. We thus consider it unlikely that we might have detected a different CO transition from another redshift.
| R.A.CO | DECCO | zCO | |||||||
|---|---|---|---|---|---|---|---|---|---|
| J2000 | J2000 | Jy km s-1 | km s-1 | K km s-1 pc2 | mag | ||||
| 12:36:33.389 | 62:14:08.94 | 4.04240.0013 | 0.860.16 | 770200 | 3.40.6 | 2.70.5 | 5.0–7.5 |
Note. — Coordinates are from the CO[4-3] emission. Their formal error is 0.1′′ for both R.A. and DEC. All CO-related quantities are based on the measurement of the CO[4-3] emission. The molecular gas mass derivation assumes that the CO[1-0] and CO[4-3] transitions have the same brightness temperature and a conversion factor (K km s-1 pc2)-1. The stellar mass is fairly uncertain (see text), given the extreme reddening of the source. is given for a Calzetti et al. (2000) reddening law.
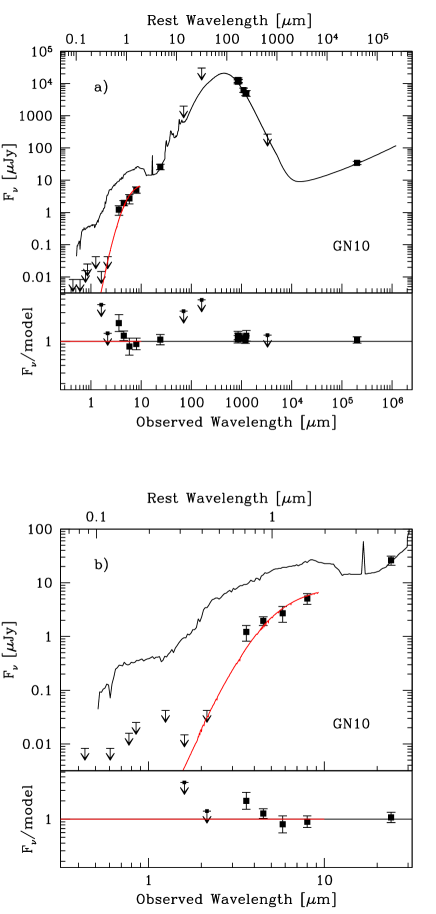
The line identification is also supported by the radio-IR photometric redshift technique of D09, calibrated on SMGs with (of which 3 at ) and found to provide an accuracy of . The 1.25mm measurement from Greve et al. (2008; mJy) is consistent with those at similar wavelengths from Dannerbauer et al. (2008; mJy) and Perera et al. (2008; mJy), and is included in our analysis as well as the new 3mm upper limit ( mJy; ) obtained in this work. We use these in addition to the m, 850m and 1.4 GHz flux density measurements that were already considered in D09. We compared the radio-IR observations of GN10 to template SEDs of local IR luminous galaxies taken from the Chary & Elbaz (2001) library (CE01 henceforth). Fig. 3 shows the results. When the intrinsic normalization of the CE01 templates is kept fixed, the 99% confidence range for the radio-IR photometric redshift is consistent with the identification of the emission line as either CO[4-3] at or CO[5-4] at . Treating the CE01 templates normalization as a free parameter, we can obtain a much better fit ( versus ). In this case, CO[4-3] at z=4.042 is the only identification consistent with the photometric redshift. Based on the expected accuracy of this radio-IR photometric redshift technique, this analysis is not consistent with the higher redshift () proposed by Wang et al. (2009), but it is consistent with the estimate from Dannerbauer et al. (2008). The best–fitting CE01 template has an intrinsic (throughout the paper we assume a WMAP5 cosmology), renormalized by the fitted factor of 8.3 to a luminosity of . The fixed-normalization approach yields a very similar value for the infrared luminosity, as can be seen in the bottom panel of Fig. 3. It is reassuring that the same CE01 template was also found to provide the best fit for GN20, at nearly the same redshift (D09). This is consistent with the general result that distant SMGs have spectral shapes (or color ratios) in the radio-IR that are similar to those of galaxies with . Fig. 4 shows the best–fitting CE01 template overlaid on the observed photometric measurements for GN10. The bottom panel shows the ratio between the model and the observed data. For wavelengths larger than 10m, the dusty CE01 template provides a good fit to the data. For wavelengths shorter than m, the measured flux densities of the galaxy are fainter than the model prediction, indicating that the source is very heavily obscured by dust, as discussed in the next Section.
Finally, we note that the radio-IR SED of GN10 is virtualy identical to those of GN20 and GN20.2a that are securely confirmed to be at (D09). Scaling them down by a factor of 1.8, all the flux measurements for GN20 at radio-IR wavelengths agree with GN10 within the uncertainties, including the CO[4-3] emission line flux. A similar picture holds for GN20.2a (the exception is its 1.4 GHz flux that is likely affected by AGN emission, see D09). This is a remarkable degree of uniformity, to the % level of the various measurement errors, in the dust continuum and CO properties. Given that the radio-IR flux ratios are in general a very strong function of redshift, this is strong evidence that the redshift of GN10 is very close to that of GN20 and GN20.2a.
Although a detection of additional emission lines of CO will be required to definitely confirm the redshift identification, we conclude that, based on the 3 arguments presented above, there is already compelling evidence for identification of the line as CO[4-3] at . We assume this identification in the remainder of the paper.
4. Discussion
Identification of the line as CO[4-3] at implies a CO luminosity of K km s-1 pc2. The IR to CO luminosity ratio of GN10 is /(K km s-1 pc2). This is very similar to those of GN20 and GN20.2a (D09). Using a conversion factor of (K km s-1 pc2)-1, we estimate a total molecular gas mass of assuming that CO[4-3] is thermalized.
The radio flux of Jy (Dannerbauer et al. 2008) corresponds to W Hz-1. Together with our estimate of , GN10 lies on the local radio-IR correlation (e.g., Yun et al. 2001), as found also for GN20 (D09).
While the SEDs of GN10, GN20 and GN20.2a are very similar at radio-IR wavelengths, the galaxies are quite different at wavelengths shorter than 10m, where the light is dominated by the emission of stars. GN20 and GN20.2a are classified as B-band dropouts in the HST+ACS imaging, and both are relatively luminous and blue in the UV rest frame. This indicates a relatively low extinction by dust. Instead, GN10 is undetected at UV and optical rest frame wavelengths, implying overall a very strong extinction of the stellar light by dust.
It seems likely that the dust extinction in these galaxies is not homogeneous. Among the few known SMGs with confirmed CO redshifts , GN20, GN20.2a and the SMG by Capak et al. (2008; see also Schinnerer et al. 2008) all have significant offsets of order of or more between the detected (and relatively blue) UV emission and the radio or CO positions. This suggests a complex dust distribution with ‘holes’ that, in some cases, allow us to directly observe the emission from stars. In the case of GN10, however, the UV/optical light seems to be wholly obscured along our line of sight.
We now discuss what levels of extinction and reddening are required to explain the observed properties of GN10. We can use the photometry comparison to GN20 and GN20.2a to derive a first guess of the amount of extinction present, assuming that to first order the stellar mass to IR continuum luminosity ratio is the same within these galaxies. Normalizing the galaxies SEDs at wavelengths longer than 10m, GN10 is found to be mag fainter in the IRAC bands (observed 0.7–1.6m rest frame) than both GN20 and GN20.2a. For a Calzetti et al. (2000) attenuation law this corresponds to mag. If we fit the UV rest frame to near-IR rest-frame SED with constant star formation models from the Maraston (2005) library, this requires an even larger mag, mainly to be consistent with the very deep flux limit from the K-band observations of Wang et al. (2009).
Fig. 4 shows this fit (red curve in the top panel) and its residuals (bottom panel). The fit is redder than the trend suggested by the IRAC bands. Fitting only the IRAC bands would suggest again a reddening of mag. The K-band flux density upper limit by Wang et al. (2009) shown in Fig. 4 is derived for a 0.6′′ aperture, but the stellar light might be well distributed over a larger region. In such a case a less stringent K-band upper limit would be allowed, and solutions with less attenuation than mag would become plausible. We conclude that there is evidence for extreme obscuration, likely at some level between –7.5 for a Calzetti law. The fits imply a stellar mass of about (Chabrier IMF) for GN10. Given the case for extreme obscuration, this stellar mass estimate should be treated with some caution.
We note that the large CO[4-3] line width of about 770 km s-1 (very similar to those for GN20 and GN20.2a) suggests a large dynamical mass, assuming that the size of the CO emission is typical (e.g., a few kpc; Tacconi et al. 2006). This would be consistent with the stellar mass that we derive. That stellar mass for GN10 is 3 times larger than the nominal completeness limit for the IRAC-selected sample of massive galaxy candidates at from Mancini et al. (2009). However, GN10 is absent from the Mancini sample because it is fainter than the adopted IRAC magnitude limit ( AB), due to its extreme attenuation. This illustrates how dust obscuration can be a significant limitation for constructing complete samples of galaxies in the distant Universe, even when using surveys based on Spitzer IRAC data.
On the basis of the identitication of the line as CO[4-3] at , GN10 is now the third SMG in the GOODS-N proto-cluster structure. Our finding also supports the suggestion that there is indeed a substantial population of SMGs (e.g., Dannerbauer et al. 2002; 2004; 2008; Dunlop et al. 2004; Wang et al. 2007; 2009; Younger et al. 2007; Capak et al. 2008; Coppin et al. 2009; D09), with several others awaiting to be spectroscopically confirmed in GOODS-N (D09). Contrarily to GN20 and GN20.2a, GN10 is not surrounded by an excess of B-band dropout Lyman break galaxies: only two such objects are present within 25′′ from GN10, while 14 are found within the same distance from GN20. Of these two B-band dropout galaxies one has an optical spectroscopic redshift of (Stern et al., in preparation; based on the detection of Ly emission with keck+DEIMOS), placing it in the proto-cluster structure, while the other has no known spectroscopic redshift. The on-sky separation between GN10 and GN20 is 9′, or 4.0 Mpc comoving. The velocity separation of km s-1 (from ) corresponds to a line-of-sight distance of Mpc comoving (this is likely an upper limit, as part of the velocity separation could be due to peculiar velocities within the structure). GN10 is closer to GN20.2a both in the sky and in velocity space. It appears that the proto-cluster structure is fairly extended on the sky, and presumably several other vigorous starburst galaxies could also be part of this structure, as also suggested by D09. More work and observations are required for a full characterization of this interesting high- overdensity of galaxies.
This is the first time that the redshift of a source that is undetected at optical or near-infrared wavelengths has been derived through measurement of CO lines. Our result clearly demonstrates that this will be a very powerful technique to identify the earliest and most obscured star forming galaxies, in particular once wider band and/or more sensitive instruments will be available, such as the upcoming 8 GHz receiver upgrade for PdBI, the Redshift Receiver for the Large Millimeter Telescope (LMT), and the Atacama Large Millimeter Array (ALMA).
References
- (1) Calzetti, D., Armus, L., Bohlin, R. C., et al. 2000, ApJ, 533, 682
- (2) Capak P., et al., 2008, ApJ, 681, L53
- (3) Chary, R. & Elbaz, D., 2001, ApJ, 556, 562
- (4) Coppin K.E.K., et al., 2009, MNRAS in press
- (5) Daddi, E., et al. 2008, ApJ 673, L21
- (6) Daddi, E., et al. 2009, ApJ in press (arXiv:0810.3108)
- (7) Dunlop, J., et al. 2004, MNRAS, 350, 769
- (8) Dannerbauer, H., et al. 2002, ApJ, 573, 473
- (9) Dannerbauer, H., et al. 2004, ApJ, 606, 664
- (10) Dannerbauer, H., Walter, F. & Morrison G., 2008, ApJ, 673, L127
- (11) Giavalisco, M., Ferguson, H.C., Koekemoer, A., et al. 2004, ApJ. 600, L93
- (12) Greve T. R., et al., 2008, MNRAS, 389, 1489
- (13) Mancini C., et al., 2009, A&A in press (arXiv:0901.3341)
- (14) Maraston C., 2005, MNRAS, 362, 799
- (15) Perera T.A., et al., 2008, MNRAS, 391, 1227
- (16) Pope, A., et al., 2006 MNRAS, 370, 1185 (P06)
- (17) Pope A., et al., 2008, ApJ, 675, 1171
- (18) Schinnerer E., et al., 2008, ApJ, 689, L5
- (19) Solomon, P. M., Vanden Bout P. A., 2005, ARA&A, 43, 677
- (20) Tacconi, L. J., et al. 2006, ApJ, 640, 228
- (21) Wang, W.-H., Cowie, L. L., Barger, A. J., 2004, ApJ, 613, 655
- (22) Wang, W.-H., et al. 2007, ApJ, 670, L89
- (23) Wang, W.-H., et al. 2009, ApJ, 690, 319
- (24) Younger, J. D., et al. 2007, ApJ, 671, 1531
- (25) Yun M. S., Reddy N. A., Condon J. J., 2001, ApJ, 554, 803