Globular cluster systems in nearby dwarf galaxies - II. Nuclear star clusters and their relation to massive Galactic globular clusters.††thanks: This study is based on archival data of the NASA/ESA Hubble Space Telescope, which is operated by AURA, Inc., under NASA contract NAS 5–26555.
Abstract
We compare nuclear globular clusters (nGCs) in dwarf galaxies and Galactic GCs with extended (hot) horizontal branches (EHBs-GCs) in order to test the suggested external origin of the latter and the conditions at which GC self-enrichment can operate. Using luminosities and structural parameters of nGCs in low-mass (mainly late-type) dwarf galaxies from HST/ACS imaging we derive the present-day escape velocities () of stellar ejecta to reach the cluster tidal radius and compare them with those of EHB-GCs. We show that nGCs in dwarf galaxies are very similar in their photometric and structural properties (colour , magnitudes mag, ellipticities ) to EHB-GCs. The nGCs populate the same vs. region as EHB-GCs, although they do not reach the sizes of the largest EHB-GCs like Cen and NGC 2419. We argue that during accretion the of an nGC could increase due to significant mass loss in the cluster vicinity and the resulting drop in the external potential in the core once the dwarf galaxy dissolves. For EHB-GCs, we find a correlation between the present-day and their metallicity as well as colour. The similar , distribution of nGCs and EHB-GCs implies that nGCs could also have complex stellar populations. The –[Fe/H] relation could reflect the known relation of increasing stellar wind velocity with metallicity, which in turn could explain why more metal-poor clusters typically show more peculiarities in their stellar population than more metal-rich clusters of the same mass do. Thus the cluster can be used as parameter to describe the degree of self-enrichment. All our findings support the scenario in which Galactic EHB-GCs have originated in the centres of pre-Galactic building blocks or dwarf galaxies that were later accreted by the Milky Way.
keywords:
galaxies: dwarf – galaxies: irregular – galaxies: star clusters – galaxies: nuclei1 Introduction
Several studies have suggested that nuclear clusters of dwarf galaxies may be the progenitors, upon accretion, of the most massive globular clusters (GCs) in a galaxy (e.g., Zinnecker et al., 1988; Freeman, 1993). The most prominent case in our Galaxy is that of the GC M 54, which sits in the core of the Sagittarius dwarf spheroidal (Sgr dSph) (e.g. Ibata et al., 1997; Monaco et al., 2005; Bellazzini et al., 2008). The goal of the current study is to test this suggestion by means of a comparison of the properties of nuclear clusters in low-mass galaxies with those of the massive Galactic GCs. Recent studies based on deep observations of Galactic GCs challenged the traditional view of GCs being composed of a simple stellar population with homogeneous age and metallicity. Most massive Galactic GCs for which deep Hubble Space Telescope (HST) imaging is available exhibit multiple branches in their colour-magnitude diagrams such as Cen (Lee et al., 1999; Hilker & Richtler, 2000; Bedin et al., 2004; Villanova et al., 2007), NGC 2808 (Piotto et al., 2007), NGC 1851 (Milone et al., 2008) and NGC 6388 (Piotto, 2008). This implies that they host sub-populations with different chemical abundances and/or ages (e.g. Cen, Hilker et al., 2004). The presence of multiple stellar populations has recently stimulated studies on formation mechanisms to explain the complex stellar populations in GCs such as capturing of field stars (Fellhauer et al., 2006; Pflamm-Altenburg & Kroupa, 2007), repeated gas accretion (Walcher et al., 2005; Pflamm-Altenburg & Kroupa, 2009), merging of star clusters formed within the same GMC (Mackey & Broby Nielsen, 2007). The currently most favored mechanism to explain the multiple stellar populations and hot HB stars is the cluster self-enrichment from stars with enhanced mass-loss enriching the interstellar medium with He and other light elements, i.e. () AGB stars (e.g. Ventura & D’Antona, 2008) or massive fast-rotating stars (Prantzos & Charbonnel, 2006; Decressin et al., 2007a). Helium enrichment from such sources is required to explain the sub-populations and the hot, core-helium and shell-hydrogen burning stars on the extension of the horizontal branch (HB) in GCs (D’Antona et al., 2002; Piotto et al., 2005; Maeder & Meynet, 2006). Note however, that the late He flasher scenario also can explain the extremely hot HB stars (blue hook stars) as stars which have experienced extreme mass-loss and late He-flash while descending to the white dwarf sequence (e.g. Brown et al., 2001; Moehler et al., 2007).
Interestingly, NGC 2419, the largest and among the most luminous GCs, has a very well defined population of hot stars on the extension of the HB, identical to Cen (Sandquist & Hess, 2008; Dalessandro et al., 2008), but shows no clear evidence for multiple stellar populations and/or metallicity spread as deduced from its well defined red clump and narrow red giant branch in its HST/WFPC2 CMD (Ripepi et al., 2007).
Typically the most complex clusters are among the most massive ones. Based on multivariate principle component analysis of various properties of Galactic GCs, Recio-Blanco et al. (2006) showed that there is a strong correlation between the HB extension (i.e., the maximum temperature reached on the HB) and the cluster total mass, accounting for up to of the HB variation. In addition, Dieball et al. (2009) showed that “blue hook” stars (hotter than the EHB, K, but with a similar FUV–NUV colour) are observed only in the most massive Galactic GCs. Therefore, the cluster mass is as important parameter for driving the HB morphology as the cluster metallicity and age. In this respect a more massive cluster (forming in a more massive giant molecular cloud, GMC) would be able to more efficiently retain stellar ejecta than a less massive one, thus leading to a higher degree of self-enrichment. Recently, Lee et al. (2007) have shown that Galactic clusters with extended HBs (EHB-GCs), besides being among the most massive GCs in the Galaxy, form a kinematically distinct population along with the metal-poor “Young Halo” (YH) GCs. The fact that both the total orbital energy and the maximum distance from the Galactic plane correlate with the cluster metallicity for bulge/disc (BD) and non-EHB “Old Halo” (OH) GCs is consistent with the dissipational formation (Eggen et al., 1962) of those clusters together with the Galactic bulge and halo. The lack of such a correlation for YH-GCs and most of the EHB-GCs is consistent (Lee et al., 2007) with their formation in the cores of Galactic building blocks (Searle & Zinn, 1978) or in the nuclear regions of now defunct dwarf galaxies. If the most massive Galactic GCs had their origin as such nuclear clusters, they would have the ideal conditions for self-enrichment processes to take place. The retained stellar ejecta in the deep potential well can lead to the formation of stellar populations with different metallicities and/or ages.
One place to look for the progenitors of the peculiar Galactic EHB-GCs thus are the nuclear regions of galaxies harboring nuclear star clusters. Deep space– and ground-based observations have recently established that many galaxies, irrespectively of their morphological type, contain star clusters at their nuclear regions. In particular, the frequency of nuclear clusters (NCs) in early-type spiral galaxies (Sa-Sc) with little or no bulge has been observed to be (e.g. Carollo et al., 1997), in face-on late-type spirals (Scd-Sm) (Böker et al., 2002) and in bulgeless edge-on spirals (Seth et al., 2006). These fractions should be regarded as lower limits as the detection of NCs depends on the spatial resolution of the observations. Spectra of NCs in late-type disc galaxies shows that they span a wide range in their luminosity weighted age from 10 Myr to 11 Gyr with spectra best described by age-composite stellar populations and masses in the range M⊙ (Walcher et al., 2005, 2006; Seth et al., 2006) with the tendency of lower-mass NCs to be mainly found in later rather than earlier type spirals (Rossa et al., 2006). The presence of NCs in dwarf elliptical galaxies has been established for a long time (e.g. Reaves, 1983). However, due to their high surface brightness and low photometric completeness of previous surveys the question of NC frequencies in ellipticals has been largely debated. Using deep HST/ACS imaging of 100 early-type galaxies in the Virgo cluster, Côté et al. (2006) showed that at least (and as high as ) of the observed galaxies possess NCs. So far there are no dedicated studies of NCs in late-type dwarf galaxies.
The few existing observations of star clusters in late-type dwarfs show that the majority of the star clusters located in the nuclear regions (the inner 500 pc) of nearby dIrrs (e.g., M 82, NGC 1705) are found to be predominantly young (a few Myr, Ho & Filippenko, 1996; Smith et al., 2006; Westmoquette et al., 2007). However, old nuclear clusters have been reported in two dwarf spheroidal galaxies (Puzia & Sharina, 2008) as well as in seven dwarf irregular galaxies (Georgiev et al., 2008, 2009). The ages of those clusters are Gyr as inferred from their integrated spectra and broadband colours. In the following, we will refer to the old nuclear clusters in our sample as nuclear GCs (nGCs).
In order to address the suggestion that the most massive and peculiar Galactic GCs could have had their origin in an environment similar to the nuclear regions of dIrr galaxies, we study their luminosities, colours, structural parameters and escape velocity to reach the cluster tidal radius. In Section 2 we briefly describe our dataset and the selection of nGCs, while in Section 3 we perform the comparison between nGCs and EHB-GCs including their photometric and structural properties and their escape velocities. The main conclusions of this work are presented in Sect. 4.
2 Data
2.1 Description
This study is based on a two-band (F606W and F814W) archival HST/ACS dataset of nearby ( Mpc), low-luminosity ( mag, ), and mainly late-type dwarf galaxies which are located in low-density environments (in lose groups or in the halo regions of nearby galaxy groups). The dataset contains 30 dIrrs, 2 dEs, 2 dSphs and 4 Sm dwarfs in which old GCs were detected. Data reduction, photometry, completeness analysis, contamination and structural parameter measurements of all clusters are described in detail in Georgiev et al. (2008, 2009), where we have also discussed in detail their colours, luminosities and structural parameters and how they compare with the Galactic GC sub-populations. Here we extend our study of the old GCs in those dwarf galaxies with particular attention to the brightest GCs located in their nuclear regions.
2.2 Nuclear cluster selection
The selection of nuclear clusters in low-mass galaxies is not a trivial task due to uncertainties which arise from the determination of the galaxy centre, especially for irregular galaxies where starburst regions are present. As presented in Georgiev et al. (2009) we adopted the geometric centre of the isointensity contour at the level above the background as the galaxy centre. Recently, Swaters et al. (2009) performed an HI kinematic analysis for a large sample of nearby late-type dwarf galaxies. We have two galaxies in common with their study: UGC 1281 and NGC 4163. The latter has a bright GC in the inner region. Unfortunately, Swaters et al. (2009) were unable to derive the kinematical centre for this galaxy (and several other dwarfs in their sample) and adopted their photometric centre.
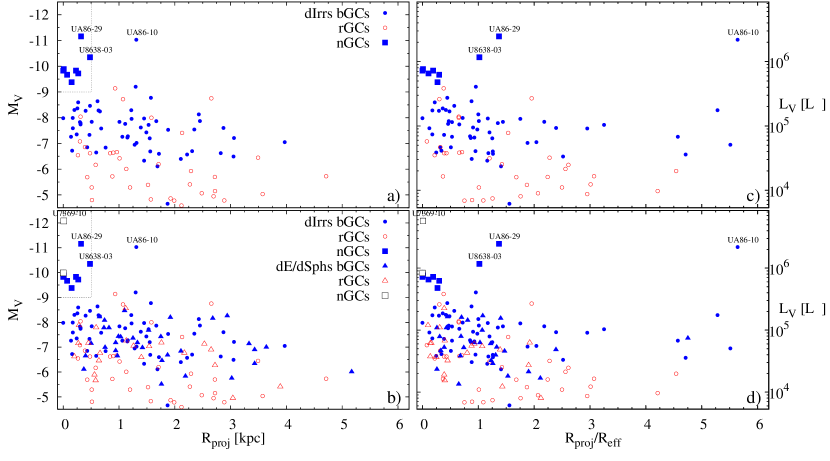
To define nuclear clusters we have constrained our selection criteria to clusters with mag and within a projected distance of pc from the galaxy centre (cf. Fig. 1). As we will discuss later, there seems to be a clear division at this particular magnitude between nGCs and the rest of the GCs in those dwarfs. The value of the adopted projected distance was based on dynamical friction-related arguments. The dynamical friction time scale for a gravitating object on a Keplerian orbit in an isothermal halo is , where , and are the local velocity dispersion (km/s), the initial distance from the centre (kpc) and the cluster mass (), respectively (e.g. Binney & Tremaine, 2008). The adopted guarantees that a cluster with in a field of local km/s would spiral toward the centre of the host potential on a time scale of Gyr. Such a cluster we classify as nGC. For the case of M 54 it has been shown by Monaco et al. (2005) that this cluster might have spiraled from kpc into the centre of the Sgr dSph within Gyr.
In Figure 1 we show the radial distribution of the GCs in our sample dwarf galaxies as a function of their luminosities. With different symbols are shown blue and red GCs in dIrrs or dEs/dSphs as indicated in the figure legend. Red GCs are those with mag, which is the typical colour to separate metal-poor from metal-rich GCs in a galaxy. The left and right panels show distributions of the cluster luminosities as a function of the projected galactocentric distance (Rproj) and Rproj normalized to the galaxy effective radius , respectively. With dashed lines we have indicated the adopted selection region. This resulted in the selection of eight nGCs in seven dIrrs and two nGCs in two dEs. We summarize their properties in Table 1.
| ID | D | |||||||||||
| Mpc | mag | mag | mag | mag | pc | km/s | pc | |||||
| (1) | (2) | (3) | (4) | (5) | (6) | (7) | (8) | (9) | (10) | (11) | (12) | (13) |
| E059-01-01 | 4.57 | 0.147 | 0.907 | 14.39 | 0.05 | 2.35 | 2.00 | 87.41 | 14.4 | 0.4 | ||
| E223-09-06 | 6.49 | 0.260 | 0.921 | 12.31 | 0.21 | 3.51 | 2.00 | 66.14 | 326.4 | 5.0 | ||
| E269-66-03 | 3.82 | 0.093 | 0.926 | 15.78 | 0.13 | 2.50 | 1.18 | 72.34 | 0.0 | 0.0 | ||
| IC1959-04 | 6.05 | 0.011 | 0.968 | 13.62 | 0.08 | 2.92 | 2.00 | 76.28 | 228.9 | 0.2 | ||
| KK197-02 | 3.87 | 0.154 | 0.932 | 13.62 | 0.11 | 2.95 | 1.48 | 66.56 | 0.1 | 0.0 | ||
| N4163-01 | 2.96 | 0.020 | 0.915 | 8.99 | 0.09 | 1.45 | 1.48 | 77.17 | 152.7 | 8.3 | ||
| U7369-10 | 11.59 | 0.019 | 0.824 | 108.18 | 0.16 | 2.31 | 2.00 | 241.71 | 0.0 | 0.0 | ||
| U8638-03 | 4.27 | 0.013 | 1.077 | 21.97 | 0.04 | 2.62 | 1.18 | 83.41 | 481.8 | 23.7 | ||
| UA86-17 | 2.96 | 0.942 | 0.731 | 11.75 | 0.08 | 3.27 | 1.18 | 54.59 | 70.1 | 6.5 | ||
| UA86-29 | 2.96 | 0.942 | 1.020 | 46.36 | 0.12 | 4.73 | 0.70 | 79.45 | 317.5 | 29.6 |
The radial distribution of the GCs in low-mass galaxies in Figure 1 shows that nearly all of the brightest ( mag) clusters are located within R pc. This confirms the expectation based on dynamical friction above. The observed decrease of the average cluster luminosity with increasing Rproj implies that either dynamical friction is indeed strong in dwarfs, driving predominantly the more massive GCs inwards (of which some might merge to form the nGC, see numerical simulation by Vesperini, 2000). Another formation scenario is the “biased formation” of more massive GMCs in the nuclear regions of galaxies where the higher ambient pressure and density (Elmegreen, 1993; Blitz & Rosolowsky, 2006) favors the formation of more massive star clusters (Harris & Pudritz, 1994). Together with dynamical friction this greatly enhances the likelihood for the presence of high-mass nuclear globular clusters.
Probably a mixture of both processes can explain the observed vs. distribution of the GCs in our sample galaxies.
2.3 The unique case of UGCA 86
One of the most interesting cases in our sample of dwarf irregular galaxies is UGCA 86 which hosts two nGCs. This galaxy has an absolute magnitude of mag (, Georgiev et al., 2009), MM⊙, calculated following Roberts & Haynes (1994) from the total flux measured by Stil et al. (2005) and a distance modulus of Mpc derived by Karachentsev et al. (2006). UGCA 86 is at a projected distance of kpc () southeast of the bright ( mag) Scd galaxy IC 342, thus providing a system similar to the Milky Way and the Magellanic clouds, although the latter is closer to its dominant host galaxy.
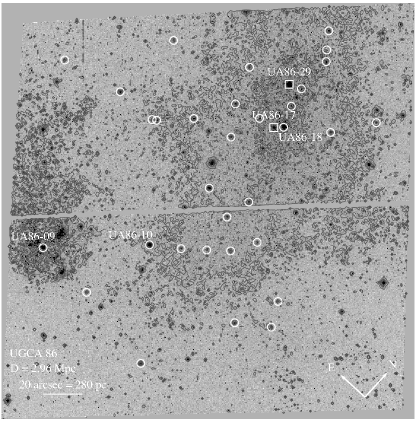
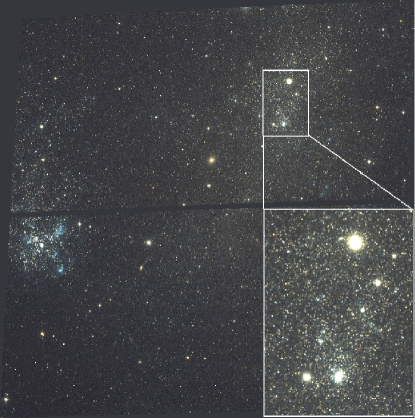
In the left panel of Figure 2 we show a gray scale F606W-band HST/ACS image of UGCA 86 with iso-intensity contours over plotted. Apart from the nGCs (white squares) this galaxy hosts at least three more luminous clusters, but those have colours consistent with an upper age estimate Gyr at [Fe/H dex. One of those bright clusters is in the nuclear region of UGCA 86 and likely gravitationally interacting with the other two. Thus, we might be witnessing the process of merging star clusters in the central region of this galaxy. Given the separation ( kpc) and masses () the expected dynamical friction time scale is Gyr.
3 Comparison between Galactic EHB-GCs and nGCs in dwarf galaxies
3.1 Colours, luminosities and sizes
The integrated nGC colours, luminosities and structural parameters from two band imaging can be used for a first order comparison of how similar nuclear clusters and EHB-GCs are in their metallicity and mass distribution.
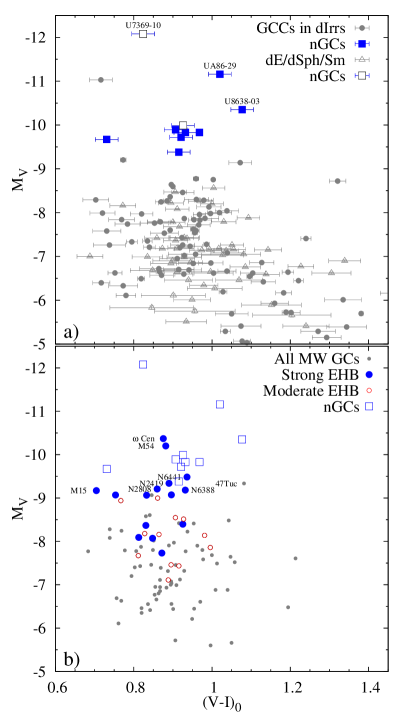
In Figure 3 we compare the colour-magnitude diagrams (CMDs) of GCs in our sample dwarf galaxies and Galactic GCs, where we focus on the comparison between nGCs and EHB-GCs. In panel a) we show the CMD of the dwarf galaxies GCs where nGCs in dIrrs and dEs are shown with filled and open squares, respectively. Although the nGCs were selected as the brightest and the most centrally located clusters in our dwarf galaxies, it can be seen that they form a distinct, well separated group of objects at mag (). Following the classification of the EHB-GCs by Lee et al. (2007) into clusters with strongly and moderately extended HBs ( mag for strongly extended), in Figure 3 b) we show these two groups with solid and open circles, respectively. It can be seen that the two EHB-GC populations show different magnitude distributions, with the EHB-GCs with hotter HBs being more luminous (and hence massive) on average. This reflects to some extent the known correlation between the maximum on the HB and GC mass (Recio-Blanco et al., 2006). The open squares in Figure 3 b) show the nGCs. They share the colour and magnitude distributions of the Galactic EHB-GCs. This suggests that nGCs have metallicity and mass distributions similar to the EHB-GCs, although the colour is rather degenerate in age and metallicity. If we assume a lower limit of the cluster age of 10 Gyr and mag, its metallicity, as inferred from Simple Stellar Population (SSP) models (e.g. Bruzual & Charlot, 2003) would be [Fe/H. However, a cluster with the same colour could be as metal-rich as [Fe/H and have an age of Gyr, which would also significantly influence its mass estimate. Therefore, a solid metallicity and/or age indicator (from integrated-light spectra or multi-band photometry) is crucial and required for a robust analysis of nGC masses, ages and metallicities.
Numerical simulations have shown that the globular cluster half-light radius () is a stable quantity over many cluster relaxation times (, Spitzer & Thuan, 1972; Aarseth & Heggie, 1998), and hence it represents a good proxy for the initial conditions in which the cluster evolved. In Georgiev et al. (2009), we showed that the evolution of GCs in low-mass dwarf galaxies is mainly governed by processes internal to the cluster due to the weak external tidal field of the host. Therefore, a similar distribution of nGCs and EHB-GCs would indicate an evolution in a similar tidal environment.
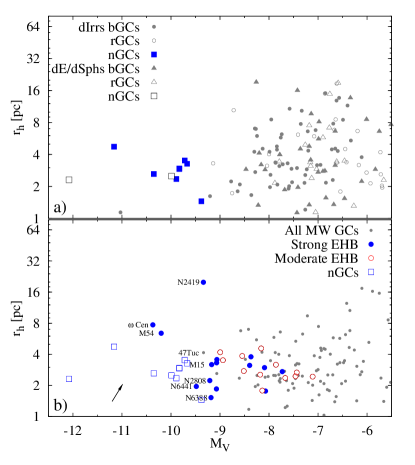
In Figure 4 we compare the vs. distribution of nGCs. The direct comparison in Figure 4 b) between nGCs and Galactic EHB-GCs shows that nGCs populate the region occupied mainly by the Galactic EHB-GCs with the hottest HBs, although they are not as extended as Cen, M 54 or NGC 2419. Also, nGCs fill the gap at mag between the latter and the rest of the EHB-GCs.
Since nGCs are in or close to the centre of the potential of their host galaxy, their tidal radius is relatively small. Upon accretion into the halo of a more massive galaxy their tidal radius can expand, and as well, while the host dwarf galaxy will be disrupted. This is due to the change from strong to a weaker tidal field in the galaxy halo after the dwarf is destroyed. This is evident from the identical for a cluster at 0.8 kpc in a dwarf galaxy and a cluster at 8 kpc in the Galaxy (Fig. 9 in Georgiev et al., 2009). Therefore, it is reasonable to expect that massive Galactic GCs (such as Cen, NGC 2419) with a large at present could have evolved from an initially small they would have had if they originated as nGCs in dwarf galaxies. Further, M 54, which is still at the nucleus of the Sgt dSph, has a smaller than Cen. The masses of M 54 and the stellar component of the Sgr nucleus within 100 pc (derived by Bellazzini et al., 2008) imply a mass ratio of . Thus, M 54 is still embedded in a rather deep potential well and its tidal radius is still confined and defined by the deeper and stronger potential of the Sagittarius galaxy. At the current Galactocentric distance of kpc (Harris, 1996) M 54 might undergo a process of , and therefore expansion due to the loss of background stars (i.e. mass in its vicinity) and the resulting drop in cluster potential upon the disruption of the Sgr dSph. Perhaps NGC 2419, the most extended Galactic cluster, went through such expansion. Moreover, its high ellipticity (, Bellazzini, 2007), matches the average value of the nGCs ellipticity (, see Table 1), which further supports its external origin.
Due to tidal stripping and bulge/disk shocking a cluster can also lose a fraction of its mass. Ideta & Makino (2004) were able to reproduce with N-body modeling the surface brightness profile of Cen if it was stripped from a dE host galaxy with baryon mass without the need of including dark matter. As a consequence of the stripping, the cluster lost nearly of its initial mass within 0.88 Gyr of the stripping process. Thus, the expected direction of the cluster evolution is toward larger and dimmer magnitude (smaller mass), as shown by the arrow in Figure 4.
However, a detailed modeling is required to verify this scenario and quantify the degree of evolution. It is also very important that the final orbit of the accreted cluster either is very eccentric or circular with a large galactocentric radius so that the cluster will spend most of the time on its orbit in the galactic halo.
3.2 Internal cluster escape velocity
As discussed in the introduction, the main parameters that govern the HB morphology are the cluster mass, [Fe/H] and age. Here we will show that the escape velocity to reach the cluster tidal radius , can be used as an additional parameter to quantify the ability of a cluster to retain processed material from stellar ejecta. During cluster formation, if retained, this chemically enriched material can be used for the formation of subsequent stellar populations, as recently observed in some massive GCs.
| (1) | (2) | (3) |
|---|---|---|
| 0.5 | 0.07637 | 0.09126 |
| 0.6 | 0.07852 | 0.09183 |
| 0.7 | 0.08068 | 0.09250 |
| 0.8 | 0.08285 | 0.09328 |
| 0.9 | 0.08501 | 0.09418 |
| 1.0 | 0.08717 | 0.09520 |
| 1.1 | 0.08934 | 0.09635 |
| 1.2 | 0.09154 | 0.09765 |
| 1.3 | 0.09379 | 0.09910 |
| 1.4 | 0.09610 | 0.10071 |
| 1.5 | 0.09849 | 0.10249 |
| 1.6 | 0.10098 | 0.10445 |
| 1.7 | 0.10359 | 0.10659 |
| 1.8 | 0.10634 | 0.10893 |
| 1.9 | 0.10923 | 0.11147 |
| 2.0 | 0.11229 | 0.11422 |
| 2.1 | 0.11553 | 0.11720 |
| 2.2 | 0.11897 | 0.12040 |
| 2.3 | 0.12261 | 0.12384 |
| 2.4 | 0.12647 | 0.12753 |
| 2.5 | 0.13057 | 0.13148 |
In order for enriched stellar ejecta to be kept within the cluster, their terminal velocity must be no greater than the escape velocity to reach the cluster tidal radius . Leitherer et al. (1992) have shown that for hot and massive OB stars scales with metallicity as , while for AGB stars the relation is steeper, i.e (e.g. Elitzur & Ivezić, 2001; Marshall et al., 2004). A typical wind velocity of an AGB star derived from observations is km/s (e.g. Vassiliadis & Wood, 1993; Bloecker, 1995; Habing & Olofsson, 2003). Rapidly rotating stars are known to have radial mechanical winds at the equator (where at the breakup limit the centrifugal force overcomes the gravity) with velocities from a few to a few hundred km s-1 (Decressin et al., 2007b; Porter & Rivinius, 2003). Supernovae have winds with speed of thousands of km s-1. Based on 2D hydrodynamical simulations, Wünsch et al. (2008) have shown that thermalized ejecta from massive stars in compact and massive clusters are dense enough to trigger density condensations and feed subsequent star formation. Therefore, massive stars rapidly ( Myr) deposit (through stellar winds and SNe explosions) a large fraction of their mass back into the immediate ISM. Due to stochastic effects, more massive clusters will have relatively more massive stars (drawn from the sparsely populated high-mass end of the IMF) than less massive clusters. More massive clusters also have a higher capability to retain stellar ejecta, which subsequently would lead to a higher degree of self-enrichment due to their high escape velocity, which is also a function of metallicity. Thus our primary goal is to quantify and test the viability of such a scenario by looking at the escape velocity to reach the cluster’s tidal radius. We use the following expression to calculate :
| (1) |
where and are the cluster half-light radius in parsecs and cluster mass in ; is a coefficient which takes into account the dependence of the escape velocity on the density profile of the cluster, i.e. its concentration . This coefficient was computed for King (1962) models by de-projecting the density profile and then calculating the potential as a function of radius. We calculated both, the cluster velocity needed to reach the cluster tidal radius and the one to reach infinity. The values we have used for are those at the tidal radius. They differ insignificantly from the values at infinity, i.e. leading to km/s. Both values are listed in Table 2. Calculating involves knowledge of the cluster’s half-light radius, mass and concentration. All these quantities are easily accessible from ground and space based observations of GCs in nearby galaxies. Given that the cluster mass is the quantity that varies more significantly (an order of magnitude) than among clusters, mainly traces cluster mass.
The measurement of the GCs in our dwarfs is described in detail in Georgiev et al. (2008, 2009). To compute cluster masses we have used the luminosities we measured in Georgiev et al. (2008, 2009) and a , which is the mean value for old LMC GCs (estimated from the measurements of McLaughlin & van der Marel, 2005). The basic properties and of all GC candidates in our sample dwarf galaxies are provided in Table 3.
| ID | D | E(B-V) | |||||||||
| Mpc | mag | mag | mag | pc | km/s | pc | |||||
| (1) | (2) | (3) | (4) | (5) | (6) | (7) | (8) | (9) | (10) | (11) | (12) |
| dIrrs | |||||||||||
| D565-06-01 | 9.08 | 0.039 | 1.583 | 4.64 | 0.36 | 1.19 | 2.00 | 21.44 | 524.2 | 13.1 | |
| D634-03-01 | 9.55 | 0.038 | 1.039 | 5.03 | 0.01 | 5.93 | 0.70 | 10.84 | 298.4 | 3.4 | |
| DDO52-01 | 10.28 | 0.037 | 1.004 | 4.85 | 0.03 | 3.34 | 1.18 | 13.26 | 840.5 | 14.3 | |
| Sms | |||||||||||
| E137-18-01 | 6.40 | 0.243 | 1.030 | 5.32 | 0.03 | 3.42 | 2.00 | 27.55 | 654.3 | 14.8 | |
| E274-01-07 | 3.09 | 0.257 | 0.945 | 4.95 | 0.00 | 2.8 | 1.18 | 16.17 | 616.4 | 25.8 | |
| N247-02 | 3.65 | 0.018 | 1.138 | 4.84 | 0.09 | 18.79 | 1.48 | 5.93 | 1395.9 | 27.2 | |
| N4605-10 | 5.47 | 0.014 | 0.969 | 5.51 | 0.01 | 19.16 | 2.00 | 14.45 | 2938.6 | 64.0 | |
| dSphs | |||||||||||
| IKN-01 | 3.75 | 0.061 | 0.911 | 4.86 | 0.01 | 6.62 | 0.70 | 8.42 | 399.2 | ||
| KKS55-01 | 3.94 | 0.146 | 0.907 | 5.15 | 0.01 | 4.51 | 1.18 | 16.04 | 1366.6 | 85.3 | |
| dEs | |||||||||||
| E269-66-01 | 3.82 | 0.093 | 0.911 | 5.43 | 0.02 | 2.87 | 1.48 | 30.14 | 492.9 | 24.1 | |
| U7369-01 | 11.59 | 0.019 | 0.899 | 4.96 | 0.04 | 2.77 | 1.48 | 17.82 | 3430.3 | 54.7 | |
For the majority (85) of the Galactic GCs we have used the most recent measurements by McLaughlin & van der Marel (2005) of their , concentration and ratio, which is needed to estimate . For the remaining GCs we adopted the values in the Harris (1996) catalog and . Table 4 contains the basic properties
In columns list the cluster Name in (1); foreground Galactic extinction E(B-V) from Harris (1996) (2); corrected for foreground extinction cluster color in (3) and its absolute magnitude in (4); logarithm of the cluster mass in (5), half-light radius in (6), logarithm of the concentration index in (7), escape velocity in (8), metallicity [Fe/H] in (9), HB ratio HBR from Harris (1996) in (10), HB morphology in (11) sEHB and mEHB, B and R for strong and moderately extended (from Lee et al., 2007), blue and red HBs, if HBR or HBR, respectively. In column (12) is listed the classification of the cluster (Class) according to which Galactic GC sub-population it belongs: buldge/disk (BD), old and young halo (OH) and (YH), Saggitarius (SG) or with unknown classification (UN). The cluster Class was adopted from Mackey & van den Bergh (2005), which follows the original Zinn (1993) classification.
| Name | E(B-V) | [Fe/H] | HBR | HB morphology | Class | ||||||
|---|---|---|---|---|---|---|---|---|---|---|---|
| mag | mag | mag | pc | km/s | dex | ||||||
| (1) | (2) | (3) | (4) | (5) | (6) | (7) | (8) | (9) | (10) | (11) | (12) |
| NGC5139/Cen | 0.12 | 0.88 | 6.37 | 7.71 | 0.98 | 53.96 | sEHB | UN | |||
| NGC6715/M54 | 0.15 | 0.88 | 6.29 | 6.40 | 1.09 | 71.01 | sEHB | SG | |||
| NGC6441 | 0.47 | 0.94 | 6.16 | 1.95 | 1.11 | 94.87 | sEHB | BD | |||
| NGC2419 | 0.11 | 0.89 | 5.95 | 19.91 | 1.01 | 21.09 | sEHB | OH | |||
| NGC104/47Tuc | 0.04 | 1.08 | 6.05 | 4.15 | 1.09 | 65.92 | R | BD | |||
| NGC2808 | 0.22 | 0.86 | 5.93 | 2.23 | 1.07 | 63.96 | sEHB | OH | |||
| NGC6388 | 0.37 | 0.93 | 6.02 | 1.52 | 1.11 | 90.73 | sEHB | BD | |||
| Part 2 | |||||||||||
| AM4 | 0.04 | 2.87 | 3.65 | 0.50 | 1.09 | UN | |||||
| Djorg1 | 1.44 | 4.73 | 4.40 | 1.50 | 10.97 | UN | |||||
| Djorg2/ESO456-SC38 | 0.89 | 5.02 | 1.62 | 1.50 | 25.19 | R | BD | ||||
| E3 | 0.3 | 3.34 | 2.58 | 0.75 | 2.35 | UN | |||||
| Eridanus | 0.02 | 4.29 | 10.50 | 1.10 | 3.85 | R | YH | ||||
| HP1/BH229 | 0.74 | 4.81 | 6.20 | 2.50 | 13.31 | OH | |||||
| Liller1 | 3.06 | 5.28 | 1.26 | 2.30 | 47.96 | R | BD | ||||
| NGC4372 | 0.39 | 0.93 | 5.34 | 6.58 | 1.30 | 17.12 | B | OH | |||
| NGC4833 | 0.32 | 0.86 | 5.49 | 4.56 | 1.25 | 24.02 | mEHB | OH | |||
of Galactic globular clusters compiled from Harris (1996) and McLaughlin & van der Marel (2005) used to calculate . The first part of the table contains the , , , and for 85 GCs calculated or adopted from McLaughlin & van der Marel (2005). The rest of the GCs (second part of the table) are from the entries in the Harris catalog supplemented with from Mackey & van den Bergh (2005). We have updated the metallicity value of NGC 6440 from Origlia et al. (2008).
3.3 metallicity relation
In the light of the self-enrichment scenario, clusters have to retain enriched stellar ejecta from their first stellar population in order to show the observed abundance anomalies and/or multiple horizontal branches. Therefore, more massive (higher ) cluster are likely to retain a larger amount of processed stellar material which can also lead to an increase of their (initial) metallicity. Therefore, we expect an (mass)-metallicity relation. We should note, however, that a recent model by Bailin & Harris (2009) of the mass–metallicity relation (MMR) among the blue GCs in rich GC systems of massive galaxies shows that the MMR can not arise from self-enrichment, but rather from pre-enrichment of the GMC. However, their model did not include feedback from stars with slow stellar winds and enhanced mass loss such as AGB stars and fast rotators. In the following, we will show that when the is considered, such a modified MMR can actually be seen for Galactic EHB-GCs.
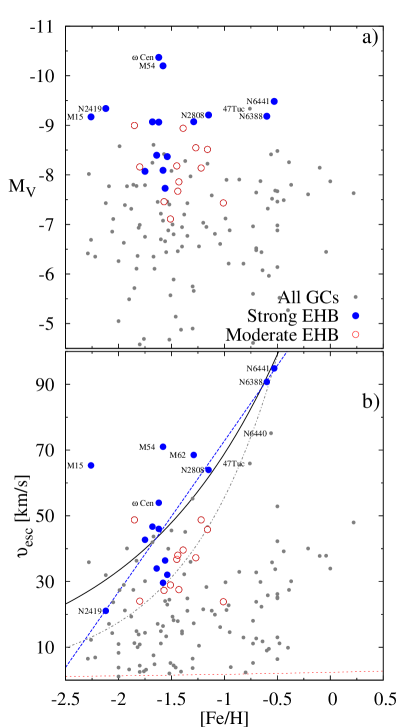
In Figure 5 a) we show the metallicity versus cluster luminosity/mass for Galactic GCs. All EHB-GCs are among the brightest, i.e. most massive clusters, and are typically metal-poor. The exceptions are NGC 6441 and NGC 6388, which have higher metallicities. However, 47 Tuc, which is (at least) as massive as most of the EHB-GCs and as metal-rich as NGC 6441 and NGC 6388, doesn’t show an extended HB.
In Figure 5 b), we show [Fe/H] vs. for Galactic GCs. With small dots, large solid and open circles are shown all Galactic GCs and EHB-GCs with strong or moderate extension of the HB, respectively. It can be seen that there is a correlation between these two quantities for EHB-GCs. The dashed line shows the least-square fit to the EHB-GCs excluding M 15, which clearly stands out from the rest of the EHB-GCs. M 15 is a core collapsed cluster (e.g. Guhathakurta et al., 1996; Noyola & Gebhardt, 2006, and refs therein), which could have experienced a strong evolution. Such expansion of its after core collapse occurs due to binary heating in the center (Baumgardt et al., 2002), resulting in a low present-day . Thus, the initial of M 15 was even higher. In addition, a King profile does not represent well the surface brightness profile of a post-core collapse cluster (Trager et al., 1995), thus the we used to calculate for from the Harris catalog might be underestimated. Pasquali et al. (2004) performed a simultaneous fit to the surface brightness and velocity dispersion profile of M 15 using a multi-mass King-Michie model. Using the values they obtain for and , we estimated that M 15 has slightly larger concentration, . This implies an increase in of about 10 km/s from its value calculated with (cf. Table 2). Leaving the details about M 15 aside, we note that clusters to the left of the model lines are expected to be in the self-enrichment regime, which is consistent with the observed peculiarities of the EHB-GCs.
The observation that the higher the cluster , the more metal-rich it is, may reflect the metallicity dependence of the terminal velocities of the stellar winds. The of a metal-rich cluster must be higher in order to retain such fast winds. We suggest that this might be the reason why the majority of the metal-rich Galactic GCs do not show EHBs while being as massive as the metal-poor EHB-GCs. With a dotted curve in Figure 5 b we show the relation between the stellar wind terminal velocity and metallicity for an AGB star with K, and using equation 2 in Leitherer et al. (1992). It is clear that the proportionality is not as steep as the observed relation for [Fe/H] for EHB-GCs. However, the Leitherer model is designed for studying radiative winds of hot ( K) and massive () stars, which have stellar winds km/s and different mass loss rate. Thus this wind model is inappropriate in reproducing the wind properties of AGB stars. With a dash-dotted line is shown the dust-driven AGB wind model of the form (Marshall et al., 2004). The vertical normalization, which is a complex parameter reflecting the relation between the gas-to-dust ratio and (see Elitzur & Ivezić, 2001), in this case is adopted as such to approximate the EHB-GCs distribution. With a solid curve in Fig. 5 we show a least square fit to the EHB-GCs resulting in a flatter relation .
It is interesting to note that the Galactic GC NGC 6440 has very high present day and a high metallicity (, Origlia et al., 2008), but is classified as cluster with a red HB. NGC 6440 is located in the inner Galactic bulge at , i.e. pc and pc (Harris, 1996) and has a very high foreground extinction mag, i.e. reddening of (Valenti et al., 2007). Its HST/WFPC2 CMD (Fig. 4 in Piotto et al., 2002) shows a well populated red clump, however, the expected region of the extension of the HB (subluminous blue stars) falls in the magnitude range where the photometric errors are larger than 0.1 mag, likely affected by the high reddening. Thus, the HB classification of NGC 6440 might not be very well established.
Unfortunately, we do not have metallicity measurements for the nuclear clusters in our sample dwarfs to perform a direct comparison in the same parameter space between nGCs and EHB-GCs. This will require a spectroscopic follow-up. The closest parameter pair that corresponds to [Fe/H] vs. is vs. , which we show in Figure 6.
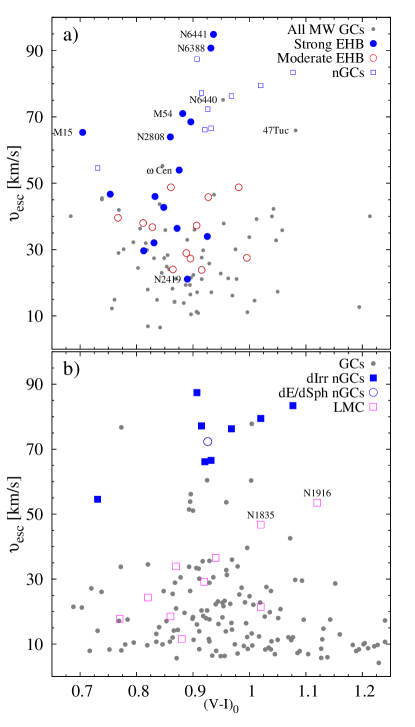
As can be seen, nGCs coincide with the Galactic EHB-GCs in the parameter space. Although the colour suffers from the age-metallicity degeneracy and its conversion to [Fe/H] is nonlinear depends on the choice of the adopted SSP model, the [Fe/H trend seen in Fig 5 b) can also be noticed for the Galactic EHB-GCs in Fig. 6 a). This is because Galactic GCs have a relatively small age spread ( 1–2 Gyr), therefore the colour will mainly trace the cluster metallicity. Previous studies, based on Galactic and/or GC data in other galaxies, derived linear relation between the colour and metallicity (e.g. Kundu & Whitmore, 1998; Kissler-Patig et al., 1998; Harris et al., 2000; Sohn et al., 2006). Our nGCs, however, have an unknown age-metallicity composition which is likely complex (Walcher et al., 2006; Puzia & Sharina, 2008). Thus, combined with the low number statistics, a linear transformation of their colour to metallicity would lead to an unreliable result, and therefore we do not present this exercise here.
Note that in Equation 1 is the present-day value, and hence a lower estimate of the initial . To compare of a cluster directly with the terminal speed of the stellar ejecta as a function of metallicity, one has to take the evolution of the GC mass and with time into account. Due to stellar evolution a GC loses about 40% of its initial mass and the increase of due to mass loss from stellar evolution is also about 40% if (e.g., Hills, 1980; Baumgardt & Makino, 2003). These two effects would increase the by a factor of 1.5 since the cluster was formed. However, the exact mass and evolution of a given cluster is determined by its orbital parameters in the galaxy and the profile of its potential. The fact that the present-day of EHB-GCs and nGCs are very comparable (cf. Fig. 6) indicates that they may well have experienced mass and size evolution in initially similar environments. To provide stronger constraints on this scenario, we suggest that accurate ages of the nGCs shall be determined by means of follow-up spectroscopy or near-IR imaging.
4 Conclusions
In order to address the hypothesis that massive peculiar Galactic GCs, mainly those with hot horizontal branches (EHB-GCs), originated from nuclear clusters of accreted and now disrupted dwarf galaxies or were the former cores of massive Galaxy building blocks, we have performed a comparison of their properties with that of nuclear clusters in low-mass dwarf galaxies, mainly late-type irregulars. We introduce the escape velocity to reach the tidal radius of a cluster as an additional tool to measure the ability of a cluster to retain enriched stellar ejecta which are required in the self-enrichment scenario to explain the complexity of the stellar populations recently observed in Galactic GCs.
The sample of nuclear clusters was presented in Georgiev et al. (2008, 2009) and is based on two band F606W and F814W archival HST/ACS imaging. Because the colour of those clusters is consistent with an age of Gyr, i.e. likely typical old GCs, we have termed them nuclear GCs (nGCs). Based on dynamical friction-related arguments, we selected eight nGCs in seven dIrr and two nGCs in two dEs with mag within projected galactocentric distances of R pc (cf. Table 1). Those clusters could have formed either at their present location or spiraled in due to dynamical friction within 4 Gyr. The radial distributions of all GCs shown in Figure 1 indicates a trend of increasing average cluster magnitude with decreasing Rproj. We discuss that such a relation could arise due to two mechanisms: dynamical friction, shown to be strong in low-mass galaxies (Vesperini, 2000), or biased massive cluster formation toward lower Rproj reflecting the dependence of the size of giant molecular clouds (GMCs) on the ambient pressure, which increases with decreasing Rproj.
We observe that the nGCs seem to form a distinct population of clusters being brighter than mag and sharing a similar colour and luminosity distribution as the EHB-GCs. The similar colour between nGCs and EHB-GCs also indicates that they have similarly low metallicities, although this needs to be confirmed with spectroscopy and/or near-IR imaging due to the strong age-metallicity degeneracy of the colour.
The nuclear GCs in our sample dwarfs are distributed in the vs. plane in a region which connects the majority of the EHB-GCs and the most extended ones such as Cen, NGC 2419 and M 54, the nucleus of the Sagittarius dwarf spheroidal. If such Galactic clusters had their origin as nGCs, it is expected that their will suffer expansion upon accretion and disruption of the dwarf due to mass loss resulting in a drop of the cluster potential, i.e. the change from strong (in the dwarf nuclear region) to a weaker (in the galaxy halo) gravitational potential. This could be the reason for the large present-day of those Galactic EHB-GCs and the relatively smaller ones (on average) of the nGCs in our dwarf galaxies. A detailed modeling of this mechanism is required in order to quantify the cluster expansion.
Another indicator that EHB-GCs could have originated in the cores of dwarf galaxies is that of their chemical peculiarities, which could arise if they were capable to retain processed stellar ejecta of fast evolving massive stars. We showed that the escape velocity to reach the cluster tidal radius for EHB-GCs scales with cluster [Fe/H] in a similar manner (though much steeper) as the relation between the terminal velocity of the stellar wind and metallicity. Thus, a metal-poor cluster will have better capability to retain stellar ejecta than a metal-rich cluster of the same mass.
Due to the lack of metallicity measurements of the nGCs in our sample we compare them with the EHB-GCs in the vs. parameter space (Fig. 6). They are found to occupy region with similar in colour and as EHB-GCs which indicates that nGCs could have retained ejecta from massive and intermediate-mass stars as did EHB-GCs. Therefore, nGCs can have as complex stellar populations as the EHB-GCs. However, more robust age and metallicity estimates for nGCs are required to confirm this.
Acknowledgments
The authors would like to thank the referee, Prof. R. Gratton, for his constructive report which improved the discussion in the paper. IG would like to thank for the support for this work the German Research Foundation (Deutsche Forschungsgemeinschaft, DFG) through project number BO-779/32-1. THP acknowledges support in form of the Plaskett Research Fellowship at the Herzberg Institute of Astrophysics. The authors would like to thank Pavel Kroupa and Thibaut Decressin for valuable discussions and comments.
References
- Aarseth & Heggie (1998) Aarseth S. J., Heggie D. C., 1998, MNRAS, 297, 794
- Bailin & Harris (2009) Bailin J., Harris W. E., 2009, astro-ph/0901.2302
- Baumgardt et al. (2002) Baumgardt H., Hut P., Heggie D. C., 2002, MNRAS, 336, 1069
- Baumgardt & Makino (2003) Baumgardt H., Makino J., 2003, MNRAS, 340, 227
- Bedin et al. (2004) Bedin L. R., Piotto G., Anderson J., Cassisi S., King I. R., Momany Y., Carraro G., 2004, ApJL, 605, L125
- Bellazzini (2007) Bellazzini M., 2007, A&A, 473, 171
- Bellazzini et al. (2008) Bellazzini M., Ibata R. A., Chapman S. C., Mackey A. D., Monaco L., Irwin M. J., Martin N. F., Lewis G. F., Dalessandro E., 2008, AJ, 136, 1147
- Binney & Tremaine (2008) Binney J., Tremaine S., 2008, Galactic Dynamics: Second Edition. Galactic Dynamics: Second Edition, by James Binney and Scott Tremaine. ISBN 978-0-691-13026-2 (HB). Published by Princeton University Press, Princeton, NJ USA, 2008.
- Blitz & Rosolowsky (2006) Blitz L., Rosolowsky E., 2006, ApJ, 650, 933
- Bloecker (1995) Bloecker T., 1995, A&A, 297, 727
- Böker et al. (2002) Böker T., Laine S., van der Marel R. P., Sarzi M., Rix H.-W., Ho L. C., Shields J. C., 2002, AJ, 123, 1389
- Brown et al. (2001) Brown T. M., Sweigart A. V., Lanz T., Landsman W. B., Hubeny I., 2001, ApJ, 562, 368
- Bruzual & Charlot (2003) Bruzual G., Charlot S., 2003, MNRAS, 344, 1000
- Carollo et al. (1997) Carollo C. M., Stiavelli M., de Zeeuw P. T., Mack J., 1997, AJ, 114, 2366
- Côté et al. (2006) Côté P., Piatek S., Ferrarese L., Jordán A., Merritt D., Peng E. W., Haşegan M., Blakeslee J. P., Mei S., West M. J., Milosavljević M., Tonry J. L., 2006, ApJS, 165, 57
- Dalessandro et al. (2008) Dalessandro E., Lanzoni B., Ferraro F. R., Vespe F., Bellazzini M., Rood R. T., 2008, ApJ, 681, 311
- D’Antona et al. (2002) D’Antona F., Caloi V., Montalbán J., Ventura P., Gratton R., 2002, A&A, 395, 69
- Decressin et al. (2007a) Decressin T., Meynet G., Charbonnel C., Prantzos N., Ekström S., 2007a, A&A, 464, 1029
- Decressin et al. (2007b) Decressin T., Charbonnel C., Meynet G., 2007b, A&A, 475, 859
- Dieball et al. (2009) Dieball A., Knigge C., Maccarone T. J., Long K. S., Hannikainen D. C., Zurek D., Shara M., 2009, MNRAS, 394, L56
- Eggen et al. (1962) Eggen O. J., Lynden-Bell D., Sandage A. R., 1962, ApJ, 136, 748
- Elitzur & Ivezić (2001) Elitzur M., Ivezić Ž., 2001, MNRAS, 327, 403
- Elmegreen (1993) Elmegreen B. G., 1993, ApJ, 411, 170
- Fellhauer et al. (2006) Fellhauer M., Kroupa P., Evans N. W., 2006, MNRAS, 372, 338
- Freeman (1993) Freeman K. C., 1993, in Smith G. H., Brodie J. P., eds, The Globular Cluster-Galaxy Connection Vol. 48 of Astronomical Society of the Pacific Conference Series, Globular Clusters and Nucleated Dwarf Ellipticals. pp 608–+
- Georgiev et al. (2008) Georgiev I. Y., Goudfrooij P., Puzia T. H., Hilker M., 2008, AJ, 135, 1858
- Georgiev et al. (2009) Georgiev I. Y., Puzia T. H., Hilker M., Goudfrooij P., 2009, MNRAS, 392, 879
- Guhathakurta et al. (1996) Guhathakurta P., Yanny B., Schneider D. P., Bahcall J. N., 1996, AJ, 111, 267
- Habing & Olofsson (2003) Habing H. J., Olofsson H., eds, 2003, Asymptotic giant branch stars
- Harris (1996) Harris W. E., 1996, AJ, 112, 1487
- Harris et al. (2000) Harris W. E., Kavelaars J. J., Hanes D. A., Hesser J. E., Pritchet C. J., 2000, ApJ, 533, 137
- Harris & Pudritz (1994) Harris W. E., Pudritz R. E., 1994, ApJ, 429, 177
- Hilker et al. (2004) Hilker M., Kayser A., Richtler T., Willemsen P., 2004, A&A, 422, L9
- Hilker & Richtler (2000) Hilker M., Richtler T., 2000, A&A, 362, 895
- Hills (1980) Hills J. G., 1980, ApJ, 235, 986
- Ho & Filippenko (1996) Ho L. C., Filippenko A. V., 1996, ApJ, 472, 600
- Ibata et al. (1997) Ibata R. A., Wyse R. F. G., Gilmore G., Irwin M. J., Suntzeff N. B., 1997, AJ, 113, 634
- Ideta & Makino (2004) Ideta M., Makino J., 2004, ApJL, 616, L107
- Karachentsev et al. (2006) Karachentsev I. D., Dolphin A., Tully R. B., Sharina M., Makarova L., Makarov D., Karachentseva V., Sakai S., Shaya E. J., 2006, AJ, 131, 1361
- Karachentsev et al. (2007) Karachentsev I. D., Tully R. B., Dolphin A., Sharina M., Makarova L., Makarov D., Sakai S., Shaya E. J., Kashibadze O. G., Karachentseva V., Rizzi L., 2007, AJ, 133, 504
- King (1962) King I., 1962, AJ, 67, 471
- Kissler-Patig et al. (1998) Kissler-Patig M., Brodie J. P., Schroder L. L., Forbes D. A., Grillmair C. J., Huchra J. P., 1998, AJ, 115, 105
- Kundu & Whitmore (1998) Kundu A., Whitmore B. C., 1998, AJ, 116, 2841
- Lee et al. (2007) Lee Y.-W., Gim H. B., Casetti-Dinescu D. I., 2007, ApJL, 661, L49
- Lee et al. (1999) Lee Y.-W., Joo J.-M., Sohn Y.-J., Rey S.-C., Lee H.-C., Walker A. R., 1999, Nature, 402, 55
- Leitherer et al. (1992) Leitherer C., Robert C., Drissen L., 1992, ApJ, 401, 596
- Mackey & Broby Nielsen (2007) Mackey A. D., Broby Nielsen P., 2007, MNRAS, 379, 151
- Mackey & van den Bergh (2005) Mackey A. D., van den Bergh S., 2005, MNRAS, 360, 631
- Maeder & Meynet (2006) Maeder A., Meynet G., 2006, A&A, 448, L37
- Marshall et al. (2004) Marshall J. R., van Loon J. T., Matsuura M., Wood P. R., Zijlstra A. A., Whitelock P. A., 2004, MNRAS, 355, 1348
- McLaughlin & van der Marel (2005) McLaughlin D. E., van der Marel R. P., 2005, ApJS, 161, 304
- Milone et al. (2008) Milone A. P., Bedin L. R., Piotto G., Anderson J., King I. R., Sarajedini A., Dotter A., Chaboyer B., Marín-Franch A., Majewski S., Aparicio A., Hempel M., Paust N. E. Q., Reid I. N., Rosenberg A., Siegel M., 2008, ApJ, 673, 241
- Moehler et al. (2007) Moehler S., Dreizler S., Lanz T., Bono G., Sweigart A. V., Calamida A., Monelli M., Nonino M., 2007, A&A, 475, L5
- Monaco et al. (2005) Monaco L., Bellazzini M., Ferraro F. R., Pancino E., 2005, MNRAS, 356, 1396
- Noyola & Gebhardt (2006) Noyola E., Gebhardt K., 2006, AJ, 132, 447
- Origlia et al. (2008) Origlia L., Valenti E., Rich R. M., 2008, MNRAS, 388, 1419
- Pasquali et al. (2004) Pasquali A., De Marchi G., Pulone L., Brigas M. S., 2004, A&A, 428, 469
- Pflamm-Altenburg & Kroupa (2007) Pflamm-Altenburg J., Kroupa P., 2007, MNRAS, 375, 855
- Pflamm-Altenburg & Kroupa (2009) Pflamm-Altenburg J., Kroupa P., 2009, MNRAS submitted
- Piotto (2008) Piotto G., 2008, Memorie della Societa Astronomica Italiana, 79, 334
- Piotto et al. (2007) Piotto G., Bedin L. R., Anderson J., King I. R., Cassisi S., Milone A. P., Villanova S., Pietrinferni A., Renzini A., 2007, ApJL, 661, L53
- Piotto et al. (2002) Piotto G., King I. R., Djorgovski S. G., Sosin C., Zoccali M., Saviane I., De Angeli F., Riello M., Recio-Blanco A., Rich R. M., Meylan G., Renzini A., 2002, A&A, 391, 945
- Piotto et al. (2005) Piotto G., Villanova S., Bedin L. R., Gratton R., Cassisi S., Momany Y., Recio-Blanco A., Lucatello S., Anderson J., King I. R., Pietrinferni A., Carraro G., 2005, ApJ, 621, 777
- Porter & Rivinius (2003) Porter J. M., Rivinius T., 2003, PASP, 115, 1153
- Prantzos & Charbonnel (2006) Prantzos N., Charbonnel C., 2006, A&A, 458, 135
- Puzia & Sharina (2008) Puzia T. H., Sharina M. E., 2008, ApJ, 674, 909
- Reaves (1983) Reaves G., 1983, ApJS, 53, 375
- Recio-Blanco et al. (2006) Recio-Blanco A., Aparicio A., Piotto G., de Angeli F., Djorgovski S. G., 2006, A&A, 452, 875
- Ripepi et al. (2007) Ripepi V., Clementini G., Di Criscienzo M., Greco C., Dall’Ora M., Federici L., Di Fabrizio L., Musella I., Marconi M., Baldacci L., Maio M., 2007, ApJL, 667, L61
- Roberts & Haynes (1994) Roberts M. S., Haynes M. P., 1994, ARA&A, 32, 115
- Rossa et al. (2006) Rossa J., van der Marel R. P., Böker T., Gerssen J., Ho L. C., Rix H.-W., Shields J. C., Walcher C.-J., 2006, AJ, 132, 1074
- Sandquist & Hess (2008) Sandquist E. L., Hess J. M., 2008, ArXiv e-prints/0809.1782, 809
- Searle & Zinn (1978) Searle L., Zinn R., 1978, ApJ, 225, 357
- Seth et al. (2006) Seth A. C., Dalcanton J. J., Hodge P. W., Debattista V. P., 2006, AJ, 132, 2539
- Smith et al. (2006) Smith L. J., Westmoquette M. S., Gallagher J. S., O’Connell R. W., Rosario D. J., de Grijs R., 2006, MNRAS, 370, 513
- Sohn et al. (2006) Sohn S. T., O’Connell R. W., Kundu A., Landsman W. B., Burstein D., Bohlin R. C., Frogel J. A., Rose J. A., 2006, AJ, 131, 866
- Spitzer & Thuan (1972) Spitzer L. J., Thuan T. X., 1972, ApJ, 175, 31
- Stil et al. (2005) Stil J. M., Gray A. D., Harnett J. I., 2005, ApJ, 625, 130
- Swaters et al. (2009) Swaters R. A., Sancisi R., van Albada T. S., van der Hulst J. M., 2009, A&A, 493, 871
- Trager et al. (1995) Trager S. C., King I. R., Djorgovski S., 1995, AJ, 109, 218
- Tully et al. (2006) Tully R. B., Rizzi L., Dolphin A. E., Karachentsev I. D., Karachentseva V. E., Makarov D. I., Makarova L., Sakai S., Shaya E. J., 2006, AJ, 132, 729
- Valenti et al. (2007) Valenti E., Ferraro F. R., Origlia L., 2007, AJ, 133, 1287
- Vassiliadis & Wood (1993) Vassiliadis E., Wood P. R., 1993, ApJ, 413, 641
- Ventura & D’Antona (2008) Ventura P., D’Antona F., 2008, MNRAS, pp 255–+
- Vesperini (2000) Vesperini E., 2000, MNRAS, 318, 841
- Villanova et al. (2007) Villanova S., Piotto G., King I. R., Anderson J., Bedin L. R., Gratton R. G., Cassisi S., Momany Y., Bellini A., Cool A. M., Recio-Blanco A., Renzini A., 2007, ApJ, 663, 296
- Walcher et al. (2006) Walcher C. J., Böker T., Charlot S., Ho L. C., Rix H.-W., Rossa J., Shields J. C., van der Marel R. P., 2006, ApJ, 649, 692
- Walcher et al. (2005) Walcher C. J., van der Marel R. P., McLaughlin D., Rix H.-W., Böker T., Häring N., Ho L. C., Sarzi M., Shields J. C., 2005, ApJ, 618, 237
- Westmoquette et al. (2007) Westmoquette M. S., Smith L. J., Gallagher III J. S., O’Connell R. W., Rosario D. J., de Grijs R., 2007, ApJ, 671, 358
- Wünsch et al. (2008) Wünsch R., Tenorio-Tagle G., Palouš J., Silich S., 2008, ApJ, 683, 683
- Zinn (1993) Zinn R., 1993, in Smith G. H., Brodie J. P., eds, ASP Conf. Ser. 48: The Globular Cluster-Galaxy Connection The Galactic Halo Cluster Systems: Evidence for Accretion. pp 38–+
- Zinnecker et al. (1988) Zinnecker H., Keable C. J., Dunlop J. S., Cannon R. D., Griffiths W. K., 1988, in Grindlay J. E., Philip A. G. D., eds, The Harlow-Shapley Symposium on Globular Cluster Systems in Galaxies Vol. 126 of IAU Symposium, The Nuclei of Nucleated Dwarf Elliptical Galaxies - are they Globular Clusters?. pp 603–+