Optical/infrared flares of GRB 080129 from late internal shocks
Abstract
Strong optical and near-infrared (NIR) flares were discovered in the afterglow of GRB 080129. Their temporal behaviors, the sudden emergence and the quick disappearance, are rather similar to that of many X-ray flares (for instance, the giant flare of GRB 050502B). We argue that the optical/NIR flares following GRB 080129 are a low energy analogy of the X-ray flares and the most likely interpretation is the “late internal shock model”. In this model, both the very sharp decline and the very small ratio between the duration and the occurrence time of the optical/NIR flares in GRB 080129 can be naturally interpreted. The initial Lorentz factor of the flare outflow is found to be , consistent with the constraint set by the forward shock afterglow modeling. Other possibilities, like the reverse shock emission or the radiation from the continued but weaker and weaker collision between the initial GRB outflow material, are disfavored.
1 INTRODUCTION
GRB 080129 was triggered and located by the Swift Burst Alert Telescope (BAT) at 06:06:45 UT Immler et al. (2008). The duration of prompt emission is sec in keV band Barthelmy et al. (2008). The time-averaged spectrum is best fitted by a simple power-law model, whose power law index is . The fluence in the keV band is Barthelmy et al. (2008). The BAT observations lasted until 320 seconds after the trigger, then slewed to another location of the sky. X-ray telescope(XRT) and the UV-optical telescope(UVOT) started to point to GRB 080129 until s after the trigger. A fading X-ray source was discovered and no emission was seen with UVOT. No flare was observed in X-ray band since XRT started to observe Holland (2008).
The optical/NIR observations imaged by GROND started immediately after the trigger Greiner et al. (2008). The first images immediately revealed a strongly flaring source. Distinguished optical/NIR flares were observed with amplitude mag, duration of 80 s (full-width at half maximum; FWHM, hereafter we define the FWHM as the observed variability timescale in the flare), peaking at s after the GRB trigger. Their rise and the decline can be well approximated by and , respectively. Thereafter, the afterglow brightness is continuously rising until 6000 s after the GRB. The optical spectroscopy suggests a redshift for GRB 080129.
Greiner et al.(2008) interpreted the optical/NIR flares as the radiation of continued but weaker and weaker collisions between the material ejected during the prompt emission phase. In this work we do not follow their treatment for the following arguments: (i) In such a scenario, the NIR/optical flares emerge when the synchrotron self-absorption frequency drops below the observer’s frequencies. If correct, the NIR and optical flares should have an observable/significant time delay, that is the higher the observer’s frequency, the earlier the arrival time. However, we did not see such a delay in the data (Greiner et al. 2008; see also our Fig.1). (ii) The NIR/optical flares appeared and then peaked at a time . If the IR/optical flares are indeed from the outflow material ejected during the prompt gamma-ray emission phase, their declines are governed by the high latitude emission and can not be steeper than , again inconsistent with the data, where is the spectral index, is the power-law index of the energy distribution of the shock-accelerated electrons (Kumar & Panaitescu, 2000; Fan & Wei, 2005). This puzzle can be solved if the jet is so narrow that we have seen its edge, i.e., , where is the half opening angle and is the initial Lorentz factor of the outflow. However such a possibility has been convincingly ruled out by the late time afterglow observation because the jet break at s suggests a Greiner et al. (2008). The latter argument applies to the reverse shock emission model as well. That’s why we won’t discuss such a possibility in this work, either.
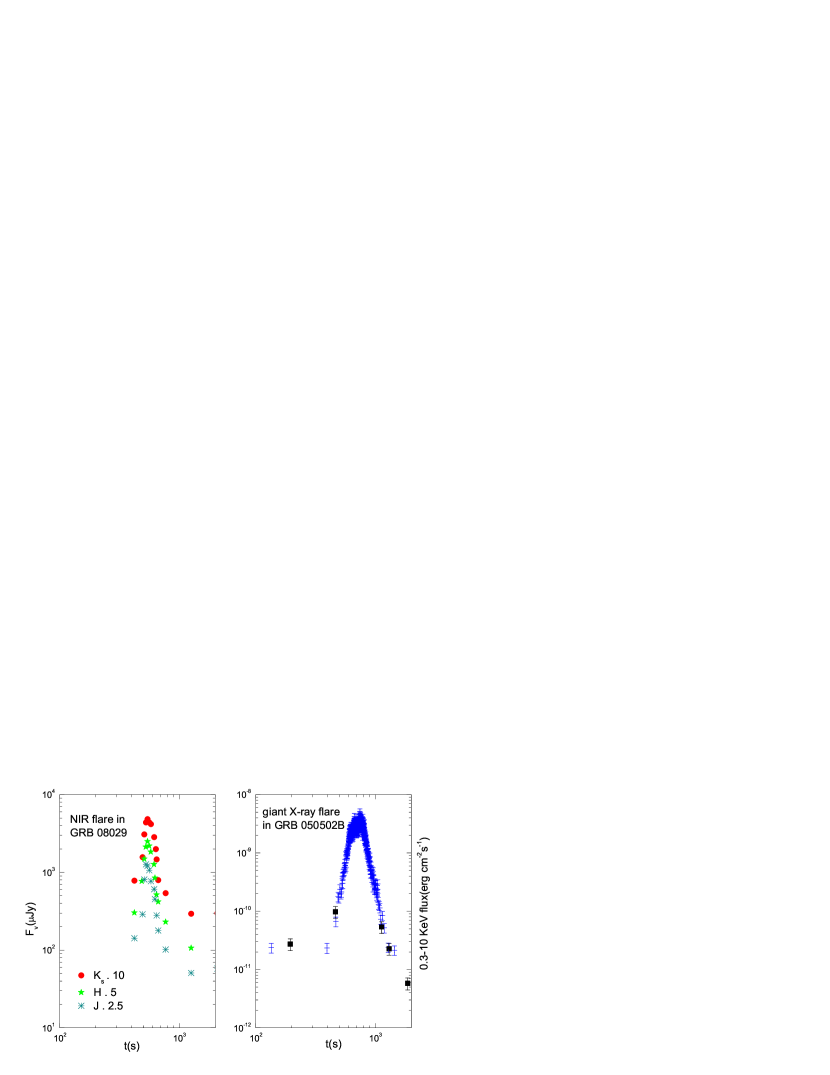
We note that the temporal behavior of the NIR/optical flares detected in GRB 080129 is quite similar to that of X-ray flares observed in a good fraction of Swift GRB afterglows (e.g., Guetta et al. 2006; Chincarini et al. 2007). For comparison purpose, we re-plot both the giant X-ray flare following GRB 050502B (Burrows et al., 2005) and the NIR flares in GRB 080129 in Fig.1. The physical parameters are summarized in Tab.1 and the similarities are evident. Motivated by these similarities we suggest that the NIR flares detected in GRB 080129 should have the same origin of the flares observed in the X-ray afterglows, i.e., the NIR flares should be powered by the so-called late internal shocks, too (Fan & Wei, 2005; Burrows et al., 2005; Zhang et al., 2006). Such a model was thought to have been ruled out by the request of a very large initial Lorentz factor () of the flare outflow (Greiner et al., 2008). We’ll show in this work that tens, a typical value taken in the X-ray flare modeling (Fan & Wei, 2005), is large enough to reproduce the data and is consistent with the upper limit () set by the forward shock optical afterglow modelling of GRB 080129.
| flare(s) in GRB | rise index () | decline index () | (s) | |
|---|---|---|---|---|
| GRB 080129 | 12 | 540 | 0.15 | |
| GRB 050502B | 9.5 | 740 | 0.14 |
This work is arranged as the following. In section 2 we briefly introduce the late internal shock model and then discuss the identity of two independent constraints that are widely used to rule out other possibilities. In section 3 we apply the late internal shock model to the IR flares following GRB 080129. We summarize our results with some discussions in section 4.
2 THE LATE INTERNAL SHOCK MODEL
In the standard fireball model, the GRB prompt emission is powered by the interaction of shells with different Lorentz factors in the relativistic outflow launched by the central engine, i.e., the internal shock model Paczynski & Xu (1994); Rees & Mészáros (1994) while the afterglow is believed to be the external forward shock emission Piran (1999). However, since the launch of Swift satellite, energetic X-ray flares have been detected in about half of the GRBs afterglows. The temporal behavior of most X-ray flares share some similarities with the prompt soft ray emission and can not be interpreted by the external forward shock model (See Mészáros 2006; Zhang 2007 for recent reviews). The most likely interpretation is the so-called “late internal shocks model”, in which the GRB central engine restarts after the prompt emission phase and launches unsteady outflow. The underlying physical processes are less clear. Among the various models put forward (see Zhang 2007 for a review) fallback accretion onto the nascent black hole may be the most natural one. The collision between the fast and slow material of the new outflow can power strong flares peaking in X-ray or far-ultraviolet band. The duration of these flares () is determined by the re-activity process of the central engine and can be much shorter than the occurrence time of the flares. On the other hand, since the ejection time of the last main pulse of the flare is close to , the net flux of the high latitude emission of the pulses can be approximated by , which can be much steeper than . So the late internal shock model can naturally account for the main characters, the sudden emergence and then a rapid drop, of the X-ray flares detected so far. For the emission of the external shocks, it is well known that (1) has to be in order of or larger Nakar & Piran (2003); (2) the decline can not be steeper than unless the edge of the GRB ejecta is visible. This is because the GRB outflow is curving and emission from high latitude (relative to the observer) will reach us at later times and give rise to a decline shallower than Fenimore et al. (1996); Kumar & Panaitescu (2000). Usually these two limitations have been taken as independent evidences for the late internal shock model (e.g., Chincarini et al. 2007). Below we show that they are highly relevant and even identical.111Fan et al. (2008a) pointed out this in a proceeding paper but did not prove it.
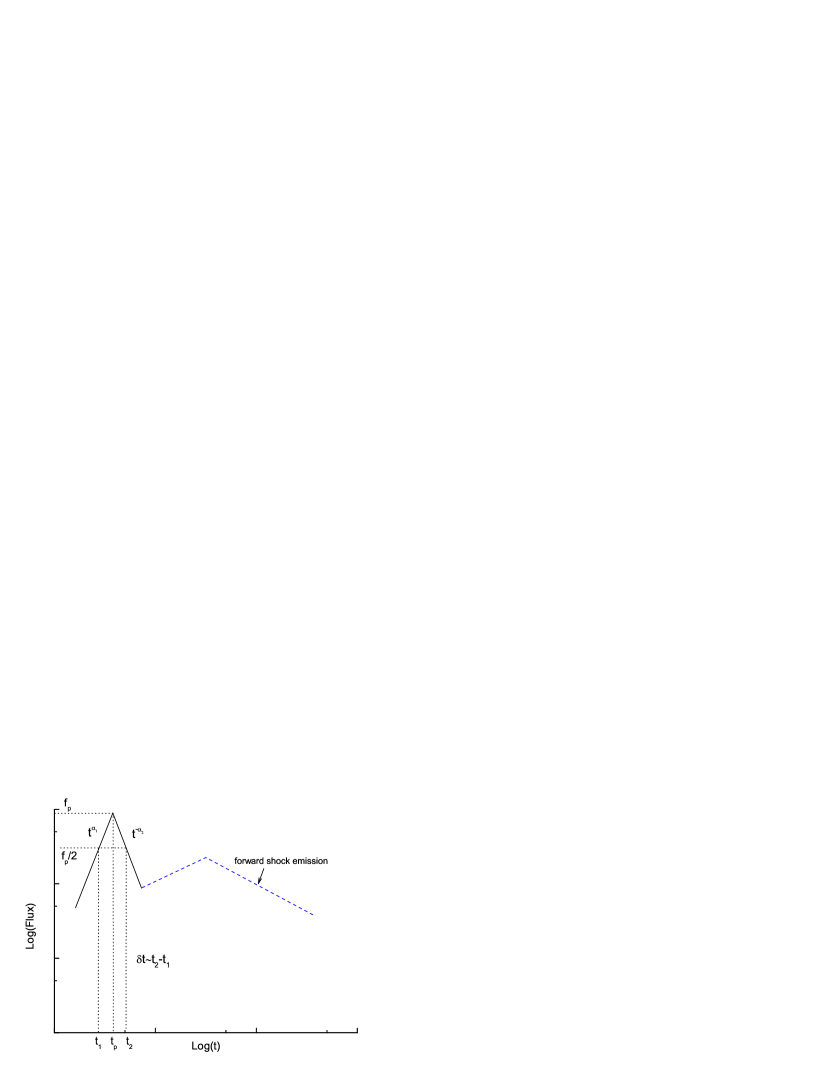
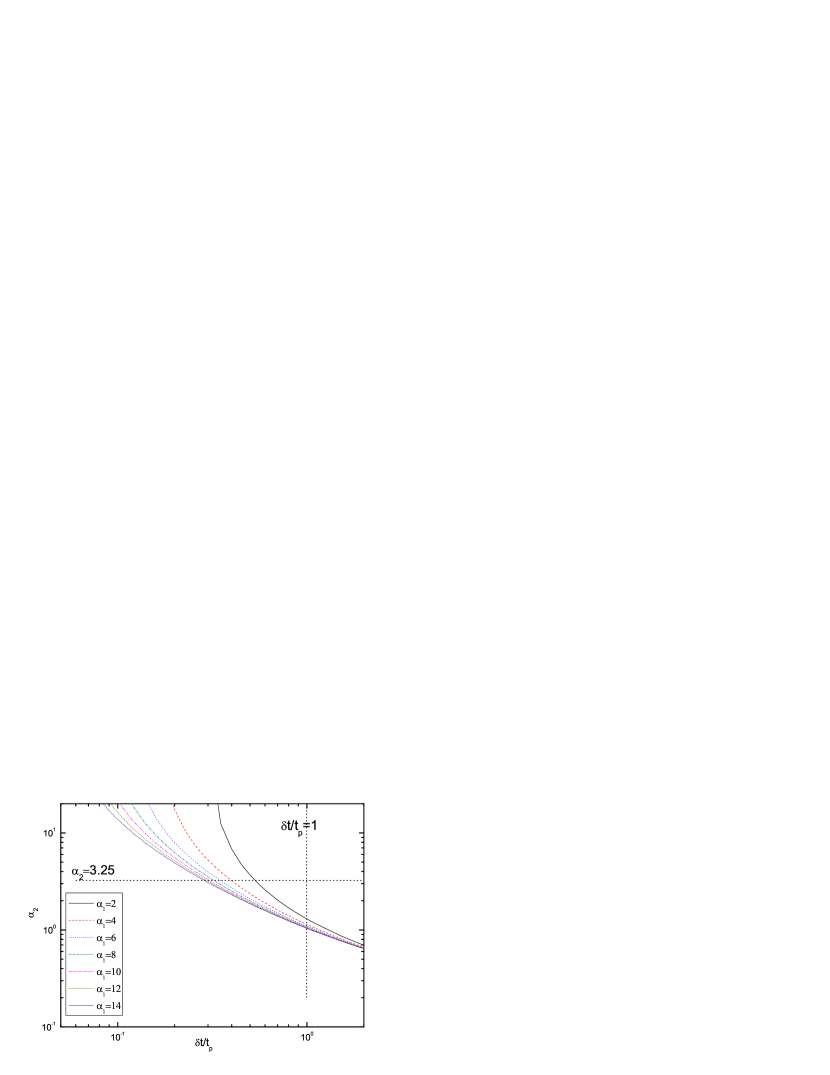
As shown in Fig.2, is the maximum flux at the peaking time in the flare, and are the time at which the flux is half of in the rising and decaying light curves, respectively. The FWHM time is therefore . Before and after , the light curves are approximated by and , respectively. It is straightforward to see that , and . After some simple algebraic we have
| (1) |
Obviously, is irrelevant to . For fixing , the relationship between and can be found in Fig.3, with which we can see that the steeper the decay, the smaller the . Particularly for , we have (hereafter “the decline constraint”) and simultaneously, suggesting that the two constraints widely used in supporting late internal shock model are highly relevant. This naturally accounts for the fact that many X-ray flares satisfy both limitations Chincarini et al. (2007). Please note that our conclusion is independent of the underlying physical processes.
For the purpose of identifying the afterglow emission powered by the central engine, the decline constraint may be more general. For example, the very sharp drop detected in the X-ray afterglow of GRBs 070110 (Troja et al., 2007), 060413, 060522, 060607A and 080330 (Zhang, 2009) also favors a central engine origin though the constraint is violated.
For the optical/NIR flares of GRB 080129, the peak time is s after the trigger, the duration (i.e., the FWHM) is s. We have and , indicating a central engine origin of these flare photons. Below we take the late internal shock model to reproduce the data.
3 Physical parameters and the synchrotron radiation of GRB 080129 in late internal shock model
We assume that the Lorentz factors of the ejected material in the re-starting outflow are highly variable, and take and as the typical Lorentz factor of the slow and fast shells, respectively. The masses of the fast and slow shells are taken as . In the late internal shock model, the inner fast shell will catch up with the outer slow shell at the radius (where is taken as the observed typical variability timescale of one pulse in GRB 080129 optical/NIR flare), and internal shock are generated. The merged shell’s Lorentz factor is (Piran, 1999), and the Lorentz factor of the internal shock can be estimated as .
Adopting the cosmological parameters , , and , we have a luminosity distance cm for GRB 080129 at a redshift . The observed maximum flux of the flare in GRB 080129 is about 0.5 mJy (NIR) and 0.3 mJy (optical), respectively Greiner et al. (2008). Assuming an efficiency factor of the optical flare 0.1, the total luminosity of the flare outflow ican be estimated by . This luminosity implies that the fallback accretion rate is about times that of the GRB prompt accretion, if the efficiency factor of converting the accretion energy into the kinetic energy of the outflow is nearly a constant MacFadyen, Woosley & Herger (2001).
The variability timescale of GRB080129’s optical flare is significantly longer than that of the prompt emission. Here we take , as suggested by the smoothness of the flare light curves. The typical radius of the late internal shock is . In this work we take the convenience in units of cgs unless with specific notation. Below, following Fan & Wei (2005), we show that with the parameters , , , , and , the flare data can be reasonably reproduced.
We first investigate the interaction between the inner fast shell and the outer slower one. The comoving number density of the electrons is , where is the rest mass of proton. The thermal energy density of the shocked material is Blandford & McKee (1976). So the strength of magnetic field can be estimated as
| (2) | |||||
As usual, we assume that in the shock front, the accelerated electrons take an energy distribution for , where is the minimum Lorentz factor of the shocked electrons Sari et al. (1998), and is the rest mass of an electron. Here for GRB 080129, we take . We can get the observed typical frequency of the synchrotron radiation
| (3) | |||||
where is the charge of the electron.
The cooling Lorentz factor is estimated by . So the cooling frequency is Sari et al. (1998)
| (4) | |||||
The synchrotron self-absorption frequency can be estimated as
| (5) | |||||
The maximum spectral flux of the synchrotron radiation is , where is the total number of emitting electrons, , where is the observed typical variability timescale of the total flare, and is a function of . For we have Wijers & Galama (1999). For , the predicted flux is Sari et al. (1998)
| (6) | |||||
Taking , we have , consistent with the observation of GRB 080129’s flare in near-infrared band.
In the optical and X-ray band satisfying , the flux can be estimated as Sari et al. (1998). Taking for optical band and for X-ray band, we have and , respectively. Approximately the optical peak flux of the flare is , as inferred from Fig.1 of Greiner et al.(2008). So our result is consistent with the optical data, too. In the X-ray band, no observation was carried out for s. So it is impossible to test our predication in X-ray band.
4 DISCUSSION
In s after the trigger of GRBs, bright X-ray flares have been well detected in a good fraction of Swift GRB X-ray afterglows (Falcone et al. 2007; Chincarini et al. 2007). However, for many X-ray flares the peak energy is unknown and the upper limit is about 0.2 keV. Fan & Piran (2006) speculated that some X-ray flares actually peaked in UV/optical band and thus should be classified as UV/optical flares. However, before 2008 people had not detected a canonical optical flare with plenty of data. The best candidate of UV/optical flare may be that detected in GRB 050904 (Boër et al. 2006), for which, unfortunately, the reverse shock model can not be ruled out (Wei, Yan & Fan 2006). The situation changed dramatically after the release of the early optical/NIR afterglow data of GRB 080129 Greiner et al. (2008).
The optical/NIR flares following GRB 080129 have very sharp decline () and very small , rather similar to that of the giant X-ray flare following GRB 050502B. These two characters rule out the possibility of being the reverse shock emission or being the radiation of the continued but weaker and weaker collision between the outflow material ejected during the prompt emission phase. Instead, these optical/NIR flares can be attributed to the re-activity of the central engine, as the X-ray flares detected in a good fraction of Swift GRB X-ray afterglows. In the framework of late internal shock model, with reasonable physical parameters (in particular tens) we calculate the synchrotron radiation. The typical frequency is just in near infrared band and the flux estimated in near-infrared and optical band are also consistent with the observations (see section 3 for details). We conclude that the flares in GRB 080129 peaking in NIR/optical band are a low energy analogy of the X-ray flares, confirming the speculation of Fan & Piran (2006).
The identification of a low energy analogy of X-ray flares in optical/IR band also helps the people to diagnose the physical composition of the outflow launched by the re-activity of the central engine. Fan et al. (2008b) showed that polarimetry of the flares is highly needed to achieve such a goal. Technically the optical polarimetry is much more plausible than the X-ray polarimetry at present (Covino et al., 1999).
In this work we also show that the two constraints (i.e., the decline constraint) and , widely/separately used to support the “central engine origin” of the afterglow emission, are highly relevant and even identical (see section 2 for details) for the flares. The decline constraint may be more general. For example, the very sharp drop detected in the X-ray afterglow of GRBs 070110 (Troja et al., 2007), 060413, 060522, 060607A and 080330 (Zhang, 2009) is in support of a central engine origin though the constraint is unsatisfied.
Acknowledgments
We thank the referee for helpful suggestions and Dr. Yizhong Fan for the stimulating discussion and for his help on improving the presentation. This work is supported by the National Natural Science Foundation (grant 10603003) of China.
References
- Barthelmy et al. (2008) Barthelmy, S.D., Cummings, J., Fenimore, E., et al. 2008, GCN Circ.7235
- Blandford & McKee (1976) Blandford, R. D., & McKee, C. F. 1976, Phys. Fluids, 19, 1130
- Bo¨er et al. (2006) Bor, M., Atteia, J.L., Damerdji, Y., et al. 2006, ApJ, 638. L71
- Burrows et al. (2005) Burrows, D. N., et al. 2005, Science, 309, 1833
- Chincarini et al. (2007) Chincarini, G., Morretti, A, Romano, P., et al. 2007, ApJ, 671, 1903
- Covino et al. (1999) Covino S. et al., 1999, A&A, 348, L1
- Falcone et al. (2007) Falcone, A.D., Morris, D., Racusin, J., et al. 2007, ApJ, 671, 1921
- Fan & Piran (2006) Fan, Y.Z., & Piran, T., 2006, MNRAS, 370, L24
- (9) Fan, Y.Z., Piran, T., & Wei, D.M., 2008a, AIPC, 968, 32
- Fan & Wei (2005) Fan, Y.Z., & Wei, D.M., 2005, MNRAS, 364, L42
- (11) Fan, Y.Z., Xu, D., & Wei, D.M., 2008b, MNRAS, 387, 92
- Fenimore et al. (1996) Fenimore, E. E., Madras, C. D., & Nayakshin, S., 1996, ApJ, 473, 998
- Greiner et al. (2008) Greiner, J., Kruhler, T., McBreen, S., et al. 2008, ApJ in press(astro-ph/0811.4291v1)
- Guetta et al. (2006) Guetta, D., D’Ella, D., Fiore, F., et al. 2006, NuovoCim. 121B, 1061
- Holland (2008) Holland, S.T., 2008, GCN, Cir.7227
- Immler et al. (2008) Immler, S., Burrows, D.N., Chester, M.M., et al. 2008, GCN Circ.7226
- Kumar & Panaitescu (2000) Kumar P., Panaitescu A., 2000, ApJ, 541, L51
- MacFadyen, Woosley & Herger (2001) MacFadyen, A.I., Woosley, S.E., & Herger, A., 2001, ApJ, 550, 410
- Mészáros (2006) Mészáros P., 2006, Rep. Prog. Phys., 69, 2259
- Nakar & Piran (2003) Nakar, E., & Piran, T., 2003, ApJ, 598, 400
- Paczynski & Xu (1994) Paczynski, B., & Xu, G.H., 1994, ApJ, 427, 708
- Piran (1999) Piran, T., Phys. Rep., 1999, 314, 575
- Rees & Mészáros (1994) Rees, M.J., & Mészáros, P., 1994, ApJ, 430, L93
- Sari et al. (1998) Sari, R., Piran, T., & Narayan, R., 1998, ApJ, 497, L17
- Troja et al. (2007) Troja, E., Cusumano, G., O’Brien, P., et al. 2007, ApJ, 665, 599
- Wei, Yan & Fan (2006) Wei, D.M., Yan, T., & Fan, Y.Z., 2006, ApJ, 636, L69
- Wijers & Galama (1999) Wijers, R.A.M.J., & Galama, T.J., 1999, ApJ, 523, 177
- Zhang et al. (2006) Zhang, B., Fan, Y.Z., Dyks, J., et al. 2006, ApJ, 642, 354
- Zhang (2007) Zhang, B., 2007, Chinese J.Astron. Astrophys., 7, 1
- Zhang (2009) Zhang, X. H., 2009, Research in Astronomy and Astrophysics, 9, 213