11 \SetVol592009
Double-Overtone Cepheids in the Large Magellanic Cloud
W.A. D z i e m b o w s k i1,2 and R. S m o l e c2
1Warsaw University Observatory, Al. Ujazdowskie 4,
00-478 Warsaw, Poland
e-mail: wd@astrouw.edu.pl
2Copernicus Astronomical Center, ul. Bartycka 18, 00-716 Warsaw, Poland
Month Day, Year
One of the most interesting results from the OGLE-III study of the LMC Cepheids is the large number of objects that pulsate simultaneously in the first and second overtone (denoted 1O/2O). Double-mode Cepheids yield important constraint on stellar evolution models. We show that great majority of the LMC 1O/2O Cepheids have masses . According to current stellar evolution calculations, these masses are lower than needed for the blue loop in the helium burning phase to reach the instability strip. On the other hand, we found most of these stars significantly overluminous if they are crossing the instability before helium ignition. A possible solution of this discrepancy is to allow for a large overshooting from the convective core in the main sequence phase. We also discuss origin of double-mode pulsation. At the short period range we find two types of resonances that are conducive to this form of pulsation. However, at longer periods, it has a different (non-resonant) origin.
1 Introduction
Double-mode (called also Beat) Cepheids are important objects for stellar physics. The diagnostic tool they provide are Petersen diagrams, where shorter to longer period ratio is plotted against log of the longer period. For nearly twenty years after they were introduced by Petersen (1973), the discrepancy between observational and calculated period ratio constituted a great challenge to stellar evolution theory. The major revision of stellar opacity calculation in the late 1980ties has been inspired by Simon’s (1982) suggestion based mainly on this discrepancy.
Only a small fraction of Cepheids develop double-mode pulsation. According to Soszyński et al. (2008b, hereafter S2008), it occurs only in less than 8 percent of the LMC Cepheids. It is difficult to develop this form of pulsation not only in nature but also in nonlinear modeling. Kolláth et al. (1998) (see also Szabó, Kolláth and Buchler 2004) managed to obtain models exhibiting sustained double-mode pulsation but, as Smolec and Moskalik (2008b) argued, their treatment of turbulence was incorrect.
So far attention has been mostly focused on Cepheids with excited fundamental (F) and first overtone (1O) modes. Readers are referred, in particular, to recent papers by Buchler and Szabó (2007) and Buchler (2008) on application of the F/1O Cepheid data as probes of stellar and stellar system metallicity. Surprisingly, data on the more frequent 1O/2O double-mode pulsators did not attracted much attention. In the LMC there are more than three times as many 1O/2O than F/1O Cepheids (S2008). The present paper is devoted almost solely to the former type.
2 OGLE-III data for the double- and triple-overtone Cepheids in the LMC


The Petersen diagram for the 203 LMC 1O/2O Cepheids is shown in the upper panel of Fig. 1. This is an expanded section of Fig. 2 in S2008, where also the relation was shown. The patterns of these two relations differ. The latter shows a simple monotonic decrease. In our Fig. 1 we see a barely marked increasing tendency up to , followed by a sharp decline. The lower panel shows the period-luminosity relation (PL) for the same objects. The relation, in which the Wesenheit index is used as a reddening-free measure of luminosity, is part of the general PL relation for the first overtone Cepheids in the LMC depicted in the bottom panel of Fig. 6 in S2008.
In each panel, we put also five points corresponding to triple-overtone objects (Soszyński et al. 2008a). The three at are 1O/2O/3O pulsators. The triple mode nature of two of them was first established with OGLE-II data by Moskalik et al. (2004). The three periods were then used by Moskalik and Dziembowski (2005) to construct seismic models of the object. The two F/1O/2O objects are widely separated in period.
Soszyński et al. (2008a) found also two Cepheids with excited first and third overtone, showing no traces of the second overtone. These 1O/3O pulsators have and -0.244. The indices are within the band of the PL relation for the 1O/2O Cepheids.
Nearly half (101) of the 1O/2O Cepheids occur in the range [-0.25,-0.05], that is, the 0.56-0.89 d period range, where it is the most common form of Cepheid pulsation in the LMC. Comparing histograms in Fig. 2, we see that there is much more of 1O Cepheids but not in this period range. There is no such a preferred range for the F/1O double mode Cepheids. In OGLE-III data for the LMC the number ratio of 1O/2O to F/1O Cepheids is 3.2. The corresponding ratio from the EROS-2 data is only 1.8 (Marquette et al. 2009). This large difference is likely due to lower amplitudes of the 1O/2O Cepheids and the lower peak detection threshold in OGLE-III data111We thank Igor Soszyński for this explanation..
3 Masses, metallicity an evolutionary status of the 1O/2O Cepheids in LMC
Distribution of Cepheid periods is governed by various factors, such as recent history of star formation, time spend in the instability strip (IS), , and mode selection. All these factors have been discussed by Alcock et al. (1999) in the context of the MACHO data on the LMC Cepheids. The value of strongly depends on star mass and evolutionary status. For stars with intermediate masses, the first crossing of the IS takes place in the post-main sequence phase before helium ignites and it is by two orders of magnitude faster than subsequent crossings, which occur in the core helium burning phase (e.g. Alibert et al. 1999). Naturally, most of Cepheids are expected to be in the latter phase and have masses close to the minimum value, , for the blue loop of the evolutionary track in the HR diagram to reach up to the IS.

In the OGLE-III sample containing over three thousands objects, we expect to find a significant number of stars during fast crossing of the IS. Furthermore, there are problems with explaining short period Cepheids as core helium burning objects (Alibert et al. 1999; Alcock et al. 1999).
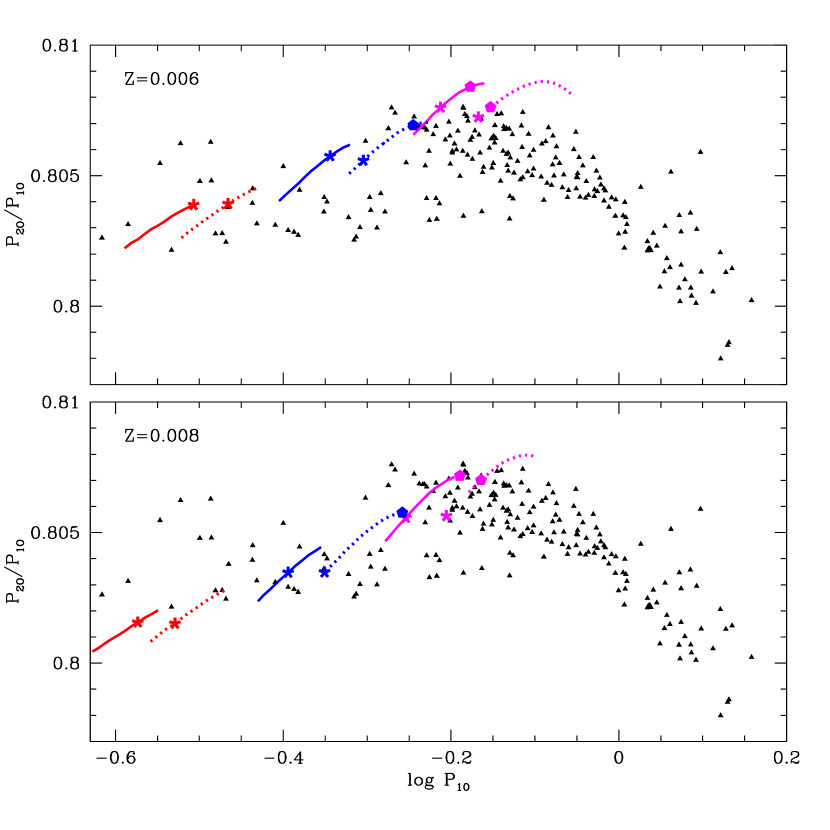
Estimate of is a subtle matter. The value depends on description of macroscopic element mixing, which is still uncertain. To illustrate the situation, we plot in the upper panel of Fig. 3 the evolutionary tracks downloaded from BASTI library (Pietriferini et al. 2004) for metallicity parameter , which is regarded representative for young stars in the LMC. The tracks were calculated in two versions, adopting and 0.2 in the expression for the overshooting distance , where is the pressure distance scale at the core boundary. The IS boundaries shown in Fig. 3 refer to simultaneous instability of the first and second overtones and they are shifted to higher temperatures by about 0.015 in relative to those for the F mode. The lower panel compares the PL relations corresponding to two versions of the tracks at stellar masses 3 and with the OGLE-III data for the 1O/2O Cepheids. All pulsation properties were calculated by us (see below) for deep envelope models at the surface parameters taken from tracks and adopting the same input physics. Here and in the rest of this paper, the Wesenheit index for the models is calculated adopting 18.5 for distance modulus to LMC, which is close to the mean value from recent determinations by various methods (Shaefer 2008). The uncertainty of 0.05 of this value translates in less than in inferred masses of the objects and has no bearing on our conclusions. The bolometric corrections and color indices are taken from Kurucz (2004).
The value derived from the models calculated with is similar to that determined by Alibert et al. (1999) and Girardi et al. (2000). However, with the extent of the loop is not monotonic function of mass. Instead, it reaches maximum at and starts increasing again at . Such a non-monotonic behavior is seen also at but not at , and we do not know what is its origin. What matters for us here is that at corresponding to young LMC stars, with BASTI evolutionary tracks, we get helium burning Cepheids of shortest periods. Still, as we may see in the bottom panel of Fig. 3, by far most of the 1O/2O Cepheids in LMC have shorter periods. Are they then objects which cross the instability strip for the first time? There are also problems with this hypothesis. At the short periods, the first crossing models with masses and moderate overshooting seem consistent with data. However, this is not true for majority of the objects. Note that models of the same mass lay on nearly the same line in the plane, regardless of crossing number and the overshooting distance. We may see that most of the stars have masses closer to 3 than and they are overluminous. One may consider higher value but the question is why such objects are so numerous though would be over 5 times less than for the short period objects and over 30 times less than for the objects in helium burning phase.
It would be easy to identify the IS crossing if we could measure rate of period change arising from evolutionary changes. Furthermore, such measurements would provide valuable constraints on stellar models. Unfortunately, the fast period changes, which are most often found in overtone Cepheids, have clearly non-evolutionary origin (Poleski 2008).
The use of the second overtone periods allowed us to constrain parameters of the 1O/2O Cepheids. In our study, we partially relied on the old Warsaw codes calculating stellar models and their linear nonadiabatic oscillation properties (see e.g. Pamyatnykh 1999). However, these codes are not suitable for determination of the IS boundaries because convection is treated in a crude way. Therefore for this aim, we used a new code developed by Smolec and Moskalik (2008a), which calculates radial mode frequencies and growth rates for unfitted envelope models with a more sophisticated treatment of convection, which allows to determine the range of the instability in a more or less reliable way. If the envelope is deep enough, the frequencies are found very close to those calculated using the old code for complete models with the same surface parameters. Our evolutionary models in the first crossing phase of the IS were used only as the reference. We varied luminosity relative to the evolutionary models, calculated with no overshooting and looked for the increment needed to explain periods of the 1O/2O Cepheids. As the standard in our calculation we adopted the Asplund et al. (2002) heavy element mixture (hereafter AGS) and the OP opacity data (Seaton 2005). Convection is treated in the way described recently by Smolec & Moskalik (2008a) and as the standard, we adopt . We will briefly discuss consequences of alternative choices. There are more parameters describing time-dependent convection. Here, we use their values adopted by Baranowski et al. (2009, set B in Table 3) and they will not be discussed in the present paper.
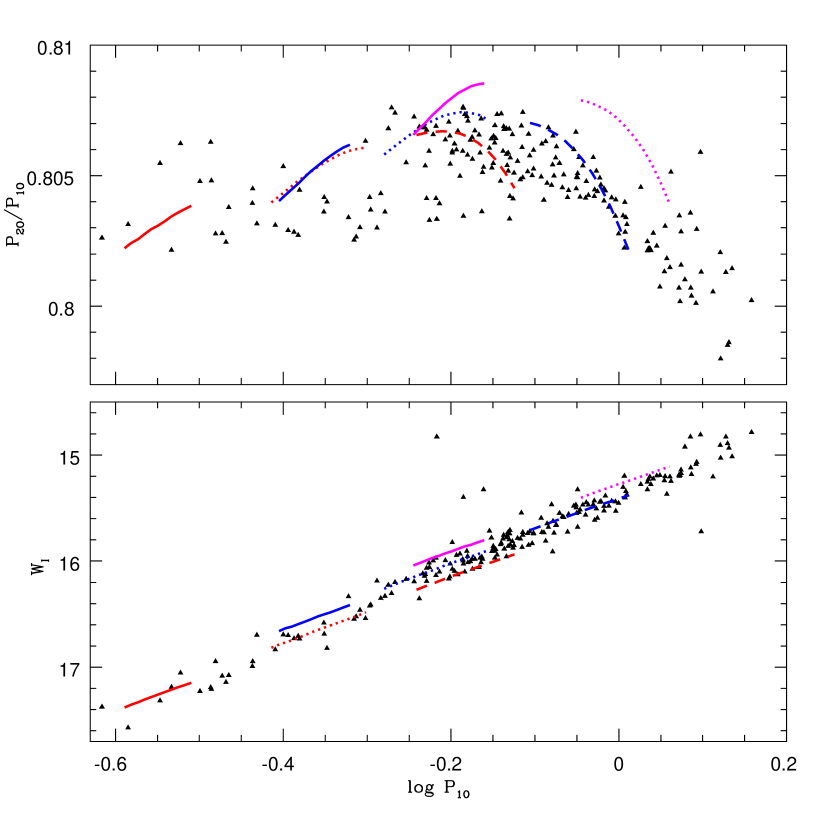
The main results of our survey are shown in Figs. 4 and 5, where calculated relations are superimposed on the data points. Let us first focus on the PL relations shown in the bottom panels. The effect of metallicity decrease is similar to that of luminosity increase, that is, the segments are moved upward along the constant mass line. With only few exceptions, the points are contained between the 2.5 and lines. We may see also that beyond the short period range, a significant excess of luminosity over the model values is required to match the data. The period ratio is indeed a sensitive probe of the excess.
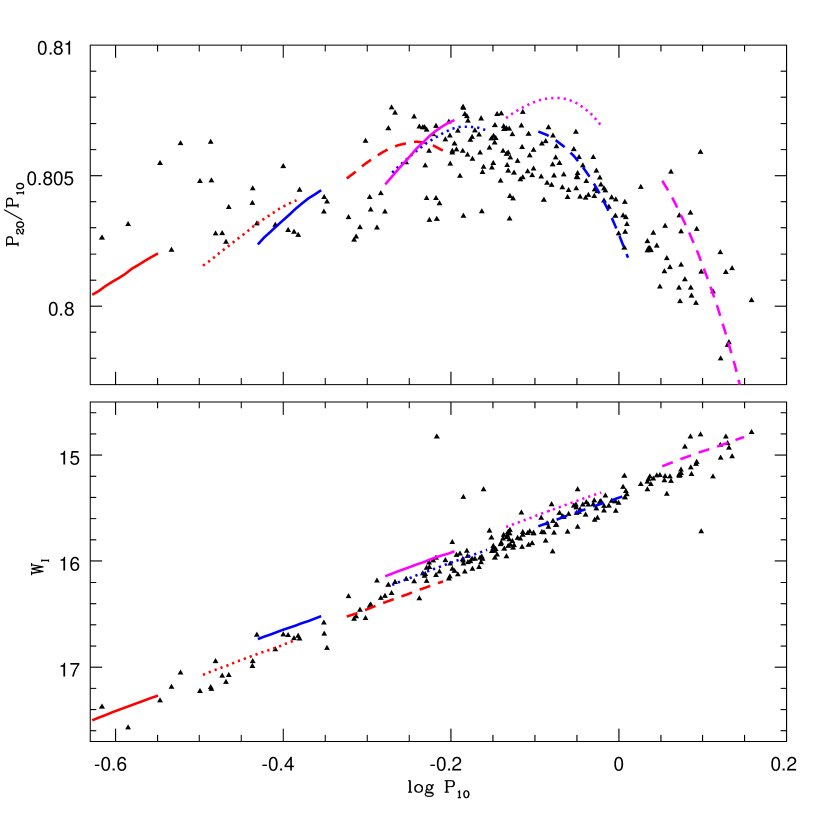
Most of the data points in the Petersen diagram fall into the range limited by the segments corresponding to and , and luminosity excess at . Somewhat higher values of and/or are needed to explain data at longest periods. Note in Fig. 5 that at the segment corresponding to and runs through the mid of the data band for the longest periods. In Fig. 4 () such segment is not shown because it is outside the data range. In general, the models with are in better agreement with data but require larger . Considerable spread of points at the shortest periods may perhaps reflect spread in the metallicity.
The period ratios are quite sensitive to . Using these data, Buchler (2008) derived ranges for Cepheid metallicities in various galaxies. For stars in the LMC he found the -ranges (0.0024, 0.0093) and (0.0062, 0.0124) with the AGS and GN93 (Grevesse and Noels 1993) mixtures, respectively. His calculations were done with the OPAL opacity data while in our survey we used the AGS mixture and OP data. Thus, it was important to check how use of different mixtures and opacities affects our conclusions. We found that the dependence on is much less sensitive to the choice of mixture than to opacity data. At low frequencies, where the effects are the largest the upward shifts of the ratio caused by use of the GN93 mixture is below 0.0005, while the downward shift caused by use of the OPAL data is about 0.002, which is similar to that caused by using instead of 0.006. Thus, we do not see contradiction between Buchler’s and ours assessment of Cepheid metallicity in the LMC.
The choice of has only a minor effect on ratio at specified . The use of instead of 1.5 causes the 0.0005 upward shift and a similar size downward shift is obtained with . Our conclusion regarding luminosity excess holds for different choices of the opacity data, heavy element and the mixing length. However, because of the significant difference of the period ratios calculated with the two opacity data, we do not put much weight to our assessment of the values.
Post-main sequence models with moderate overshooting and masses between 2.5 and explain data for the objects with . To this category belong the seismic models of the two 1O/2O/3O Cepheids constructed by Moskalik and Dziembowski (2005). Certainly also the third such pulsator, which have has similar characteristics (see Fig. 1) may be interpreted as a standard post-main sequence object. The same applies to the two F/1O/2O pulsators. Note in that figure that the star at has the period ratio significantly higher than the 1O/2O stars. However, to explain the observed characteristics of the great majority of the 1O/2O Cepheids in the LMC, we require a luminosity excess larger than that caused by overshooting within normally considered range, if indeed these objects are crossing the IS for the first time. From our code at , we find . The corresponding increment is by some 50% higher at . From plots in Fig. 3, we may find that BASTI tracks yield somewhat higher increment resulting from overshooting and also that the difference in between the first and second crossing is about 0.25 at .
The large number of objects in the and mass range with luminosity excess is difficult to explain. If they are crossing the IS before helium ignition then the excessive overshooting may mimic rotation induced mixing. Then, the problem to explain is why they are more numerous than the short period objects though, with larger luminosity, they spend less time in the IS. Alternative possibility is that the long-period 1O/2O Cepheids represent a special population of helium burning objects with relatively high fractional mass of the hydrogen-free core.
4 Resonances and origin of double-mode pulsation
The origin of double-mode pulsation is still lacking satisfactory explanation (Smolec and Moskalik, 2008b). Two ways in which the pulsation instability may lead to such a terminal state were first discussed by Dziembowski and Kovács (1984). One is a non-resonant way acting through the feed-back effect of pulsation on mean radial structure. The alternative way involves resonant excitation of stable modes. A large number of papers has been devoted to the 2:1 resonance between the F and 2O modes. The coupling to stable mode prevents the F mode to saturate driving and allows excitation of the 1O, which is linearly unstable. The effect was seen in the numerical models but only with unrealistic parameters (Kovács and Buchler 1988, Smolec 2008). The three-mode resonance was shown by Smolec and Moskalik (2007) to cause double-mode pulsation in models of Cephei stars. Unfortunately, we do not know any star of this type with only two radial modes excited.
Both types of resonances, but involving higher order-overtones, occur in certain range of our models. In Fig. 6, we marked positions of the resonances within (and somewhat outside) of the IS in our models. Here, only complete evolutionary models calculated with and 0.2 were used. We may see that at the equality occurs within the IS for our models. In fact a signature of resonance centered at in the Fourier coefficient for the 1O Cepheids has been reported in S2008. Inspecting plots in Fig. 6, we may see that this implies masses around for models calculated with and somewhat higher if is less.
The resonant coupling to the strongly damped the 5O mode may cause a significant amplitude reduction of the 1O amplitude allowing excitation of the 2O, which is normally disfavored. This effect may explain origin of the double-overtone pulsation in the short-period objects. At longer periods, the resonance occurs outside of the IS. We do not have complete models for most of the long-period objects so unfitted envelope models are unreliable for calculation of high overtone frequencies and one could speculate that the resonance might return to the IS in the range of the decreasing . However, we think that this is unlikely because we found that for the BASTI models, which reproduce periods at the bottom of this branch, we are far from resonance.
The resonance occurs within the IS only in a narrow intermediate period range. Thus, also this resonance cannot explain origin of double-mode pulsation in most of the 1O/2O Cepheids. Such form of pulsation must predominantly arise from non-resonant saturation of the driving effect. Only nonlinear modeling may tell us how does it happen. The histogram in Fig. 2 yields an important hint for such a modeling. Selecting a model with the first overtone period near 0.7 d, we are very likely to see the instability developing to double-overtone pulsation.
The explanation in terms a non-resonant saturation seems difficult for the two 1O/3O Cepheids (Soszyński et al. 2008). In these cases, the 2:1 resonance between the second and the seventh overtone may play a role. The resonant coupling to this strongly damped mode may totally prevent excitation of the second overtone.
5 Conclusion and discussion
We confronted the OGLE-III data on 203 LMC Cepheids, in which first and second overtones are excited (the 1O/2O Cepheids), with model calculations. The data used in our paper include periods and the Weseinheit index, , which combined with the LMC distance is used as the measure of the absolute magnitude.
Unlike the F/1O, the 1O/2O Cepheids cannot be regarded an exceptional form of stellar pulsation. Not only the latter form occurs three times more often among the LMC objects but, more importantly, in a certain period range around 0.7d, it is the most common form. The data on the 1O/2O Cepheids present interesting challenges to stellar evolution and pulsation theory.
The period-luminosity ( relation constrains masses of the objects. Nearly all of them fall in the 2.5 to mass range. The Petersen diagram () yields constrains on metallicity and luminosity. We focused on the former, adopting for the metallicity parameters and 0.008. The inferred luminosities for the objects with the first overtone period shorter than about 0.6 d are well explained with post-main sequence stellar models crossing the instability strip for the first time, calculated assuming no or moderate overshooting.
However, for objects with longer periods, which constitute majority of the sample, we find significant luminosity excess. If these are objects crossing the instability strip before helium ignition then the excess could be due to an overlarge overshooting, perhaps connected with fast rotation. The difficulty of this explanation is the short crossing time of the instability strip while the number of the objects showing the luminosity excess is relatively high. If these are helium burning objects then the difficulty is the low inferred mass. Standard evolutionary track for stars with and acceptable metallicity do not enter the instability strip in this evolutionary phase. We must postulate a non-standard evolution leading to objects with relatively massive helium cores. This could be a large mass loss in the red giant phase or again a large overshooting in the main sequence phase. The former option would be plausible if the stars were in binary systems for which we do not have yet any evidence. The latter option remains to be verified by means of new stellar evolutionary calculations. The result is not clear. As a warning, we have to recall that in certain mass range, BASTI models calculated without overshooting entered the instability strip in helium burning phase while those with overshooting did not (see Fig. 3).
The challenge to stellar pulsation theory is to identify conditions leading to excitation of two rather than one pulsation mode and to explain why the 1O/2O pulsators are more frequent than F/1O and also 2O. We found two types of resonances, which may promote double-overtone pulsation but only in the case of the short-period objects. For the majority of stars, such pulsation may result only from non-resonant saturation. In a certain period range this must be the preferred form of terminal development of the instability. The question why it is so may be answered only with the help of nonlinear modeling of stellar pulsation.
We thank Igor Soszyński and Radosław Poleski for providing us data used in our plots. We also thank Igor Soszyński and Alosha Pamyatnykh for reading preliminary version of this paper and suggesting improvements. This work has been supported by the Polish MNiI grant No 1 P03D 011 30.
References
- \refitemAlcock, C.,Allsman, R.A., and Alves, D.R.1999\ApJ117920
- [1] \refitemAlibert, Y., Baraffe, I., Hauschildt, P., and Allard, F. 1999 Å344551
- [2] \refitemAsplund. M., Grevesse N., Sauval A.J., Allende Pieto, C., and Kisleman D. 2004 Å 417 751
- [3]
- [4] Baranowski, R., Smolec, R., Dimitrov, W., et al.2009 submitted to \MNRAS
- [5] \refitemBuchler, J. R.2008\ApJ 680 1412
- [6] \refitemBuchler, J. R. and Szabó, R.2007\ApJ 660 723
- [7] \refitemDziembowski, W.A. and Kovács, G1984\MNRAS196731
- [8] \refitemGirardi, L., Bressan, A., Bertelli, G., and Chiosi, C. 2000 \AAS141371
- [9]
- [10] Grevesse, N. and Noels, A., 1993 in Origin and Evolution of the Elements, eds. Pratzo M., Vangioni-Flam E., and Casse M., Cambridge Univ. Press, p. 15
- [11] \refitemIglesias, C.A. and Rogers, F.J. 1996 \ApJ 464 943
- [12] \refitemKolláth, Z., Beaulieu, J.P., Buchler, J.R., and Yecko P. 1998 \ApJ 502 L55
- [13] \refitemKovács, G. and Buchler, J. R.1988\ApJ308661
- [14]
- [15] Marquette, J.M., Beaulieu, J.P., Buchler, J.R., et al. 2009 ArXiv:0901.0995v1 [astro-ph]
- [16] \refitemMoskalik, P. and Dziembowski, W.A. 2005Å4341077
- [17]
- [18] Moskalik, P., Kołaczkowski, Z., and Mizerski, T. 2004 in Variable Stars in the Local Group, ed. D.W. Kurtz, and K. Pollard, ASP Conf. Ser., Vol. 310, 498
- [19]
- [20] Kurucz R. L.2004 http://kurucz.harvard.edu
- [21] \refitemPamyatnykh, A.A. 1999 \Acta 49 119
- [22] \refitemPetersen, J.O. 1973 Å 27 89
- [23] \refitemPietrinferni, A., Cassisi, S., Salaris, M., and Castelli, F. 2006 \ApJ 642797
- [24] \refitemPoleski, R.2009\Acta58313
- [25] \refitemSchaefer, B.E.2008\AJ135112
- [26] \refitemSeaton, M.2005\MNRAS362L1
- [27] \refitemSimon, N.R.1982\ApJ260L87
- [28]
- [29] Smolec, R. 2008 ArXiv:0803.1441 [astro-ph]
- [30] \refitemSmolec, R. and Moskalik, P.2007\MNRAS377645
- [31] \refitemSmolec, R. and Moskalik, P.2008a\Acta58193
- [32] \refitemSmolec, R. and Moskalik, P.2008b\Acta58233
- [33] \refitemSoszyński, I., Poleski, R., Udalski, A., Kubiak, M., Szymański, M., Pietrzyński, I., Wyrzykowski, L., Szewczyk, O., and Ulaczyk, K. 2008a\Acta58163
- [34] \refitemSoszyński, I., Poleski, R., Udalski, A., Kubiak, M., Szymański, M., Pietrzyński, I., Wyrzykowski, L., Szewczyk, O., and Ulaczyk, K. 2008b\Acta58163
- [35] \refitemSzabó, R., Kolláth, Z. and Buchler, J.R. 2004Å 425 627