Short-term spectroscopic monitoring of two cool dwarfs with strong magnetic fields ††thanks: Partly based on observations obtained at the European Southern Observatory at La Silla, Chile in programs 078.C-0161(A) and 078.C-0161(B), and partly based on observations collected at the Centro Astronómico Hispano Alemán /CAHA) at Calar Alto, operated jointly by the Max-Planck-Institut für Astronomie and the the Insituto de Astrofísica de Andalucía (CSIC).
Abstract
Context. There is now growing evidence that some brown dwarfs (BDs) have very strong magnetic fields, and yet their surface temperatures are so low that the coupling is expected to be small between the matter and the magnetic field in the atmosphere. In the deeper layers, however, the coupling is expected to be much stronger.
Aims. This raises the question of whether the magnetic field still leads to the formation of structures in the photosphere and of a solar-like chromosphere and corona.
Methods. We carried out a spectroscopic monitoring campaign in which we observed ultracool dwarfs that have strong magnetic fields: the BD LP944-20 and 2MASSW J0036159+182110. The objects were monitored over several rotation periods spectroscopically. LP944-20 was observed simultaneously in the optical and in the near infrared regime, 2MASSW J0036159+182110 only in the infrared. From the spectra, we determined the temperature of the objects in each spectrum, and measured the equivalent width in a number of diagnostically important lines. Temperature variations would indicate the presence of warm and cold regions, variations in the equivalent widths of photospheric lines are sensitive to the structure of cloud layers, and is a diagnostic for chromospheric structures.
Results. Both dwarfs turned out to be remarkably constant. In the case of LP944-20, the -variations are K, and the rms-variations in the equivalent widths of small. We also find that the equivalent widths of photospheric lines are remarkably constant. We did not find any significant variations in the case of 2MASSW J0036159+182110 either. Thus the most important result is that no significant variability was found at the time of our observations. We find that H-line is in emission but the equivalent width is only Å. When comparing our spectra with spectra taken over the past 11 years, we recognize significant changes during this time.
Conclusions. We interpret these results as evidence that the photosphere of these objects are remarkably homogeneous, with only little structure in them, and despite the strong magnetic fields. Thus, unlike active stars, there are no prominent spots on these objects.
Key Words.:
Stars: low-mass, brown dwarfs, activity, magnetic fields, individual: LP944-20, 2MASSW J0036159+1821101 Introduction
Brown dwarfs (BDs) are objects that are not massive enough to sustain stable thermonuclear fusion of hydrogen at their centers but are distinguished from gas-giant planets by their ability to burn deuterium. Among many other things, these objects are interesting because their properties place them some where between planets and stars. In M-stars, strong chromospheric emission lines are originating from an active chromosphere, and thus provide evidence of correspondingly strong magnetic fields generated by a stellar dynamo. Basri & Marcy (basri95 (1995)) studied the relation between and the strength of for very low-mass stars and one BD-candidate. Surprisingly, they find that the most rapid rotator of their sample exhibits no emission in . In a subsequent study, Mohanty & Basri (mohanty03 (2003)) find a drastic drop in activity and a sharp brake in the rotation-activity connection. The emission levels in very late type dwarfs are much lower than in earlier types and often undetectable, in spite of very rapid rotation. The photometric variability of L-type BDs has henceforth been interpreted in terms of clouds and weather, as on planets (Morales-Calderón et al. morales (2006) and the reference therein). At first glance, magnetic fields and spots seemed to be unimportant for the structure of the atmospheres of old BDs.
The detection of X-ray emission and large flares indicating the presence of a corona and of strong magnetic fields in at least some BDs changed the picture dramatically (Liebert et al. liebert03 (2003); Burgasser & Putman burgasser05 (2005); Preibisch & Zinnecker preibisch02 (2002); Preibisch et al. preibisch05 (2005); Ozawa et al. ozawa05 (2005); Fleming et al. fleming03 (2003)). The question thus arises whether BDs are like M-dwarfs in this respect. For both active and inactive stars, there is a correlation between the X-ray and the radio emission of the corona, which works for over 10 orders of magnitude in activity level. It was thus very surprising when Berger et al. (berger05 (2005)) discovered that LP944-20 is 4 to 5 orders of magnitude too bright in the radio regime. The same phenomena has also been observed for a few other BDs. The coronae of these objects thus must be quite different from those of normal stars! Observation at 8.46 GHz with the VLA of the old BD 2MASSW J0036159+182110 (from now on called 2M0036+1821) imply a magnetic field strength of 175 G at about two radii above the surface of the object (Berger berger06 (2006)). The field strength at the surface must be . Thus, it is now clear that at least these old BDs have strong magnetic fields indeed, but are these BDs just like active stars?
It is possible that not only do the coronae differ from those of stars but also the topology of the magnetic field itself. As shown by Dobler et al. (dobler06 (2006)), fields of fully convective objects (like BDs) are expected not to be concentrated in small spots but to be distributed on a global scale. Chabrier & Küker (chabrier06 (2006)) find that the field for fully convective objects should be generated by an dynamo: the fields on a large scale, and are non-axis symmetric. In this respect it is interesting to note that Zeeman-Doppler imaging observation of a fully convective, rapidly rotating 0.28 -star shows a strong, large-scale, but axisymetric field (Donati et al. donati06 (2006)). This shows that more observations and theoretical work are needed to understand the fields of fully convective objects. That brown dwarfs are rapid rotators (Zapatero Osorio et al. zapatero06 (2006)) must, however, be related to the absence of any winds that are similar to the solar-wind that could brake these objects. Possibly the absence of such winds is related to the topology of the magnetic field, rather than to its strength. A solar magnetic field topology is only expected for very old, very massive BDs, which have conductive cores. The other difference for the solar-like stars is the low temperature of the atmosphere, resulting in a low degree of ionization in the atmosphere, which in turn lead to a very low degree of coupling between the magnetic field and the atmosphere. The coupling between the gas and the magnetic field is usually described in terms of the Reynolds number (where is a length scale, a velocity scale, and the magnetic diffusivity (Priest priest82 (1982)).
Following a suggestion by Meyer & Meyer-Hofmeister (meyer99 (1999)), Mohanty et al. (mohanty02 (2002)) studied the conductivity of the atmospheres of late M and L dwarfs. They find that the atmospheres have very high electrical resistivities because they are predominantly neutral. For example, ionization fraction at is only between and for late M down to L-dwarfs. On the other hand, underneath the surface the temperature increases rapidly, and the conductivity of the matter is expected to be high. Thus in the interior of the object, the magnetic field will interact with the convection. If this is the case, we might speculate that such effects might then lead to the formation of hotter and cooler regions at the surface, if the convective energy transport from the interior is affected by the magnetic field. In summary, at least some BDs have strong magnetic fields. We also know that they have flares, a chromosphere, and a corona, but what the effects of the fields on the atmosphere are is not known.
2 The two BDs
An ideal object for studying the effects of magnetic fields in BDs is LP944-20. Using measurements of the equivalent widths of the LiI 6708-line, together with models, Tinney (tinney98 (1998)) estimate, the age of LP944-20 to be between 475 and 650 Myrs., and he estimates the mass to be between 0.056 and 0.064 . Pavlenko et al. (pavlenko07 (2007)) finds a two-orders-of-magnitude higher abundance of lithium compared to the older determination, corresponding to the expected primordial abundance, which would imply that the object is very young. However, this somehow contradicts the result by Johnas et al. (johnas07 (2007)) that the lithium of BDs with similar mass is already reduced at an age of only 1 Myr. Also, because the object does not have a disk (Apai apai02 (2002)), it is unlikely that it is very young. Ribas (ribas03 (2003)) finds that LP944-20 is a member of the Castor moving group. They both conclude that the age is Myr, and the mass between 0.049 and 0.055 . The parallax is mas, which corresponds to a distance of pc (Tinney tinney96 (1996)).
LP944-20 is not only relatively young and nearby, it is also very active. Large flares have been observed in the X-ray regime (e.g. Rutledge et al. rutledge00 (2000)). Berger et al. (berger05 (2005)) found that it is a non-thermal radio source at GHz-frequencies, indicating the presence of a magnetic field. Interestingly, while the object is very bright at GHz-frequencies, the quiescent X-ray flux has not been detected yet. The upper limit is (Martín & Bouy martin02 (2002)). Using the relation between X-ray luminosity and the flux at GHz-frequencies of stars, LP944-20 is in fact more than 5 orders of magnitude too bright in the radio regime (Berger et al. berger06 (2006)). From the radio observations, the authors estimate a magnetic field strength of 135 G during a flare, and 95 G in quiescence at a distance of about one BD-radius from the surface. The rotation velocity is , which implies a rotation period of hours (Guenther & Wuchterl guenther03 (2003)).
If LP944-20 were an active star, we would expect it to have large spots. If there were spots on the surface of the object, we would see temperature variations. Interestingly, Tinney & Tolley (tinney99 (1999)) derive temperature variations of only . However, they monitored the object only for 1.5 hours, and as will be discussed below, the TiO-lines are not ideal for determining the temperature for an object with a spectral class of M9V. In a previous campaign, we took 15 spectra with UVES of LP944-20 and found radial velocity variations in the optical regime but none in the infrared regime (Martín et al. martin06 (2006)).
Another suitable object for this project is 2M0036+1821. It is the brightest, very cool dwarf at GHz-frequencies in the northern hemisphere, and it also has a strong magnetic field (Berger berger06 (2006)). Similar to LP944-20, 2M0036+1821 dramatically violates the stellar relation for the flux ratio between the radio and X-ray regime as it is a factor to -times too bright in the radio regime. Unfortunately, the age, hence the mass, of 2M0036+1821 is not known. Given a spectral type of L3.5 (Kirkpatrick et al.kirkpatrick00 (2000)), (Cushing et al. cushing06 (2006)), or (Reid et al. reid00 (2000)), and the fact that we do not know the age of the object we cannot be certain whether it is a brown dwarf or a very low-mass star. We thus call it an ultra cool dwarf. The parallax is mas, which implies a distance of pc (Dahn et al. dahn02 (2002)).
The measurement derived by Zapatero Osorio et al. (zapatero06 (2006)) and the quasi-period found by Berger et al. berger05 (2005) indicate that the rotation period is possibly about 3 hours. Maiti (maiti07 (2007)) detected significant photometric variations in the R and I-bands. The is 0.01 and 0.03 mag in the two bands, respectively. Curiously, when the amplitude of the variations is larger in the R-band, the amplitude in the I-band appears to be smaller, and when it is larger in the I-band, it appears to be smaller in the R-band. Ménard et al. (menard02 (2002)) and Zapatero Osorio et al. (zapatero05 (2005)) reported on the detection of optical (R and I) linear polarization in 2M0036+1821, which the authors ascribed to the presence of atmospheric clouds. Sengupta & Kwok (sengupta05 (2005)) reproduce the polarization observations of 2M0036+1821 at three different wavelengths by using a rotational velocity of 15 and a grain size of 0.46 micron. According to the most recent measurements, the rotation speed of 2M0036+1821 is a factor of 2 higher. If rotational velocity is increased, grain size should become smaller for the same polarization degree.
3 Strategy of the observations
The aim of this work is to find out whether strong magnetic fields lead to surface features or not. To answer this question, we carried out a time series of spectroscopic observations of LP944-20 and 2M0036+1821. From an analysis of optical and X-ray data of several BDs, Tsuboi et al. (tsuboi03 (2003)) found an indication of a relation between the X-ray brightness and the strength of the -line, which they interpret as a signature that the chromosphere (traced by ) is heated by the corona. By monitoring the strength of the -line, we thus might trace the structures not only in the chromosphere but in the corona as well. The second important parameter is the surface temperature, which can be determined by deriving the PC3-coefficient (Martín et al. (martin99 (1999)); ratio of the fluxes in the 823.5 to 826.5 nm, versus the fluxes in the 754.0 to 758.0 nm- band.).
Apart from monitoring the -line and possible changes in the temperature, the spectra also allow us to monitor any possible changes in the cloud structure. Allard et al. (allard01 (2001)) calculated spectra for a dense grid of -values. These calculations show that clouds greatly reduce the equivalent widths of photospheric lines and that the effects of clouds are more pronounced in the J-band than in the K-band. New calculations by Burrows et al. (burrows06 (2006)) show that not only the presence of clouds can be inferred from IR spectra but also the distribution of condensables in the atmosphere.
4 LP944-20
4.1 EFOSC2 observations of LP944-20
A time series of spectra of LP944-20 was taken with the EFOSC2 (ESO Faint Object Spectrograph and Camera Version 2), which is operated at the ESO 3.6-m telescope at La Silla, Chile. Grism no. 5 was used for the observations. This grism covers the wavelength region between 520 nm and 935 nm. The resolving power is =450 with the 1.2 arcsec slit. The slit was put at the parallactic angle to minimize light-loss. Standard IRAF tasks were used for bias subtraction, flat-fielding, sky-subtraction, extraction, and wavelength calibration of the spectra. Unfortunately, EFOSC2 has very strong problems with fringes in the red part of the spectrum. The fringes depend on the telescope position, so that flat fields had to be taken during the nights. Although the amplitude of the fringes were greatly reduced after flat-fielding, the remaining fringes were still so strong that the wavelength region between 720 and 935 nm was affected. The spectra were flux-calibrated using the standard star EG21. LP944-20 was observed in the night from 29 to 30 November 2006, in which 14 spectra were taken and in the night from 30 November to the 1 of December 2006 in which 16 spectra were taken. An average spectrum is shown in Fig. 1 which also includes all the SOFI spectra. A log of the observations of LP944-20 is shown in Table 1.
| object | wavelength- | HJD | date | UT |
|---|---|---|---|---|
| region | start - end | start - end | ||
| [nm] | 2450000+ | |||
| 2M0036+1821 | 1070-1340 | 3987.3660-3987.4666 | 8. Sep 2006 | 20:40 - 23:05 |
| 1580-2400 | 3987.3770-3987.4438 | 8. Sep 2006 | 20:53 - 22:32 | |
| 2M0036+1821 | 1070-1340 | 3987.6123-3987.6924 | 9. Sep 2006 | 2:35 - 4:30 |
| 1580-2400 | 3987.6208-3987.7009 | 9. Sep 2006 | 2:47 - 4:42 | |
| 2M0036+1821 | 1070-1340 | 3988.5699-3988.5891 | 10. Sept 2006 | 1:33 - 2:01 |
| 1580-2400 | 3988.5785-3988.5804 | 10. Sept 2006 | 1:46 - 1:49 | |
| 2M0036+1821 | 1070-1340 | 3988.6554-3988.7101 | 10. Sept 2006 | 3:36 - 4:55 |
| 1580-2400 | 3988.6654-3988.7018 | 10. Sept 2006 | 3:51 - 4:43 | |
| 2M0036+1821 | 1070-1340 | 3989.4429-3989.6953 | 10./11. Sept 2006 | 22:31 - 4:34 |
| 1580-2400 | 3989.4519-3989.6858 | 10./11. Sept 2006 | 22.43 - 4:20 | |
| LP944-20 | 520-935 | 4069.5794-4069.8551 | 30. Nov 2006 | 1:50 - 8:27 |
| 938-1646 | 4069.5475-4069.8607 | 30. Nov 2006 | 1:04 - 8:35 | |
| 1502-2538 | 4069.5558-4069.8697 | 30. Nov 2006 | 1:16 - 8:48 | |
| LP944-20 | 520-935 | 4070.5919-4070.8578 | 1. Dec 2006 | 2:08 - 8:31 |
| 938-1646 | 4070.5530-4070.8259 | 1. Dec 2006 | 1:12 - 7:45 | |
| 1502-2538 | 4070.5641-4070.8349 | 1. Dec 2006 | 1:28 - 7:58 |


4.2 Results from the optical spectroscopy of LP944-20
As a first step, we determined the temperature of LP944-20 using the PC3-coefficient from Martín et al. (martin99 (1999)) and from this the spectral types. This coefficient allows the spectral types to be determined for objects in from M3 to L5. For converting the spectral type into , we used the values given in Burgasser & Kirkpatrick (burgasser06 (2006)), Burgasser (burgasser07 (2007)), and Nakajima (nakajima04 (2004)). Determining the absolute temperature of an object with a late-spectral type is difficult, because it involves not only the measurement of the ratio of the fluxes in two spectral regions but also the uncertainty of the model spectra. It is thus not surprising that the errors can be as large as several hundred K. However, our main focus is to detect temperature variations. Detecting these is much easier. For example, it is known that the PC3-coefficient changes linearly with temperature between about spectra type M3V and M8V (about 2400 to 3300 K). Within this region, we can thus convert even a small variation in the PC3-coefficient into a variation of the temperature. Since even the smallest variation of the temperature will lead to a change in the PC3-coefficient, we are also able to detect the small variations of the temperature. The accuracy with which the variation of the PC3-coefficient can be detected is given by the accuracy of the flux-calibration in the 754.0 to 826.5 nm regime, which is dominated by the variable extinction in the Earths atmosphere. Of course we always used the observations of the flux-standard EG12 which were closest to the observations LP944-20. For estimating the accuracy of the flux-calibration, we simply used the other observations of EG12 and derived the errors from the difference. We thus overestimated the errors somewhat. We find an upper limit of the error of in this wavelength regime. This corresponds to an error of for LP944-20. The results are shown in Fig. 3. While we are mainly interested in temperature variations, it is interesting to note that values derived match the temperature obtained by Mohanty & Basri (mohanty03 (2003)) using HIRES spectra very well.
The left panel of Fig. 3 is for the observations taken 2006 Sept 30, the right one for the data taken of 2006 Dec 1. There are no significant variations in the temperature. Since is only 15 K, it seems that we slightly overestimated the errors. From Fig. 3, we estimate that the temperature variations are .
Tinney & Tolley (tinney99 (1999)) used the TiO-bandhead for determining the temperature variations. While this coefficient works well up to a spectral type M6V, it is also affected by the distribution of condensables in the atmosphere at later spectral types. Nevertheless, to be able to compare our results with those of Tinney & Tolley (tinney99 (1999)), we determined the ratio of the fluxes in the 704.2 to 704.6 nm -band and in the 712.6 to 713.5 nm -band (e.g. -coefficient Reid et al. reid95 (1995)). If we express the -coefficient in temperature, we find an upper limit of . Thus, our results agree with the previous ones.
Fig. 2 shows the spectrum -region taken by us (Nov 2006), together with a spectrum taken with the red arm of the ISIS spectrograph on the WHT by Martín in September 2000, and a spectrum taken in August 1995 with the CTIO 4m Blanco telescope (Gelino, Kirkpatrick & Burgasser gelino (2008)). In these 11 years, the -emission of LP944-20 has noticeably changed. In our spectra is clearly in emission. Is this component variable on shorter time-scales? The average of the (pseudo-)equivalent width (pEW) of is in the first night and in the second night. Looking at Fig. 4 one might speculate that there could be flare-like event in the second night, however, spectra of higher resolution would have been necessary in order to find out, whether this was a flare or not. In either case, we did not detect any strong flare-activity in H. In Fig. 6 the is plotted against the equivalent width of . As expected there is no correlation, and and can best be described as almost constant. For completeness, we also show in Fig. 5 the measurements the NaD line.


4.3 SOFI observations of LP944-20
Simultaneous with the optical spectroscopy, we also obtained infrared spectroscopy with SOFI, which is mounted on the NTT. During the nights we alternated between the BLUE and the RED low-dispersion grism. The BLUE grisms gives a resolution of =930 and the RED grism one of 980 with the 0.6 arcsec slit used for the observations. The BLUE grism covers the wavelength region from 938 to 1646 nm, and the RED grism 1502 to 2538 nm. Thus, with both grisms, we covered the J, H, and K-bands. Standard IRAF tasks were used for bias subtraction, flat-fielding, sky-subtraction, extraction, and wavelength calibration of the spectra. A log of the observations of LP944-20 is shown in Table 1. The spectra were flux-calibrated using B4V star HD955, which was observed each night. Along with LP944-20, we took spectra of DENIS-P 104814.9-395604 and LP647-13, both of which are supposed to have the same spectral type as LP944-20.
4.4 Results from the infrared observations of LP944-20
As mentioned above, the presence of clouds in the atmosphere of the BD reduces the equivalent widths of the absorption lines, especially in the J-band. Changing cloud patterns and changes in the position of the cloud layers also lead to changes in the equivalent widths of spectral lines. Since we already know that the temperature of LP944-20 is almost constant, by measuring the equivalent widths of photospheric lines we thus plumb the cloud layers of it. We choose in the J-band the following lines: The Na I doublet (1138 and 1141 nm), another Na I line (1268 nm), the two potassium doublets (1168, 1177 nm, and 1243, 1254 nm), and two FeI lines (1189 and 1197 nm). In the H-band there are basically only the K I doublet line at 1517 nm, and the FeH-band heads at 1583, 1591, and 1625 nm. In the K-band there are the Ca I triplet at 1980 nm and the NaI doublet at 2206 and 2209 nm. Additionally, there are the CO band heads. Because the four potassium lines are the strongest lines in the J-band, these lines give the highest accuracy. After determining the equivalent widths of the potassium lines in each spectrum, we divided the values obtained by the average equivalent width of each line. In this way we obtained the normalized variations in the equivalent width for each potassium line. Fig. 7 shows the variation of the average EW of the four lines at 1168, 1177, 1243, and 1254 nm. Rather than show the average EW of the four lines, we normalized the data to one. A value of 0.9, for example, means that that on average the EW of the four lines are 10% smaller than usual. None of the measurements deviates by more than 3 from unity. Thus, there are no significant variations of the equivalent width. The rms-variations of the K I-lines of LP944-20 are , and the variance of the measurements is 2.8%. From the absence of significant variations in the equivalent width, we conclude that the atmosphere of LP944-20 must be very homogeneous indeed.

5 2M0036+1821
5.1 MAGIC observations of 2M0036+1821
Using MAGIC and the Resin-Replica-Grism it is possible to take spectra of the H and K-band simultaneously. Another setting is then required for the J-band. The J-band grism covers the region from 1070 to 1340 nm, and the H&K band grism the 1580 to 2400 nm region. The resolution is =450 in the J band, and 350 in the H and K bands. We monitored 2M0036+1821 for three nights. Each night, we observed the standard star 88 Peg three or four times. Unfortunately, the observing run was plagued by clouds so that in the first two nights observation were only possible for about two hours, and in the last for about 8 hours. A log of the observations of 2M0036+1821 is shown in Table 1. During all three observing nights, clouds interfered with the observations, making the analysis of the data complicated. Standard IRAF tasks were used for bias subtraction, flat-fielding, sky-subtraction, extraction, and wavelength calibration of the spectra.
5.2 Results from the infrared observations of 2M0036-1821
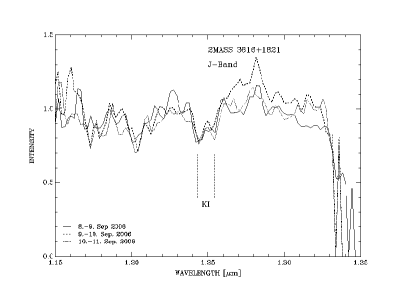
Fig. 8 shows the measurements of the relative change in the equivalent width of the two potassium (KI) lines at 1243 nm and 1254 nm. Again, none of the measurements deviate by more than 3 from unity. There are no significant variations in the equivalent widths of these lines. The errors of the measurements for 2M0036+1821 are, however, much larger than those for LP944-20, as the variance is only . Fig. 9 shows the average J-band spectra taken those three nights. Again, we do not see significant variations of the KI lines at 1243 and 1254 nm in these three nights. Using the K-band spectra and the , and coefficients from Burgasser et al. (burgasser02 (2002)) we determined the “spectral type” of each spectrum, and then converted the spectral type into a temperature. Because of the less than perfect observing conditions, these measurements are not very accurate, and we find an upper limit for any possibly variations of K.

6 Discussion and conclusions
Because the temperature of the photosphere of stars is high, the magnetic field interacts with the plasma forming the well-known spots of active stars. The presence of such spots can be inferred from changes of the brightness, color and temperature. Thus, active stars show variations in the brightness, color, and temperature. In late-type stars chromospheric structures of stars are so closely related to the magnetic field that chromospheric lines like Ca II H,K are often used as a proxy for the magnetic field. For example, Schrijver et al. (schrijver89 (1989)) derived a relation between the flux in the emission core of these lines and the magnetic flux. This relation has recently been studied in more detail by Rezaei et al. (rezaei07 (2007)). Large-scale variations in the temperature and the emission of chromospheric lines are common features of active stars.
We monitored two BDs over several rotation periods that are known to have very strong magnetic fields of kG field strength. In contrast to active stars, we find that the temperature variations are remarkably small. In the case of LP944-20 we find that the temperature change over the surface is . In other words, there cannot be any large, cool spots on this object like on active stars.
Changes in the cloud-patterns would lead to changes in the equivalent widths of spectral lines. Molina & Moreno (molina92 (1992)), for example, found changes of typically 30% of the equivalent widths for the strength of the and lines in different years and different regions on Jupiter. In contrast to this, the rms-variations of the K I-lines of LP944-20 are only . Both BDs must be remarkably homogeneous, with very little structure on them.
We recognize, however that is now in emission, and there might even be some flare-like variability, demonstrating that this object is active. To study flares or inhomogeneities of the chromosphere, spectra of higher resolution are required. The observation of flares in LP944-20 would not be surprising, as huge flares have already been observed on this object in the X-ray regime (Rutledge et al. rutledge00 (2000)). The natural explanation for the absence of spots is that the coupling between the gas and the magnetic field is so low that the magnetic field does not create visible structures. The coupling is low because of the low temperature of the BDs. The same explanation cannot hold for the chromosphere because of its high temperature. As can be seen in Fig. 4, the variations of the pEW of on time scales of a few hours are probably real but data of higher spectral resolution is needed to study the variations in detail. The relative size in the variations in the pEW would appear similar to what is observed on active stars. However, we clearly did not observe a high level of flare-activity. We thus conclude that BDs, even with very strong magnetic fields, are unlike active stars, as they do not have prominent spots. Since clouds are not affected by the magnetic fields, there is no reason why their structure should not change. Observationally, we find that the cloud structure remains remarkably constant.
Since it is shown in this paper that there are no significant spectroscopic changes in the ultracool dwarfs LP944-20 and 2M0036+1821, these objects can be considered as useful spectroscopic standards for their spectral class. Our average spectra will be made available to the community through the online IAC ultracool dwarf catalog (Martín, Cabrera & Cenizo martin05 (2005)).
Acknowledgements.
We are grateful to the user support group of ESO/La Silla and the 2.2-m-telescope of the Centro Astronómico Hispano Alemán /CAHA) at Calar Alto. This work made use of the SIMBAD database operated by the CDS, France, and data products from the Two Micron All Sky Survey, which is a joint project of the University of Massachusetts and the Infrared Processing and Analysis Center/California Institute of Technology, funded by the National Aeronautics and Space Administration and the National Science Foundation. We also acknowledge the use of the library of M, L, T dwarf spectra managed by C. Gelino, D. Kirkpatrick, A. Burgasser. We would also like to thank the referee for helping us to improve the manuscript.References
- (1) Allard, F., Hauschildt, P. H., Alexander, D. R., Tamanai, A., & Schweitzer, A. 2001, ApJ, 556, 357
- (2) Apai, D., Pascucci, I., Henning, T., Sterzik, M. F., Klein, R., Semenov, D., Günther, E., & Stecklum, B. 2002, ApJ, 573, L115
- (3) Basri, G., & Marcy, G. W. 1995, AJ, 109, 762
- (4) Mohanty, S., & Basri, G. 2003, ApJ, 583, 451
- (5) Berger, E., et al. 2005, ApJ, 627, 960
- (6) Berger, E. 2006, ApJ, 648, 629
- (7) Burgasser, A. J., et al. 2002, ApJ, 564, 421
- (8) Burgasser, A. J., & Putman, M. E. 2005, ApJ, 626, 486
- (9) Burgasser, A. J., & Kirkpatrick, J.D. 2006, ApJ, 645, 1485
- (10) Burgasser, A. J., Cruz, K.L., Kirkpatrick, J.D. 2007, ApJ, 657, 494
- (11) Burrows, A., Sudarsky, D., & Hubeny, I. 2006, ApJ, 640, 1063
- (12) Chabrier, G., Küker, M. 2006, A&A, 446, 1027
- (13) Cruz, K. L., & Reid, I. N. 2002, AJ, 123, 2828
- (14) Cushing, M. C., et al. 2006, ApJ, 648, 614
- (15) Dahn, C. C., et al. 2002, AJ, 124, 1170
- (16) Dobler, W., Stix, M., & Brandenburg, A. 2006, ApJ, 638, 336
- (17) Donati, J.-F., Forveille, T., Cameron, A. C., Barnes, J. R., Delfosse, X., Jardine, M. M., & Valenti, J. A. 2006, Science, 311, 633
- (18) Fleming, T. A., Giampapa, M. S., & Garza, D. 2003, ApJ, 594, 982
- (19) Gelino, C., Kirkpatrick, D., Burgasser, A. 2008 http://spider.ipac.caltech.edu/staff/davy/ARCHIVE
- (20) Guenther, E. W., & Wuchterl, G. 2003, A&A, 401, 677
- (21) Golimowski, D. A., et al. 2004, AJ, 127, 3516
- (22) Johnas, C.M.S., Guenther, E.W., Joergens, V., Schweitzer, A., & Hauschildt. P.H., 2007, A&A, in press
- (23) Kirkpatrick, J. D., et al. 2000, AJ, 120, 447
- (24) Liebert, J., Kirkpatrick, J. D., Cruz, K. L., Reid, I. N., Burgasser, A., Tinney, C. G., & Gizis, J. E. 2003, AJ, 125, 343
- (25) Maiti, M. 2007, AJ, 133, 1633
- (26) Martín, E. L., Delfosse, X., Basri, G., Goldman, B., Forveille, Th., Zapatero Osorio, M. R. 1999, ApJ118, 2466
- (27) Martín, E. L., & Bouy, H. 2002, New Astronomy, 7, 595
- (28) Martín, E. L., Cabrera, J., & Cenizo, E. 2005, Astronomische Nachrichten, 326, 1026
- (29) Martín, E. L., Guenther, E., Zapatero Osorio, M. R., Bouy, H., & Wainscoat, R. 2006, ApJ, 644, L75
- (30) Ménard, F., Delfosse, X., & Monin, J.-L. 2002, A&A, 396, L35
- (31) Meyer, F., & Meyer-Hofmeister, E. 1999, A&A, 346, L13
- (32) Mohanty, S., Basri, G., Shu, F., Allard, F., & Chabrier, G. 2002, ApJ, 571, 469
- (33) Mohanty, S., & Basri, G. 2003, ApJ, 583, 451
- (34) Molina, A., & Moreno, F. 1992, A&A, 256, 299
- (35) Morales-Calderón, M., et al. 2006, ApJ, 653, 1454
- (36) Nakajima, T., Tsuji, T., & Yanagisawa, K. 2004, ApJ, 607, 499
- (37) Ozawa, H., Grosso, N., & Montmerle, T. 2005, A&A, 429, 963
- (38) Pavlenko, Y.V., Jones, H.R.A., Martín, E.L., Guenther, E., Kenworthy, M., & Zapatero Osorio, M.R. MNRASin press.
- (39) Preibisch, T., & Zinnecker, H. 2002, AJ, 123, 1613
- (40) Preibisch, T., et al. 2005, ApJS, 160, 582
- (41) Priest, E. R. 1982, Geophysics and Astrophysics Monographs, 21,
- (42) Reid, I. N., Hawley, S. L., & Gizis, J. E. 1995, AJ, 110, 1838
- (43) Reid, I. N., Kirkpatrick, J. D., Gizis, J. E., Dahn, C. C., Monet, D. G., Williams, R. J., Liebert, J., & Burgasser, A. J. 2000, AJ, 119, 369
- (44) Rezaei, R., Schlichenmaier, R., Beck, C. A. R., Bruls, J. H. M. J., & Schmidt, W. 2007, A&A, 466, 1131
- (45) Ribas, I. 2003, A&A, 400, 297
- (46) Rutledge, R. E., Basri, G., Martín, E. L., & Bildsten, L. 2000, ApJ, 538, L141
- (47) Schrijver, C. J., Cote, J., Zwaan, C., & Saar, S. H. 1989, ApJ, 337, 964
- (48) Sengupta, S., & Kwok, S. 2005, ApJ, 625, 996
- (49) Tsuboi, Y., Maeda, Y., Feigelson, E. D., Garmire, G. P., Chartas, G., Mori, K., & Pravdo, S. H. 2003, ApJ, 587, L51
- (50) Tinney, C. G. 1996, MNRAS, 281, 644
- (51) Tinney, C. G. 1998, MNRAS, 296, L42
- (52) Tinney, C. G., & Tolley, A. J. 1999, MNRAS, 304, 119
- (53) Zapatero Osorio, M. R., Caballero, J. A., & Béjar, V. J. S. 2005, ApJ, 621, 445
- (54) Zapatero Osorio, M. R., Martín, E. L., Bouy, H., Tata, R., Deshpande, R., & Wainscoat, R. J. 2006, ApJ, 647, 1405