Anomalous asymmetry of the Fermi surface in the YBa2Cu4O8 high temperature superconductor revealed by Angle Resolved Photoemission Spectroscopy
Abstract
We use microprobe Angle-Resolved Photoemission Spectroscopy (ARPES) to study the Fermi surface and band dispersion of the CuO2 planes in the high temperature superconductor, YBa2Cu4O8. We find a strong in-plane asymmetry of the electronic structure between directions along and axes. The saddle point of the antibonding band lies at a significantly higher energy in the -direction (,0) than the -direction (0,), whereas the bonding band displays the opposite behavior. We demonstrate that the abnormal band shape is due to a strong asymmetry of the bilayer band splitting, likely caused by a non-trivial hybridization between the planes and chains. This asymmetry has an important implication for interpreting key properties of the Y-Ba-Cu-O (YBCO) family, especially the superconducting gap, transport and results of inelastic neutron scattering.
pacs:
74.25.Jb, 74.72.Hs, 79.60.BmIt is commonly accepted that the conduction electrons/holes in the CuO2 planes play an essential role in determining the electronic properties of the high- superconductors. It is however not totally understood how the charge carriers arrange themselves and interact with each other. Strong - axis asymmetry of both the normal- and superconducting-state electronic properties have been observed in the Y-Ba-Cu-O (YBCO) family especially in YBa2Cu3O7-δ (Y123) and YBa2Cu4O8 (Y124), which possess double CuO2 planes sandwiched between single and double CuO chains, respectively. The London penetration depth () measured by muon-spin rotation shows a strong asymmetry ( in Y123 Ager ; Rustem_Y123 and in Y124 Rustem_Y124 ). Here the - and -axis directions are perpendicular to and along the chains, respectively. Angle Resolved Photoemission Spectroscopy Lu observes a 50 larger gap along the chain direction in Y123. Angle-Resolved Electron tunneling in Y123/Au/Nb junctions also indicates a superconducting gap () asymmetry of Smilde . Most recent reports using a similar technique, however, show only 20 difference Kirtley . Many theoretical models have been proposed in order to explain these results. These include the formation of striped phases Kivelson , orthorhombicity of the crystal structure Zhou , proximity coupling between chains and planes Morr , broken time-reversal symmetry Varma , and an admixture of +s pair states Tsuei . The spin dynamics in Y123, observed in inelastic neutron scattering (INS) experiments, also shows a significant - axis asymmetry in the vicinity of the wavevector (1/2,1/2) Mook ; Arai ; Bourges ; Hinkov . Mook Mook2 report almost one-dimensional patterns and suggest that this is evidence for existing stripe phases Kivelson . In contrast, recent INS results on Y123 show that the spin fluctuations are two-dimensional, although they have a strong - asymmetry Hinkov . In the latter case, a Fermi-liquid-based scenario might be more relevant for explaining the asymmetric spin dynamics Zhou ; Eremin ; Schnyder .
Part of the controversy arises due to a lack of detailed band structure measurements in YBCO, since most ARPES experiments performed on this material have focused on YBa2Cu3O7-δ (Y123) variety, which has fractional oxygen stoichiometry in the chains. These samples do not cleave well and suffer complications due to the ordering of oxygen in the chains. The resulting unstable sample surfaces makes ARPES spectra difficult to interpret Lu . Although band calculations predict a significant axis asymmetry of the band structure in CuO2 planes due to a plane-chain coupling, that is often ignored when interpreting the electronic properties because of a lack of the experimental evidence supporting these predictions. Until now, there have been no observation of axis asymmetry in the Fermi surface of the CuO2 planes by angle-resolved photoemission spectroscopy (ARPES) in YBCO Campuzano ; Gofron ; Shen1 ; Lu ; Borisenco_YBCO ; Nakayama ; Kondo . We chose YBa2Cu4O8 (Y124) for studying the band structure by ARPES, because Y124 has a fixed oxygen stoichiometry that results in a much more stable surface than that of Y123 and avoids problems due to oxygen ordering in chains. We have previously demonstrated that the plane and chain bands can be distinguished by using both a small UV beam (50-100m) and a tunable incident photon energy Kondo . This lead to observation of significant differences in the momentum dependence of the bilayers splitting between Bi2212 and YBCO. Since it was sufficient for this purpose to acquire data only along nodal and -axis directions, we could not make statements about the axis anisotropy. In this letter, we compare the band structure along and axis with much improved data quality due to use of high flux beamline and longer acquisition times. We found a small but a significant axis asymmetry in the band structure, which is mainly due to the variation of the bilayer band splitting being about 40 larger along the -direction. Our results suggest that the coupling between the planes and chains and the consequent asymmetry of the band structure represents a crucial ingredient in our understanding of the origin of the asymmetries in the electronic and magnetic properties of YBCO systems.
Untwinned high quality single crystals of underdoped YBa2Cu4O8 (K) with a sharp superconducting transition (K) were grown by the self-flux method under high oxygen pressure Karpinski . The ARPES experiments were carried out using a Scienta SES2002 hemispherical analyzer mounted on the SIS beamline of the Swiss Light Source (SLS). As a reference for the Fermi energy, we used the spectral edge position of evaporated Au in electrical contact with the sample. The energy and angular resolutions were 20 meV and , respectively. All spectra were measured at 25K using a 33eV photon energy. In order to observe both - and -axis directions with an identical ARPES setting (photon polarization and geometry of analyzer and sample), we rotated the samples by 90∘ following the same micro-domain on the sample surface. We measured several samples and always obtained similar results.
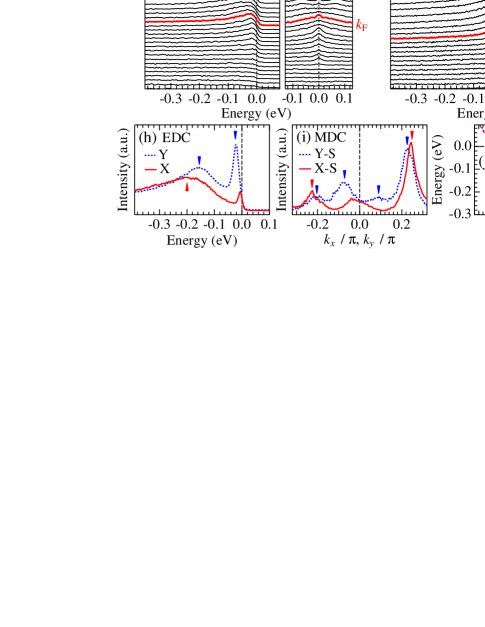
Figures 1 (a,b) and (d,e) show ARPES data (intensity maps and corresponding energy distribution curves (EDCs)) measured along Y-S and X-S, respectively. Those momentum cuts are illustrated in panel (g) along with the Fermi surface of the planes and chains obtained by band calculation Anderson . Around Y (chain direction), both dispersions of the antibonding (AB) and bonding (BB) bands, attributed to the CuO2 bilayer splitting, are clearly observed at higher and lower energies, respectively. Note that, due to matrix element effects, the ARPES intensity at positive is stronger than at negative in the lower energy band. This dependence becomes opposite for the higher energy band. Such anti-correlation is typical for bonding and antibonding bands due to the orthogonality of their wavefunctions Bansil . In contrast to the Y direction, the AB signal is very weak close to X (the direction perpendicular to the chains), whereas the BB is clearly seen. The difference between the two antinodal cuts is more clearly illustrated by plotting the EDCs taken at X and Y in Fig.1 (h), and the momentum distribution curves (MDCs) at the Fermi level in Fig.1 (i). We find that the BB dispersion around X displays a deeper bottom (by 40meV) and a wider Fermi closing than that around Y. Although a large peak corresponding to an energy state of AB is seen below the Fermi level (around meV) in the EDC at Y (panel (h)), the peak edge of a weak AB signal appears to be pinned to the at X. We used the symmetrization method Norman as well as the MDC peak position to determine the Fermi crossing points; EDCs are reflected about the Fermi level and added to the unreflected ones. This technique removes the Fermi function and enables us to immediately identify the Fermi crossing. The symmetrized EDCs of Fig. 1 (b) and (e) are plotted in the Fig. 1 (c) and (f), respectively. When the dispersion crosses , two peaks in the symmetrized EDC due to presence of low-lying energy states merge into a single one at Fermi momentum. This is clearly seen both for AB and BB with moving away from Y along Y-S (panel (c)). The superconducting gap is not observed in these spectra because the YBCO sample surface is known to be overdoped after cleaving Kondo ; DamascelliNP . Along X-S (panel (f)), the BB clearly shows a Fermi crossing. On the other hand, the symmetrized EDC very close to X has only one peak, which indicates that there is no Fermi crossing in AB along this cut. The shape of symmetrized EDC is sensitive to the value of experimental energy resolution Mesot . However we can confirm this from a behavior of the spectral intensities along -X shown in Fig. 3(d); the intensity sharply decreases toward X, which indicates that the AB goes beyond near X and only a small spectral tail is seen on the occupied side. In Fig. 1 (j), we summarize the AB and BB dispersions of the occupied states determined from the peak position of the EDCs in panels (b) and (e) along with tight binding fitting curves TB . Although our data represents the overdoped state, the band anisotropy reported here is expected to be valid for other doping levels because it is well known that doping of cuprates amounts to a rigid band shift Damascelli .
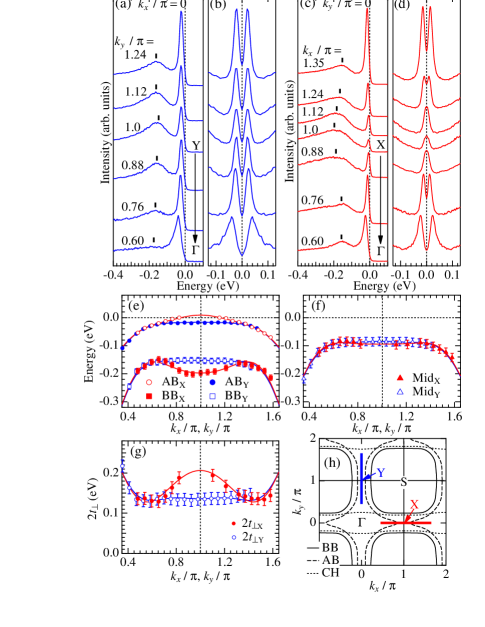
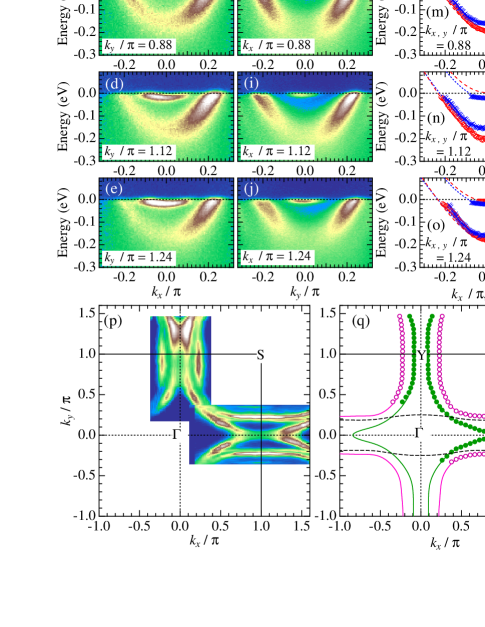
Figure 2 (a-e) and (f-j) show ARPES intensity maps around Y and X measured along various momentum cuts parallel to Y-S and X-S, respectively. Around X (panel (f-j)), the ARPES intensity near rapidly increases while moving away from the antinode due to the appearance of AB on the occupied side. This is in contrast to the strong intensity of the AB observed for all momentum cuts around Y (panels (a-e)). We determine both AB and BB dispersions from the EDC peak positions, and plot the results near Y and X in Fig. 2(k-o); each panel is for two momentum cuts at equal distance from X and Y. The difference in the dispersions between the two regions reaches a maximum close to the antinodes, then decreases toward the nodes. The strong - axis asymmetry of the Fermi surfaces is further visualized in Fig. 2(p) by plotting the ARPES intensity integrated within meV of as a function of and . In Fig. 2(q), we plot the Fermi crossing points extracted from the MDC peak positions at . We find an interesting topology of the Fermi surface which appears to be hole-like (centered around S) close to Y and electron-like (centered around ) close to X. We should note that the previously reported data Kondo was consistent with hole-like Fermi surface close to X. This difference is most likely due to small variation of doping for different batches of samples. In the previous work, the data was measured only in X quadrant and reflected about symmetry planes to simply show the 2D character of Fermi surface that is different from 1D chain. In this work, we measured both X and Y directions on the same cleave to compare these in the same condition. We could get the same result for several samples cut out from a sample batch with high quality.
In order to understand what causes the significant asymmetry, we carefully compare the band dispersions along -Y and -X. Figure 3 (a-b) and (c-d) show the EDCs and the corresponding symmetrized EDCs measured along -Y and -X, respectively (see panel (h)). We determined the energy states of BB (AB) along the two momentum cuts from the peak positions of the EDCs (symmetrized EDCs), and plot these in panel (e). We find that the BB along -X has a convex downward dispersion centered at X. This is in contrast with all other dispersions (AB along -X and both AB and BB along -Y), which show a convex upward shape. We stress that the former band shape is specific to Y124 because the latter has been observed in many cuprates Damascelli such as Bi2Sr2CaCu2O8+δ (Bi2212), Bi2Sr2CuO6+δ (Bi2201), and La2-xSrxCuO4 (LSCO). Figure 3(g) shows the splitting energy (, where is the interlayer hopping integral within the bi-layers) estimated along -X and -Y. It is clear that along -X has a bump close to X and the difference from that along -X is about (meV). We therefore conclude that the characteristic band shape close to X (the electron-like Fermi surface in AB and a convex downward dispersion in BB) is a result of an enhanced bilayer coupling around X, which pushes the AB up above and pushes down the BB more than that around Y. In Fig. 3(f), we plot the mean-energies of AB and BB along -X and -Y. We find that the dispersion is almost identical along the both cuts, which indicates that the in-plane orthorhombicity of the Y124 crystal structure () Karpinski causes only a negligible - axis asymmetry of the hopping integral (). This small crystal orthorhombicity, therefore, is unlikely to cause a significant - asymmetry of the hopping (). The enhanced bilayer coupling around X, where the Fermi surface of chains is adjacent to that of planes, is most likely due to a non trivial (momentum dependent) coupling between the chains and planesYu ; Anderson . It is worth noting that the current value of (160meV) is about 4 times smaller than that estimated from band calculations (600 meV) Anderson , which indicates that strong electron correlations suppress the interlayer hopping.
In conclusion, we find a strong in-plane asymmetry of the electronic structure in YBa2Cu4O8 (Y124). The Fermi surface in the antibonding band has a hole-like shape (centered around S) close to Y and an electron-like shape (centered around ) close to X. This asymmetry is caused by an enhanced bilayer band splitting close to X, where the Fermi surface of chains is adjacent to that of planes, likely due to a nontrivial coupling between the chains and planes. These results are crucial to understand the abnormal asymmetries observed in the superconducting gap and the significantly anisotropic spin dynamics, strongly supporting a number of recent theoretical works Zhou ; Eremin ; Schnyder .
We thank O. K. Andersen and Jörg Schmalian for useful remarks. This work was supported by Director Office for Basic Energy Sciences, US DOE and Swiss NCCR MaNEP. Work at the Ames Laboratory was supported by the Department of Energy-Basic Energy Sciences under Contract No. DE-AC02-07CH11358. R. K. gratefully acknowledges support of Swiss National Science Foundation and K. Alex Müler Foundation.
References
- (1) C. Ager, F. Y. Ogrin, S. L. Lee, C. M. Aegerter, S. Romer, H. Keller, I. M. Savić, S. H. Lloyd, S. J. Johnson, E. M. Forgan, T. Riseman, P. G. Kealey, S. Tajima and A. Rykov, Phys. Rev. B 62, 3528 (2000).
- (2) R. Khasanov, S. Strässle, D. Di Castro, T. Masui, S. Miyasaka, S. Tajima, A. Bussmann-Holder, and H. Keller, Phys. Rev. Lett. 99, 237601 (2007).
- (3) R. Khasanov, A. Shengelaya, J. Karpinski, A. Bussmann-Holder, H. Keller and K. A. Müller, J. Supercond. Nov. Magn. 21, 81 (2008).
- (4) D. H. Lu, D. L. Feng, N. P. Armitage, K. M. Shen, A. Damascelli, C. Kim, F. Ronning, Z.-X. Shen, D. A. Bonn, R. Liang, W. N. Hardy, A. I. Rykov and S. Tajima, Phys. Rev. Lett. 86, 4370 (2001).
- (5) H. J. H. Smilde, A. A. Golubov, Ariando, G. Rijnders, J. M. Dekkers, S. Harkema, D. H. A. Blank, H. Rogalla, and H. Hilgenkamp, Phys. Rev. Lett. 95, 257001 (2005).
- (6) J. R. Kirtley, C. C. Tsuei, Ariando, C. J. M. Verwijs, S. Harkema, and H. Hilgenkamp, Nature physics 2, 190 (2006).
- (7) S. A. Kivelson, I. P. Bindloss, E. Fradkin, V. Oganesyan, J. M. Tranquada, A. Kapitulnik and C. Howald, Rev. Mod. Phys. 75, 1201 (2003).
- (8) T. Zhou and Jian-Xin Li, Phys. Rev. B 69, 224514 (2004).
- (9) D. K. Morr and A. V. Balatsky, Phys. Rev. Lett. 87, 247002 (2001).
- (10) C. M. Varma, Phys. Rev. Lett. 83, 3538 (1999).
- (11) C. C. Tsuei and J. R. Kirtley, Rev. Mod. Phys. 72, 969 (2000).
- (12) H. A. Mook, Pengcheng Dai, S. M. Hayden, G. Aeppli, T. G. Perring, F. Doan, Nature 395, 580 (1998).
- (13) H. A. Mook, Pengcheng Dai, F. Dogan and R. D. Hunt, Nature 404, 729 (2000).
- (14) M. Arai, T. Nishijima, Y. Endoh, T. Egami, S. Tajima, K. Tomimoto, Y. Shiohara, M. Takahashi, A. Garrett, and S. M. Bennington, Phys. Rev. Lett. 83, 608 (1999).
- (15) P. Bourges, Y. Sidis, H. F. Fong, L. P. Regnault, J. Bossy, A. Ivanov, and B. Keimer, Science 288, 1234 (2000).
- (16) V. Hinkov, S. Pailhés, P. Bourges, Y. Sidis, A. Ivanov, A. Kulakov, C. T. Lin, D. P. Chen, C. Bernhard, and B. Keimer, Nature 430, 650 (2004).
- (17) I. Eremin and D. Manske, Phys. Rev. Lett. 94, 067006 (2005).
- (18) A. P. Schnyder, D. Manske, C. Mudry and M. Sigrist, Phys. Rev. B 73, 224523 (2006).
- (19) J. C. Campuzano, G. Jennings, M. Faiz, L. Beaulaigue, B. W. Veal, J. Z. Liu, A. P. Paulikas, K. Vandervoort, H. Claus, R. S. List, A. J. Arko, and R. J. Bartlett, Phys. Rev. Lett. 64, 2308 (1990).
- (20) K. Gofron, J. C. Campuzano, A. A. Abrikosov, M. Lindroos, A. Bansil, H. Ding, D. Koelling, and B. Dabrowski, Phys. Rev. Lett. 73, 3302 (1994).
- (21) Matthias C. Schabel, C.-H. Park, A. Matsuura, Z.-X. Shen, D. A. Bonn, Ruixing Liang, and W. N. Hardy, Phys. Rev. B 57, 6090 (1998).
- (22) S. V. Borisenko, A. A. Kordyuk, V. Zabolotnyy, J. Geck, D. Inosov, A. Koitzsch, J. Fink, M. Knupfer, B. Buc̈hner, V. Hinkov, C. T. Lin, B. Keimer, T. Wolf, S. G. Chiuzbian, L. Patthey, and R. Follath, Phys. Rev. Lett. 96, 117004 (2006).
- (23) K. Nakayama, T. Sato, K. Terashima, H. Matsui, T. Takahashi, M. Kubota, K. Ono, T. Nishizaki, Y. Takahashi, and N. Kobayashi, Phys. Rev. B 75, 014513 (2007).
- (24) T. Kondo, R. Khasanov, J. Karpinski, S. M. Kazakov, N. D. Zhigadlo, T. Ohta, H. M. Fretwell, A. D. Palczewski, J. D. Koll, J. Mesot, E. Rotenberg, H. Keller, and A. Kaminski, Phys. Rev. Lett. 98, 157002 (2007).
- (25) J. Karpinski, E. Kaldis, E. Jilek, S. Rusiecki, and B. Bucher, Nature 336, 660 (1988).
- (26) Jaejun Yu, Key Taeck Park, and A. J. Freeman, Physica C 172, 467 (1991).
- (27) O. K. Andersen, O. Jepsen, A. I. Liechtenstein, and I. I. Mazin, Phys. Rev. B 49, 4145 (1994); J. Phys. Chem. Sol. 56, 1573 (1995).
- (28) A. Bansil, and M. Lindroos, Phys. Rev. Lett. 83, 5154 (1999).
- (29) M. R. Norman, H. Ding, M. Randeria, J. C. Campuzano, T. Yokoya, T. Takeuchi, T. Takahashi, T. Mochiku, K. Kadowaki, P. Guptasarma and D. G. Hinks, Nature 392, 157 (1998).
- (30) J. Mesot, M. Randeria, M. R. Norman, A. Kaminski, H. M. Fretwell, J. C. Campuzano, H. Ding, T. Takeuchi, T. Sato, T. Yokoya, T. Takahashi, I. Chong, T. Terashima, M. Takano, T. Mochiku, and K. Kadowaki, Phys. Rev. B 63, 224516 (2001).
- (31) M. A. Hossain, J. D. F. Mottershead, D. Fournier, A. Bostwick, J. L. McChesney, E. Rotenberg, R. Liang, W. N. Hardy, G. A. Sawatzky, I. S. Elfimov, D. A. Bonn, and A. Damascelli, Nature physics. 4, 527 (2008).
- (32) Andrea Damascelli, Zahid Hussain, and Zhi-Xun Shen, Rev. Mod. Phys. 75, 473 (2003).
- (33) We use seven tight-binding fitting functions with axis anisotropy: , , , , , , . The fitting parameter for obtained tight-binding band [] is (0.242,-0.582,0.189,-0.055,-0.023,-0.007,-0.019,0.029,-0.073,-0.300,0.334) and (0.100,-0.665,0.166,-0.102,-0.108,-0.009,-0.055,-0.002,-0.072,0.350,-0.056) for antibonding-band and bonding-band, respectively.