The galactic population of white dwarfs
Abstract
The contribution of white dwarfs of the different Galactic populations to the stellar content of our Galaxy is only poorly known. Some authors claim a vast population of halo white dwarfs, which would be in accordance with some investigations of the early phases of Galaxy formation claiming a top-heavy initial–mass–function. Here, I present a model of the population of white dwarfs in the Milky Way based on observations of the local white dwarf sample and a standard model of Galactic structure. This model will be used to estimate the space densities of thin disc, thick disc and halo white dwarfs and their contribution to the baryonic mass budget of the Milky Way. One result of this investigation is that white dwarfs of the halo population contribute a large fraction of the Galactic white dwarf number count, but they are not responsible for the lion’s share of stellar mass in the Milky Way. Another important result is the substantial contribution of the – often neglected – population of thick disc white dwarfs. Misclassification of thick disc white dwarfs is responsible for overestimates of the halo population in previous investigations.
1 Introduction
The stellar populations of our Galaxy are divided into the thin disc, thick disc, halo and Galactic bulge. Only the thin disc still produces young stars. Star formation has ceased in all other populations at least 10 Gyr ago and all stars born more massive than the Sun have already evolved away from the main sequence, producing faint remnants: mostly white dwarfs plus some neutron stars and black holes. If the initial–mass–function in the early phases of galaxy formation was as top heavy as claimed by some high redshift investigations (e.g. ? 2005) white dwarfs could be responsible for an important fraction of the Galactic mass budget.
Observations by the MACHO project of microlensing events in the Magellanic Clouds attributed to white dwarfs (?) and a deep proper motion survey for high-velocity white dwarfs by ?) appeared to confirm a high density of white dwarfs in the Galactic halo. Both results remain controversial. A recent analysis and discussion of the MACHO results is provided by ?). The ?) results have been criticised by ?) and ?), but open questions remain. Space densities of thick disc and halo white dwarfs and their contribution to the Milky Way mass budget are still open questions.
I will present a Monte Carlo simulation of the white dwarf populations in our Galaxy. The simulation models the complete Galactic content of white dwarfs and post-AGB stars. Simulated stars can be selected according to criteria resembling the selection of observed samples. After a short description of the model I will describe how it is calibrated using work based on observations of white dwarfs with the Supernova type Ia Progenitor surveY (SPY; ? 2003). This population model will be used to estimate the local space density of the three white dwarf populations and their contribution to the Galactic mass. Sect. 4 compares results with the ?) observations. This contribution finishes with a discussion in Sect. 5.
2 Population model and calibration
The simulations are based on the model of the Galactic structure presented by ?). All four stellar populations, thin disc, thick disc, halo and bulge (the latter not of relevance here) are included. Extinction by the gas and dust layer in the Galactic plane is taken into account using a simple analytical model. The impact of extinction on the white dwarf simulations presented here is not very large. Density laws, but not the zero points, and velocity dispersions were taken from ?). Different from most white dwarf population synthesis models the age dependent scale height and velocity dispersion of the thin disc is taken into account. Stars are created at random positions according to the density laws, a random age and a random mass drawn from a Salpeter initial–mass–function. Short lived star bursts early in the lifetime of our Galaxy are assumed for halo and thick disc. The thin disc is modelled with a constant star formation rate.
The white dwarf progenitor lifetime is computed from the grids of evolutionary models created by the Padova group (?). The simulations presented here used one single metallicity for every population. More realistic metallicity distributions are implemented now. The standard model uses the initial–final–mass relation (IFMR) from ?) and the cooling tracks are a blend of the ?) post-AGB tracks for hot white dwarfs and white dwarf sequences computed by ?). Other IFMRs (e.g., that proposed by ? 2006) and ?) cooling tracks are currently implemented and their effect will be tested.
A direct census of white dwarfs in the Galactic halo is impossible so far. All substantial samples of field white dwarfs are essentially collected from the local volume. Even at (roughly corresponding to the spectroscopic white dwarf sample extracted from the SDSS archives) more than 98% of the observed white dwarfs are closer than 1 kpc in a region still dominated by the thin disc. However, classification of white dwarf membership in the Galactic populations is possible based on kinematic criteria. ? (2003, 2006) combined accurate radial velocity measurements of white dwarfs from the SPY sample (? 2001, 2003) with proper motion data from recent catalogues (UCAC2, USNO-B, SuperCosmos; see ? 2006 for details) supplemented by own measurements. Distances were estimated from the spectroscopic analysis of the SPY spectra (? 2001, ? 2005). This work resulted in a sample of 400 white dwarfs brighter than for which the complete 6-dimensional set of parameters in phase space (spatial and kinematical) is available.
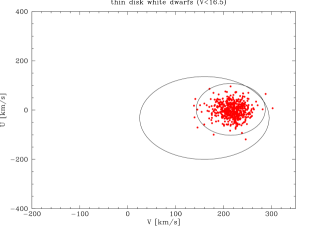
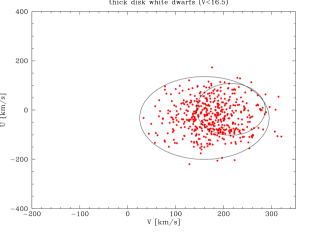
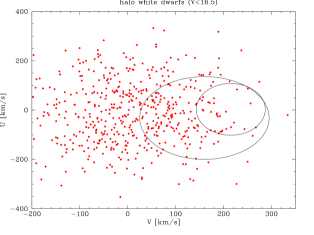
? (2003, 2006) developed criteria to assign population memberships based on kinematical properties. An important tool for this analysis was the position in the plane (examples are shown in Fig. 1). , and are the velocity components in the Galactic reference system. is the component in direction of the Galactic centre, the tangential component in direction of the orbit around the centre and the velocity perpendicular to the Galactic plane. The classification was further refined using the position in the angular momentum–eccentricity plane and a check of the Galactic orbit as computed with the ?) code. While thin disc stars have low eccentricity orbits confined to small distances from the Galactic plane, most thick disc stars have orbits of somewhat larger eccentricity reaching larger distances. Halo stars do not take part in the rotation of the Galactic disc around the centre and can have orbits which reach very large distances from the plane, sometimes with extreme eccentricities. ? (2003, 2006) calibrated the classification criteria with main sequence stars, for which abundance information was available to assess population memberships. The resulting limits in the plane are shown in Fig. 1.
3 Galactic white dwarf populations
?) classified a total of 398 white dwarfs using the criteria outlined above. The results are given in Table 1. We have to keep in mind that the numbers apply to a brightness limited sample () of local white dwarfs. Three more steps are necessary before the white dwarf contributions to the Galactic mass budget can be estimated.
| \brpopulation | ||
| \mrthin disc | 368 | 92% |
| thick disc | 23 | 6% |
| halo | 7 | 2% |
| \br |
3.1 Correction for contamination
It is inevitable that, say, some thick disc stars have kinematical parameters which are typical for thin disc white dwarfs. This is not due to errors in the classification criteria, but an intrinsic property of the populations. This is demonstrated with simulated white dwarf samples in the plane in Fig. 1.
The first plot shows a simulated thin disc sample. The vast majority of stars lies within the thin disc boundaries defined by ?). Only a few white dwarfs are scattered into the thick disc or halo regions. Note that the kinematic properties of the white dwarfs in the simulation are independent of the ? calibration, providing an independent verification of the chosen boundaries. The second plot shows the simulated thick disc sample. Again the outer boundaries are well selected, but it is obvious that quite a few thick disc white dwarfs will be misclassified as members of the thin disc. The third plot shows the result for the halo simulation. As expected the halo white dwarfs are distributed all over the plane, including the regions defined for the thin and thick disc.
The Monte Carlo model of the white dwarf populations can be used to correct for contamination or deficit. Since the corrections depend on the adopted space densities and the SPY results listed in Table 1 are used to calibrate the space densities in the population model, a few iterations are necessary until self-consistency of the corrected numbers is achieved. The final results are shown in Table 2. The main change to the uncorrected numbers is a substantial increase of the thick disc contribution. Corrections for the halo population cancel out.
| \brpopulation | SPY | corr. | vol. limited | Galaxy | ||
| [pc-3] | ||||||
| \mrthin disc | 92% | 86% | 59% | 17% | 2.0 | |
| thick disc | 6% | 12% | 35% | 34% | 3.9 | |
| halo | 2% | 2% | 6% | 49% | 5.6 | |
| \br | ||||||
3.2 Contributions in a volume limited sample
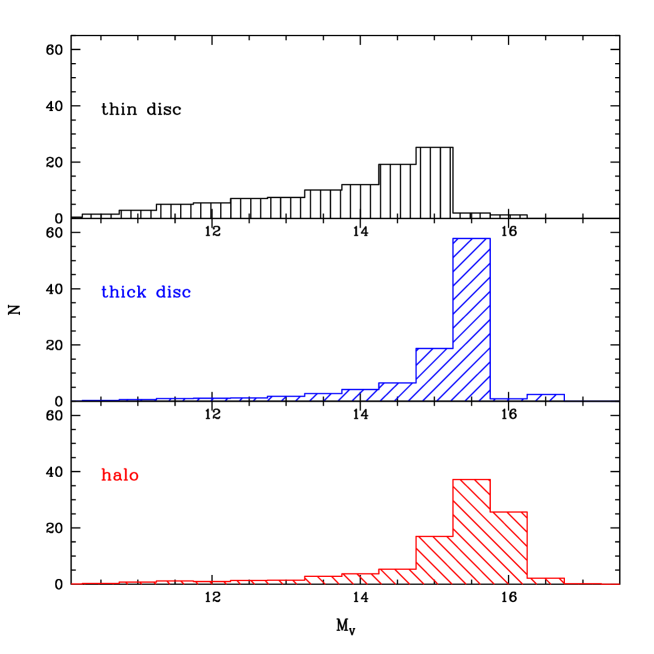
The corrected sample is still brightness limited. Many older and cooler white dwarfs are too faint to be observed. Since the thick disc and the halo populations are very old, they contain many old white dwarfs of very low luminosity. The luminosity functions in Fig. 2 show the much larger fraction of intrinsically faint white dwarfs compared to the thin disc. This results in an overrepresentation of the thin disc in any brightness selected sample of white dwarfs. The simulated white dwarf sample allows a straightforward correction of this bias (Table 2). We can use these results to compute the local space densities of the three populations. The local space density of all white dwarfs was estimated by ?) to be based on a local sample of white dwarfs ( pc). Some objects were added or removed compared to an earlier version of the 13 pc sample (?) and some low proper motion cool white dwarfs are probably still missing (?), but overall this estimate of the space density appears fairly robust and dramatic revisions are not expected for the future. The local white dwarf space densities of the three populations in Table 2 are computed combining the simulation results with the ?) white dwarf space density.
3.3 Galactic white dwarf populations
The final step is the extrapolation of results to the whole Galaxy. This can be easily done from the Monte Carlo simulations which produce a complete census of all white dwarfs in the Galaxy. Most of them are discarded in subsequent steps, because they are too distant or too faint, but the numbers are available after a run. The estimates of total white dwarf numbers and relative fraction of the Galactic population are given in Table 2. The results show that the Galactic population of white dwarfs is dominated by thick disc and halo. However, the white dwarf contribution to the total stellar mass of the Galaxy amounts not not more than 10%, far less than expected from the results of ?) and ?).
A possible explanation for this apparent discrepancy will be discussed in the next section. However, let me first point out the limitations of these estimates. Obviously, the extrapolation relies on the validity of the model of the Galactic structure by ?) implemented in the population model. Possible future modifications of state–of–the–art modelling of our Galaxy could result in significant changes of the white dwarf numbers. It can be expected that the relative numbers of white dwarfs and the relative contribution to the Galactic stellar mass are more robust than the total numbers. Another limitation comes from the number statistics. While the thin disc and thick disc white dwarf samples have a reasonable size, the size of the observed halo white dwarf sample is only seven. This causes a considerably statistical uncertainty. Improvement can only be expected from larger observed samples.
4 The Oppenheimer sample of high proper motion white dwarfs
Using the Monte Carlo model of the Galactic white dwarf population I have shown that the local, brightness limited sample observed by SPY implies a modest contribution of white dwarfs to the Galactic mass budget. This is in contrast to the claims by ?) and ?) of large contributions of white dwarfs in the Galactic halo to the total mass of our Galaxy. Can the different results be reconciled? The interpretation of the MACHO results reported by ?) experienced some revision over the years. The reader is referred to ?) and references therein for a discussion. Here I will have a look at the ?) survey.
? performed a survey of 4900 square degrees near the South Galactic Cap using digitised photographic plates. They selected high proper motion objects with . These were plotted in a reduced proper motion diagram and a list of 126 candidates with a position consistent with halo membership was produced. Follow-up spectroscopy confirmed that most of them were white dwarfs. ? identified 38 candidates, which they claimed were cool white dwarfs in the Galactic halo.
I simulated a sample of white dwarfs using the local densities given in Table 2 and selection criteria similar to ?) survey. The major difference being that the simulations constructed the reduced proper motion diagram using Johnson and filters instead of the photographic and measurements used in their investigation. I tried to define cuts similar to those of ? in the reduced proper motion diagram, but the match will not be perfect. Another effect not modelled in the simulation is caused by the large scatter associated with photographic brightnesses and colours. This can result in objects scattered into and out of the selection regions. However, the expected impact of both effects are relatively minor and will not affect the qualitative interpretation of the results.
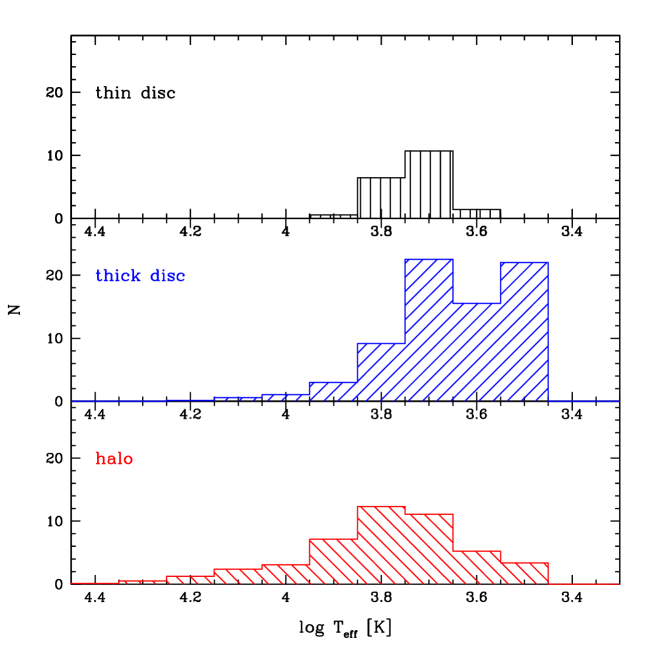
The simulated sample consists of 140 candidates, which is consistent with the ?) numbers. On the observational side it has to be expected that some candidates are missed, e.g. because of blending problems. Moreover, a certain error range has to be assumed for the SPY based calibration of white dwarf densities, as discussed in Sect. 3.3. Fig. 3 displays the temperature distributions of the simulated high proper motion sample. This plot verifies ?) assumption that the thin disc contribution is small. However, the vast majority of cool-ish high white dwarfs in this sample belongs to the thick disc, not the halo population. This was already suspected by ?). The temperature distributions in Fig. 3 are somewhat counter intuitive. As Fig. 2 shows, the (simulated) halo luminosity function contains even more faint and cool white dwarfs than the thick disc sample and typical space velocities are higher. However, space densities of the halo population are lower and typical distances of white dwarfs larger. Thus, while cool halo white dwarfs would easily make it through the proper motion criteria, many of them are not included in the survey because they are fainter than the brightness limit.
The misclassification of thick disc white dwarfs as halo objects is the crucial factor causing the very high estimate for the mass of the population of halo white dwarfs by ?). They overestimated the local density of halo white dwarfs. Since the volume filled by the Galactic halo is much larger than the volume of the thick disc, the extrapolation to the whole Galaxy led to an dramatic overestimate of the mass. With correct classification of the white dwarfs the discrepancy disappears and SPY and ? sample are in good agreement.
5 Discussion and future work
A Monte Carlo simulation of the white dwarf population in our Galaxy is constructed. It was calibrated using population classifications derived by ?) from an analysis of the brightness limited SPY sample. It is straightforward to model selection criteria for observational samples in the Monte Carlo simulation. This was used to apply a statistical correction to the SPY results and compute the contribution of the Galactic populations to the local white dwarf space density and the Galactic number count. The estimated fraction of white dwarfs in the halo is 50% of the Galactic white dwarfs, but the overall contribution of white dwarfs to the Galactic mass budget is only modest. An important result of this study is that the often neglected thick disc white dwarfs contribute a third of the local white dwarf space density.
Neglect of the thick disc was also responsible for a gross overestimate by ?) of the Galactic white dwarf mass. These authors aimed at classifying halo white dwarfs, but their sample contained a large fraction of thick disc white dwarfs. Extrapolation of their local numbers to the vast volume of the Galactic halo resulted in a very large estimate of the mass. The study presented here suggests a different interpretation with a more modest contribution of white dwarfs.
Open questions remain. Two scenarios were proposed to explain local white dwarfs with kinematical properties of the Galactic halo as thin disc stars, which were accelerated to high velocities after the companion exploded in a supernova type II (?) or in a single-degenerate supernova type Ia (?). Could this be true for the kinematically identified thick disc and halo white dwarfs in the SPY sample? The thin disc scenarios make two predictions: 1) the high-velocity white dwarfs should be single and 2) the masses should be similar to typical masses of thin disc white dwarfs. Although SPY is a radial velocity survey for binary white dwarfs, the first check can not be applied to the ?) sample, because suspected binary white dwarfs were intentionally excluded from the analysis. However, white dwarf masses are known from model atmosphere analysis of the SPY spectra (?, ?). Since star formation in the thick disc and halo ceased more than 10 Gyr ago, young white dwarfs of these populations have low mass progenitors and are thus expected to have low masses. Thick disc and halo candidates from the ?) sample have average masses of and , respectively, well below the SPY average of (?). Thus there is little sign for a thin disc contamination of this sample. We are in the process of starting a deep photometric survey, which will trace the white dwarf populations to large distances from the Galactic plane and will allow direct measurements of space densities and scale heights.
The author gratefully acknowledges support by a PPARC/STFC Advanced Fellowship.
References
References
- [1]
- [2] [] Alcock C, Allsman R A, Alves D R, et al. 2000 ApJ 542, 281–307.
- [3]
- [4] [] Baugh C M, Lacey C G, Frenk C S, Granato G L, Silva L, Bressan A, Benson A J & Cole S 2005 MNRAS 356, 1191–1200.
- [5]
- [6] [] Blöcker T 1995 A&A 299, 755–769.
- [7]
- [8] [] Chabrier G, Baraffe I, Allard F & Hauschildt P 2000 ApJ 542, 464–472.
- [9]
- [10] [] Davies M B, King A & Ritter H 2002 MNRAS 333, 463–468.
- [11]
- [12] [] Dobbie P D, Napiwotzki R, Burleigh M R, Barstow M A, Boyce D D, Casewell S L, Jameson R F, Hubeny I & Fontaine G 2006 MNRAS 369, 383–389.
- [13]
- [14] [] Fontaine G, Brassard P & Bergeron P 2001 PASP 113, 409–435.
- [15]
- [16] [] Girardi L, Bressan A, Bertelli G & Chiosi C 2000 A&AS 141, 371–383.
- [17]
- [18] [] Hansen B M S 2003 ApJ 582, 915–918.
- [19]
- [20] [] Holberg J B, Oswalt T D & Sion E M 2002 ApJ 571, 512–518.
- [21]
- [22] [] Holberg J B, Sion E M, Oswalt T, McCook G P, Foran S & Subasavage J P 2008 AJ 135, 1225–1238.
- [23]
- [24] [] Koester D, Napiwotzki R, Christlieb N, et al. 2001 A&A 378, 556–568.
- [25]
- [26] [] Napiwotzki R, Christlieb N, Drechsel H, et al. 2001 Astronomische Nachrichten 322, 411–418.
- [27]
- [28] [] Napiwotzki R, Christlieb N, Drechsel H, et al. 2003 The Messenger 112, 25–30.
- [29]
- [30] [] Odenkirchen M & Brosche P 1992 Astron. Nachrichten 313, 69–81.
- [31]
- [32] [] Oppenheimer B R, Hambly N C, Digby A P, Hodgkin S T & Saumon D 2001 Science 292, 698–702.
- [33]
- [34] [] Pauli E M, Napiwotzki R, Altmann M, Heber U, Odenkirchen M & Kerber F 2003 A&A 400, 877–890.
- [35]
- [36] [] Pauli E M, Napiwotzki R, Heber U, Altmann M & Odenkirchen M 2006 A&A 447, 173–184.
- [37]
- [38] [] Reid I N, Sahu K C & Hawley S L 2001 ApJ 559, 942–947.
- [39]
- [40] [] Robin A C, Reylé C, Derrière S & Picaud S 2003 A&A 409, 523–540.
- [41]
- [42] [] Schröder K P, Pauli E M & Napiwotzki R 2004 MNRAS 354, 727–736.
- [43]
- [44] [] Torres S, Camacho J, Isern J & García-Berro E 2008 A&A 486, 427–435.
- [45]
- [46] [] Voss B & Koester D 2005 in D Koester & S Moehler, eds, ‘14th European Workshop on White Dwarfs’ Vol. 334 of Astronomical Society of the Pacific Conference Series pp. 655–658.
- [47]
- [48] [] Weidemann V 2000 A&A 363, 647–656.
- [49]