near- and mid-infrared spectroscopy of APM 08279+5255 at †
Abstract
We present rest-frame optical/near-infrared spectra of the gravitationally lensed quasar APM 08279+5255 at that has been taken using the Infrared Camera (IRC) onboard the infrared satellite. The observed continuum consists of two components; a power-law component dominating optical wavelengths which is the direct light from the central source and thermal emission dominating near-infrared wavelengths which is attributed to the emission from hot dust in the circumnuclear region. The thermal emission well represents optically thick emission by hot dust at K with and apparent mass, . Thus, our observations directly detected the optically thick region of hot dust in APM 08279+5255. HI recombination lines of H(0.656µm), Pa(1.875µm), and Pa(1.282µm) are clearly detected at 3.2, 6.3, and 9.3 µm. Simulations with the photoionization models suggest that APM 08279+5255 has BLR(Broad Line Region) clouds characterized by for the gas density, for the ionization parameter, and for the broad line region. Thus, optically thick emission of hot dust support an idea on non-spherical distribution of dust near the central source, consistent with the Active Galactic Nuclei model with the dust torus. The temperature of hot dust and flux ratios of these HI lines are similar to those observed in low-redshift quasars. There are significant time-variations in the HI lines, which are probably caused by variations in the brightness of the central source.
1 Introduction
High-redshift quasars provide direct probes of the distant early universe where galaxies and quasars formed. Over the past decade, many high-redshift quasars have been found in large-area surveys such as the Sloan Digital Sky Survey (York et al., 2000) and Two Degree Field (2dF) QSO Redshift Survey (Boyle et al., 2000). Nonetheless, no convincing evidences for evolution in quasar spectra have been found, which is in remarked contrast to spectra of galaxies. For example, the flux ratio Fe II/Mg II in quasars is expected to be small at high-redshift because the Fe-enrichment is delayed relative to the -element enrichment (i.e. Yoshii et al., 1998). However, Fe II/Mg II does not change from low-redshift to high-redshift (Wills et al., 1985; Tsuzuki et al., 2006; Kawara et al., 1996; Iwamuro et al., 2004; Kurk et al., 2007; Barth et al., 2003). Other UV emission lines such as N V and C IV show no evidence for evolution either (Dietrich et al., 2003; Nagao et al., 2006).
Dust locating at the circumnuclear region is heated by the central engine, and produce near-infrared radiation. Such hot dust is common in Active Galactic Nuclei (AGNs) and quasars at low redshift and also observed in high-redshift quasars (Oyabu et al., 2001; Hines et al., 2006; Jiang et al., 2006). Dust at high redshift is presumably produced as a result of supernova explosions, while dust production would be dominated by mass-loss of late-type stars at low-redshift. If so, hot dust at high-redshift would be different from that at low-redshift. Unfortunately, hot dust in the high-redshift has been mostly studied based on broad-band photometry (Oyabu et al., 2001; Hines et al., 2006; Jiang et al., 2006), and no systematic evolution has been reported. Spectroscopic studies would provide new insight into evolution and origin of hot dust in the circumnuclear region of quasars.
, which was launched in 2006 February, is the first Japanese satellite dedicated to infrared observations (Murakami et al., 2007). It has a 68.5 cm diameter telescope LHe-cooled to 5.4 K. In addition to its major mission that is to perform all-sky survey at six bands in the mid- and far-infrared, has carried out pointed observations for deep surveys of selected area and systematic observations of important objects.
We have performed the near- and mid-infrared spectroscopy of the quasar APM 08279+5255 at using Infrared Camera (IRC: Onaka et al., 2007) onboard . These observations were obtained as part of Open Time program “IRC NIR Spectroscopy of High-Redshift Quasars”.
APM 08279+5255 was discovered during a survey for high Galactic latitude carbon stars (Irwin et al., 1998). The IR flux densities at 25, 60, and 100 µmare 0.23, 0.51, and 0.95 Jy, respectively, in the Faint Source Catalog (Moshir et al., 1992). This is apparently one of the most luminous objects with at (Downes et al., 1999). The ground-based imagery observations in the optical (Ibata et al., 1999) and near- and mid-infrared (Egami et al., 2000), revealed that APM 08279+5255 is gravitationally lensed with a magnification of . Using the Infrared Spectrograph on the Spitzer Space Telescope, Soifer et al. (2004) detected broad Pa and Pa HI recombination lines as well as a strong, red continuum in the rest-frame wavelength range 1-7µm.
Throughout this paper, , and are assumed for cosmology parameters.
2 Observation and Data Reduction
Spectroscopy was performed on APM 08279+5255 using the IRC (Onaka et al., 2007; Ohyama et al., 2007) onboard the satellite (Murakami et al., 2007) on 2006 October and 2007 April. The observations are summarized in Table 1.
We used two IRC’s channels, NIR and MIR-S. Each covers different wavelengths from the near-infrared to mid-infrared. The NIR channel uses a 512 412 InSb array, whereas the MIR-S employs a 256 256 Si:As array. The NIR and MIR-S channels share the same field of views and observe simultaneously.
The Astronomical Observational Template 04 (AOT04) designed for spectroscopy was used. AOT04 replaces the imaging filters by transmission-type dispersers on the filter wheels to take near- and mid-infrared spectra. For 2006 October observations, the NIR Prism (NP) was set to cover the wavelength of 1.8-5.5µm with a spectral resolving power of 19 at 3.5µm. The target was put on the center of the detector array without a slit. In the MIR-S channel, two grisms, SG1(4.6-9.2µm;R53) and SG2(7.2-13.4µm;R50), were set and slitless spectroscopy was made. For 2007 April observations, the NIR grism (NG) was set to cover the wavelength of 2.5 - 5µm with the resolution R . The 1′ 1′ slit was used to avoid the confusion of spectra.
The data were processed through the IRC-dedicated data reduction package, IRC_SPECRED Ver. 20080528 (Ohyama et al., 2007). First, dark subtraction, linearity correction, flat correction, and various image anomaly corrections were performed. Multiple exposures were then coadded. After performing wavelength- and flux-scaling, the spectra of the object was extracted. Apertures for the spectrum extraction were 5 pixels, namely, (NP, SG1, SG2, NG) = (7.5″, 12.5″, 12.5″, 7.5″). Aperture correction was also performed at the end.
We found large uncertainties associated with the SG1 and SG2 calibration at µm and µm, respectively. This was caused by the second order light affecting the response curves of both grisms. Thus, in this work, we only use the wavelength at µm and µm for the SG1 and SG2 spectra, respectively.
| Obs. Date | Pointing ID | Channel/Disperser | Wavelength | Resolving power | Extraction aperture |
|---|---|---|---|---|---|
| (UT) | (µm) | ||||
| 2006-10-19 | 3120025.001 | NIR/NP | 1.8-5.5 | 19 at 3.5µm | 7.5″ |
| MIR-S/SG1 | 4.6-9.2 | 53 at 6.6µm | 12.5″ | ||
| MIR-S/SG2 | 7.2-13.4 | 50 at 10.6µm | 12.5″ | ||
| 2007-04-16 | 3120050.001 | NIR/NG | 2.5-5.0 | 120 at 3.6µm | 7.5″ |
3 Results
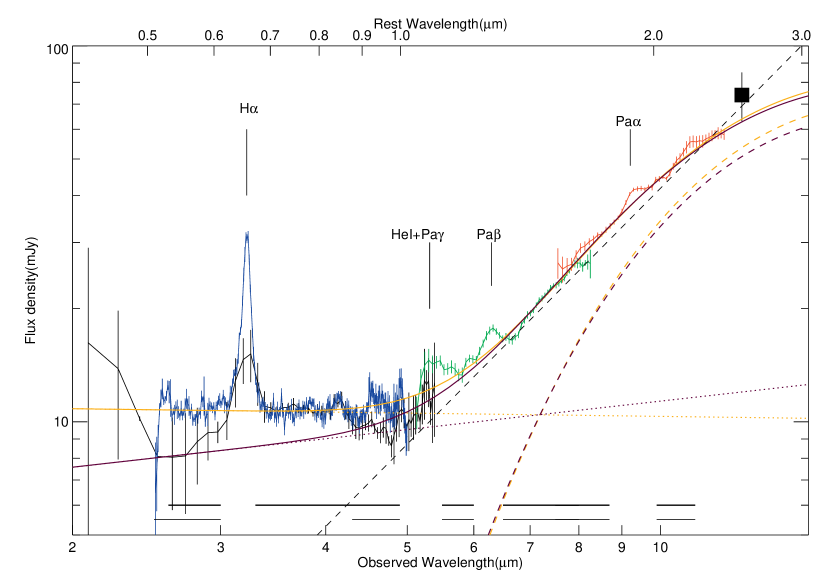
Figure 1 shows the spectra of APM 08279+5255 in the NP, NG, SG1 and SG2 bands. The continuum and emission lines are clearly detected at 2 - 13µm.
The continuum shows two components; one is a flat power-law at µm, whereas the other is a power-law or bump sharply rising beyond µm, where denotes rest-frame wavelengths. Assuming the models consisting of two power-law components, the best fit to the data is for µm and for µm. The overall continuum level and the power-law slope for is consistent with observations of IRS spectroscopy (Soifer et al., 2004).
HI recombination lines of H(0.656µm), Pa(1.875µm), and Pa(1.282µm) are clearly detected at 3.21, 6.3, and 9.3 µm. The HeI (1.083µm) line and HI Pa(1.094µm) line are blended and seen as a bump at 5.4µm111 Models consisting of two lines poorly fit to the data; the OI 11287µm emission line might contribute to the bump.. The line fluxes are measured, as illustrated in Figure 2, by fitting a linear function to the local continuum data on either side of the line profile, and then fitting a Gaussian function to the linear-function-subtracted spectrum. The results including line fluxes and FWHMs are summarized in Table 2. At the bottom of this table, the data obtained by the (Soifer et al., 2004) are given to facilitate the comparison. The strengths of Pa and Pa are significantly greater than those obtained with by a factor of 1.5 - 2. This will be discussed later.
This is the first H detection in APM 08279+5255. The H fluxes in APM 08279+5255 are 60-100 times brighter than that in RX J1759.4+6638, a quasar at similar redshift, (Oyabu et al., 2007). However, the line flux of H is similar between them, consistent with the lens magnification of 100.
While the continuum fluxes observed on two occasions in a six-month interval are consistent with each other, the H fluxes varied at a 2.3 level from the first occasion to the other. The H flux measured with NP on the first occasion is , while the second measurement with NG gives . Although the different dispersers were used, we believe that this variation is real¿ In fact, as compared in Table 2, the Pa and Pa strengths observed with differ by a factor of 1.5 - 2 from those observed with AKARI three year later. On the other hand, no significant variations in continuum have been observed between and observations. This will be discussed again in Section 4.3.


| Channel/ | Line | Obs. Wavelength | Redshift | FWHM | Obs. Flux | Obs. EW⋆⋆The observed equivalent width (EW) of emission lines. |
|---|---|---|---|---|---|---|
| Disperser | (m) | (km s-1) | () | (m) | ||
| Observation on 2006-10-19 | ||||||
| NIR/NP | H 0.656µm | 3.21 0.04 | 3.90 0.06 | 313 84 | 0.107 0.029 | |
| MIR-S/SG1 | Pa 1.282µm | 6.28 0.03 | 3.90 0.02 | 42 6 | 0.036 0.005 | |
| MIR-S/SG2 | Pa 1.875µm | 9.30 0.05 | 3.96 0.02 | 57 6 | 0.043 0.005 | |
| Observation on 2007-04-16 | ||||||
| NIR/NG | H 0.656µm | 3.22 0.01 | 3.91 0.02 | 7721 | 509 7 | 0.159 0.002 |
| IRS Observation on 2003-11-23 (Soifer et al., 2004) | ||||||
| Pa 1.282µm | 6.3150.013 | 3.9250.006 | 9500 | 81 16 | 0.061 | |
| Pa 1.875µm | 9.2350.011 | 3.9140.011 | 8770 | 85 11 | 0.059 | |
4 Discussion
4.1 Hot dust in a z=3.9 quasar
The spectral energy distribution (SED) of quasars can be modelled with two components, big blue and infrared bumps (Sanders et al., 1989; Elvis et al., 1994). A big blue bump has been considered to be direct light from the central engine, while the infrared bump is attributed to thermal emission by dust which absorbs UV/optical light and re-emit it in the infrared. The sharp rise from µm toward the peak of the infrared bump is especially attributed to hot dust surrounding the central source. We assumed that the observed spectra only consist of a power-law emission and a single-temperature blackbody, representing the big blue bump and the infrared bump, respectively. These models are defined as:
| (1) |
where is a power-law index, is the Planck function with dust temperature , and is the dust optical depth. For the frequency dependence of the dust optical depth we adopt the result of Weingartner & Draine (2001).
The parameters, and are derived by fitting to the observed continuum. Near-infrared part of the spectrum was taken with NP and NG, resulting in two sets of the spectra, namely, NP-SG1-SG2 and NG-SG1-SG2. Fits to these two spectra resulted in the allowable temperature in 1 error, , with for NP and with for NG. In the both case, the dust optical depths were just determined to be the lower limit, , which means that the hot dust emission of APM 08279+5255 is optically thick at a rest wavelength . Our observations directly detected the optically thick region of hot dust in the quasar. These fits were made to the continua after removing significant emission features from the observed spectra. If the broad deep dip at 2.5µm of the NP spectrum is real continuum, as an extreme case to check the dependency of the dust temperature on the power-law index, and are obtained. Thus, the dust temperature is 1280 .
Temperatures of this quasar suggest that graphite and silicate grains can survive as the hot dust component in this quasar because sublimation temperatures for graphite and silicate grains are and , respectively (Salpeter, 1977; Huffman, 1977). We interpret the existence of such hot dust whose temperature is close to sublimation temperatures of dust as the innermost dust component heated by the strong radiation of the AGN central engine. The dust closer to the central engine has higher temperatures but cannot survive inside any critical radius at which it begins to sublimate.
As we fit the hot dust emission using a single-temperature blackbody of 1300 K in Figure 1, the luminosity of the hot dust is calculated at , where is the magnification factor of the gravitational lensing. If it is assumed the blackbody emission is due to heated dust grains, a measurement of the size of emitting region can be determined from the relationship,
| (2) |
Here is the observed flux density, is the magnification factor, is the optical depth, is the angular diameter distance and is the radius of the emitting region. On the condition of K and optical thickness, , as derived above, the radius of emitting region is . The size of the emitting region is small enough to magnify the flux of hot dust times (Egami et al., 2000).
To measure the dust mass, , which emit in the near-infrared, we used the following equation,
| (3) |
where is the mass absorption coefficient according to Weingartner & Draine (2001). Now our fitting result is the optically thick condition, , and thus we can obtain the lower limit of the dust mass, using 2µm flux in the rest frame. We emphasize that the hot dust mass is much less than from warm dust with and from cold one with in Weiß et al. (2007), in which the continuum fluxes measured in the centimeter and millimeter are fit with the 2-component dust model and their masses are calculated.
As studies of hot dust in low-redshift quasars, Kobayashi et al. (1993) observed low-resolution near-infrared spectra of 14 quasars with redshift and reproduced their continua from 0.95 to 2.5µm with a combination of two radiation components; the power-law and blackbody of 147090K. There is also a recent work that Glikman et al. (2006) constructed the composite spectrum from 0.58 to 3.5µm from near-infrared observations of 27 quasars with the redshift of . Their composite spectrum is fitted with a spectral slope of -0.92 and a blackbody temperature of 1260K. The dust temperature of APM 08279+5255 does not show a big difference from those of low-redshift quasars.
4.2 Hydrogen recombination lines
Our is in APM 08279+5255, which agrees with observed by Soifer et al. (2004). Landt et al. (2008) reported of for 16 low-redshift quasars. It should be noted that of was obtained from a composite spectrum of low-redshift quasars (Glikman et al., 2006). In any case, observed in quasars is significantly smaller than 2.0 predicted from Case B recombination (Osterbrock, 1989), suggesting HI recombination lines come from BLR clouds where the gas density is very high.
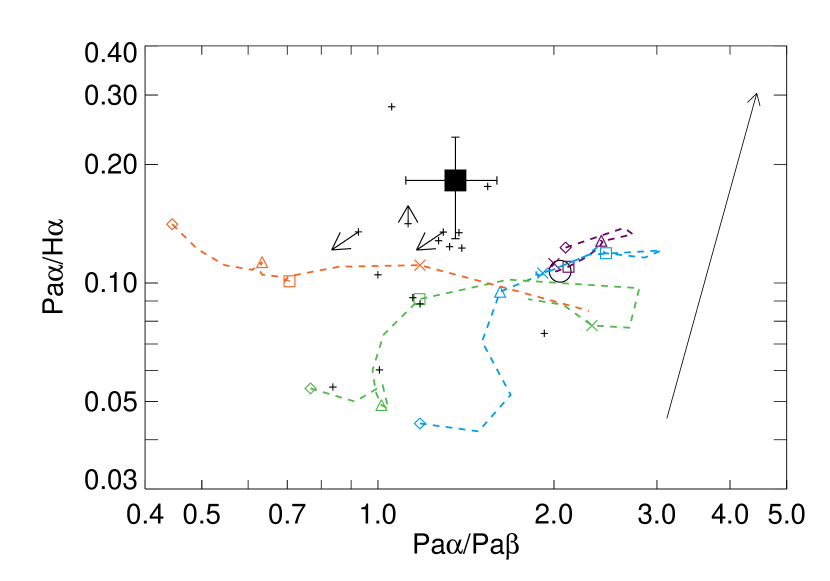
Figure 3 plots versus of APM 08279+5255 along with low-redshift quasars(Landt et al., 2008). The APM 08279+5255 data used in this Figure were taken in 2006 October when the three lines were observed simultaneously. Photoionization codes Cloudy(version 06.02 by Ferland et al. (1998))was used to probe BLR clouds. Our models for BLR clouds and the incident continuum from the central sources are the same as as those used in Tsuzuki et al. (2006) and Matsuoka et al. (2007, 2008). The incident continuum is defined as:
| (4) |
where and is the high-energy and low-energy cut-off temperature, respectively. The low-energy cutoff temperature has little effect on the spectral result, thus a temperature is preset for the UV bump cutoff in the infrared. The UV and X-ray continuum components are combined using a UV to X-ray logarithmic spectra slope . We adopted a parameter set of . The gas was modeled to have a constant hydrogen density and exposed to the ionizing continuum radiation expressed with an ionization parameter U. We performed the calculation with the sets in a range of and stepped by 0.5 dex.
As can see in Figure 3, none of quasars agree with Case B recombination, regardless of intrinsic reddening to BLR clouds. The APM 08279+5255 data are reasonably represented with a parameter set of and with . Though optically thick region of hot dust surrounds the BLR, the intrinsic extinction in the BLR is moderate. This supports an idea of non-spherical distribution of hot dust near the central source, which is consistent with the AGN model with the dust torus (Antonucci & Miller, 1985).
4.3 Variability of HI recombination lines
As discussed in Section 3, the line fluxes of Pa and Pa have decreased by a factor of 1.5 - 2 in three years. In addition, the H flux also varied in six months. On the other hand, our continuum level of dust emission in µm was kept constant over these periods. This means that the brightness in the BLR varied while that in thermal emission from hot dust was constant.
The variability of the broad lines and the constancy of the dust continuum can be explained in terms of the source size of the BLR and the hot-dust emitting regions. For example, the size of the BLR of NGC 4151 is a few to 10 light days (i.e. Clavel et al., 1990; Maoz et al., 1991; Kaspi et al., 1996), while the inner boundary of the dusty torus extends to 48 light days from the central source (Minezaki et al., 2004). In the central source, the gas in the accretion disk, which is falling to the supermassive black hole, radiates the continuum from the high-energy to the optical. Part of this continuum is absorbed in BLR clouds and thus ionized gas produces line emission such as HI recombination lines.
The incident continuum is also absorbed by dust which mainly exist at a distance greater than BLR clouds from the center. When the brightness of the incident continuum varies, BLR lines vary in a time-delay of days or months and the thermal emission in the near- and mid-infrared radiation also varies after the time-delay of months or years. Thus, the variation in the near- and mid-infrared radiation is smeared out more than that in recombination lines in BLR gas, making more difficult to detect variations in emission from hot dust than recombination lines.
It is unlikely that the variation in the HI recombination lines is attributed to microlensing events which have been observed lensed quasars (Burud et al., 2000, 2002; Hjorth et al., 2002; Jakobsson et al., 2005). The lensing galaxy of APM 08279+5255 has not been found. If the lensing galaxy is at , the Einstein radius of a star with in the lensing galaxy is , or at . This is much smaller than the size of hot dust which emits in the infrared, . Therefore, the microlensing event of a star in the lensing galaxy is unable to magnify infrared emission, while it is able to magnify fluxes coming from smaller regions like BLR clouds or an accretion disk. However, assuming the star in the lensing galaxy having a velocity of , the timescale of is longer than that of our detection of the variability (Chiba et al., 2005). Therefore, it might be difficult to explain that the variability is caused by microlensing.
5 Summary
This paper presents near- and mid-infrared spectra of a gravitationally lensed quasar APM 08279+5255 at with AKARI/IRC. The observations were performed with the IRC onboard the infrared satellite. We have detected the continuum from 2µm to 13µm in the observed frame, corresponding to 0.5µm to 2.4µm in the rest-frame, and hydrogen emission lines of H, Pa and Pa and probably HeI emission line. The major conclusions are as follows.
-
1.
The thermal emission of hot dust heated by the central engine of this quasar is measured by the spectral fitting with the simple model expressed with a power-law and a blackbody. The thermal emission represents optically thick emission by hot dust at with and mass, . The temperature is consistent with those of low-redshift quasars which were also measured spectroscopically(Kobayashi et al., 1993; Glikman et al., 2006).
-
2.
The flux ratios of Hydrogen emission lines, H, Pa and Pa, can not be explained with the simple Case B recombination model, but they are consistent with those of low-redshift sample (Landt et al., 2008). Compared with the photoionization model, the physical condition of BLR in this quasar have a parameter set of and with . The moderate extinction in the BLR and optically thick emission of hot dust support an idea of non-spherical distribution of dust near the central source, consistent with the AGN model with the dust torus.
-
3.
The difference between and measurements in Pa and Pa emission lines could be explained by the variability of this quasar. The variability of the H emission line was also detected with multiple observations with in a span of six months. There are two possibilities of variability for this quasars: the intrinsic variability of this quasar itself and the microlensing caused by a star in a lensing galaxy. Considering the timescale of microlensing, it might be ruled out for an explanation of the variability.
Our spectroscopic observations revealed that APM 08279+5255 at show a lack of evolution in the BLR and the hot dust component. This suggests that these components in this quasar have reached maturity very early on. This conclusion is probably applicable to most of quasars because the studies of broad emission lines in high-redshift quasars show the lack of the evolution (i.e. Iwamuro et al., 2004) and the infrared photometric studies (Hines et al., 2006; Jiang et al., 2006) of quasars in do not differ significantly from those in low-redshift.
References
- Antonucci & Miller (1985) Antonucci, R. R. J., & Miller, J. S. 1985, ApJ, 297, 621
- Barth et al. (2003) Barth, A. J., Martini, P., Nelson, C. H., & Ho, L. C. 2003, ApJ, 594, L95
- Boyle et al. (2000) Boyle, B. J., Shanks, T., Croom, S. M., Smith, R. J., Miller, L., Loaring, N., & Heymans, C. 2000, MNRAS, 317, 1014
- Burud et al. (2000) Burud, I., et al. 2000, ApJ, 544, 117
- Burud et al. (2002) Burud, I., et al. 2002, A&A, 391, 481
- Chiba et al. (2005) Chiba, M., Minezaki, T., Kashikawa, N., Kataza, H., & Inoue, K. T. 2005, ApJ, 627, 53
- Clavel et al. (1990) Clavel, J., et al. 1990, MNRAS, 246, 668
- Dietrich et al. (2003) Dietrich, M., Hamann, F., Shields, J. C., Constantin, A., Heidt, J., Jäger, K., Vestergaard, M., & Wagner, S. J. 2003, ApJ, 589, 722
- Downes et al. (1999) Downes, D., Neri, R., Wiklind, T., Wilner, D.J., & Shaver, P.A., 1999, ApJ, 513, L1
- Egami et al. (2000) Egami, E., Neugebauer, G., Soifer, B. T., Matthews, K., Ressler, M., Becklin, E. E., Murphy, T. W., & Dale, D. A. 2000, ApJ, 535, 561
- Elvis et al. (1994) Elvis, M., et al. 1994, ApJS, 95, 1
- Ferland et al. (1998) Ferland, G. J., Korista, K. T., Verner, D. A., Ferguson, J. W., Kingdon, J. B., & Verner, E. M. 1998, PASP, 110, 761
- Glikman et al. (2006) Glikman, E., Helfand, D. J., & White, R. L. 2006, ApJ, 640, 579
- Nagao et al. (2006) Nagao, T., Marconi, A., & Maiolino, R. 2006, A&A, 447, 157
- Hines et al. (2006) Hines, D. C., Krause, O., Rieke, G. H., Fan, X., Blaylock, M., & Neugebauer, G. 2006, ApJ, 641, L85
- Hjorth et al. (2002) Hjorth, J., et al. 2002, ApJ, 572, L11
- Huffman (1977) Huffman, D. R. 1977, Advances in Physics, 26, 129
- Ibata et al. (1999) Ibata, R. A., Lewis, G. F., Irwin, M. J., Lehár, J., & Totten, E. J. 1999, AJ, 118, 1922
- Irwin et al. (1998) Irwin, M.J., Ibata, R.A., Lewis, G.F., & Totten, E.J. 1998, ApJ, 505, 529
- Iwamuro et al. (2004) Iwamuro, F., Kimura, M., Eto, S., Maihara, T., Motohara, K., Yoshii, Y., & Doi, M. 2004, ApJ, 614, 69
- Jakobsson et al. (2005) Jakobsson, P., Hjorth, J., Burud, I., Letawe, G., Lidman, C., & Courbin, F. 2005, A&A, 431, 103
- Jiang et al. (2006) Jiang, L., et al. 2006, AJ, 132, 2127
- Kaspi et al. (1996) Kaspi, S., et al. 1996, ApJ, 470, 336
- Kawara et al. (1996) Kawara, K., Murayama, T., Taniguchi, Y., & Arimoto, N. 1996, ApJ, 470, L85
- Kawada et al. (2007) Kawada, M., et al. 2007, PASJ, 59, 389
- Kobayashi et al. (1993) Kobayashi, Y., Sato, S., Yamashita, T, Shiba, H, and Takami, H. 1993, ApJ, 404, 94
- Kurk et al. (2007) Kurk, J. D., et al. 2007, ApJ, 669, 32
- Landt et al. (2008) Landt, H., Bentz, M. C., Ward, M. J., Elvis, M., Peterson, B. M., Korista, K. T., & Karovska, M. 2008, ApJS, 174, 282
- Maoz et al. (1991) Maoz, D., et al. 1991, ApJ, 367, 493
- Matsuoka et al. (2007) Matsuoka, Y., Oyabu, S., Tsuzuki, Y., & Kawara, K. 2007, ApJ, 663, 781
- Matsuoka et al. (2008) Matsuoka, Y., Kawara, K., & Oyabu, S. 2008, ApJ, 673, 62
- Minezaki et al. (2004) Minezaki, T., Yoshii, Y., Kobayashi, Y., Enya, K., Suganuma, M., Tomita, H., Aoki, T., & Peterson, B. A. 2004, ApJ, 600, L35
- Moshir et al. (1992) Moshir, M., Kopman, G., & Conrow, T. A. O. 1992, Pasadena: Infrared Processing and Analysis Center, California Institute of Technology, 1992, edited by Moshir, M.; Kopman, G.; Conrow, T. a.o.,
- Murakami et al. (2007) Murakami, H., et al. 2007, PASJ, 59, 369
- Ohyama et al. (2007) Ohyama, Y., et al. 2007, PASJ, 59, 411
- Onaka et al. (2007) Onaka, T., et al. 2007, PASJ, 59, 401
- Osterbrock (1989) Osterbrock, D. E., 1989, Astrophysics of Gaseous Nebulae and Active Galactic Nuclei (University Science Books)
- Oyabu et al. (2001) Oyabu, S., et al. 2001, A&A, 365, 409
- Oyabu et al. (2007) Oyabu, S., et al. 2007, PASJ, 59, 497
- Salpeter (1977) Salpeter, E. E. 1977, ARA&A, 15, 267
- Sanders et al. (1989) Sanders, D. B., Phinney, E. S., Neugebauer, G., Soifer, B. T., & Matthews, K. 1989, ApJ, 347, 29
- Soifer et al. (2004) Soifer, B.T., Charmandaris, V., Brandl, B.R. et al. 2004, ApJS, 154, 151
- Tsuzuki et al. (2006) Tsuzuki, Y., Kawara, K., Yoshii, Y., Oyabu, S., Tanabé, T., & Matsuoka, Y. 2006, ApJ, 650, 57
- Weiß et al. (2007) Weiß, A., Downes, D., Neri, R., Walter, F., Henkel, C., Wilner, D. J., Wagg, J., & Wiklind, T. 2007, A&A, 467, 955
- Weingartner & Draine (2001) Weingartner, J. C., & Draine, B. T. 2001, ApJ, 548, 296
- Wills et al. (1985) Wills, B. J., Netzer, H., & Wills, D. 1985, ApJ, 288, 94
- York et al. (2000) York, D. G., et al. 2000, AJ, 120, 1579
- Yoshii et al. (1998) Yoshii, Y., Tsujimoto, T., & Kawara, K. 1998, ApJ, 507, L113