Financial Atoms and Molecules
Abstract
Atoms and molecules are important conceptual entities we invented to understand the physical world around us. The key to their usefulness lies in the organization of nuclear and electronic degrees of freedom into a single dynamical variable whose time evolution we can better imagine. The use of such effective variables in place of the true microscopic variables is possible because of the separation between nuclear time scales (very fast), electronic time scales (fast), atomic time scales (slow), and molecular time scales (slower still). Where separation of time scales occurs, identification of analogous objects in complex systems — an example of which is the financial market — can help advance our understanding of their dynamics. To detect separated time scales and identify their associated effective degrees of freedom in financial markets, we devised a two-stage statistical clustering scheme to analyze the price movements of stocks in several equity markets. The price movements are first clustered at a short time scale, and thereafter, re-clustered based on separated correlation levels that become evident when these short-time correlations are examined over a longer time scale. Through this two-time-scale clustering analysis, we discovered a hierarchy of levels of self-organization in real financial markets, whereby lower level, rapidly-evolving dynamical structures are nested within higher level, slowly-evolving dynamical structures, which are themselves nested within even higher level, even more slowly-evolving dynamical structures. We call these self-organized dynamical structures (which are statistically robust) financial atoms, financial molecules, and financial supermolecules. While many financial atoms have compositions that on hindsight appear trivial or easy to guess, there are also those whose composition are genuine surprises. With larger and better-regulated markets, the component stocks of financial molecules and financial supermolecules all fall within a single market sector, or several very closely-related market sectors. In markets with extensive cross ownership, or dominated by huge multi-industry holding companies, financial molecules and financial supermolecules straddling many distant market sectors were found. In general, the detailed compositions of these dynamical structures cannot be deduced based on raw financial intuition alone, and must be explained in terms of the underlying portfolios, and investment strategies of market players. More interestingly, we find that major market events such as the Chinese Correction and the Subprime Crisis leave many tell-tale signs within the correlational structures of financial molecules.
pacs:
05.45.Tp, 87.23.Ge, 89.65.Gh, 89.75.FbI Introduction
Predicting the movement of prices in financial markets is an important problem, more so in the light of the global financial crisis we find ourselves in right now. If we have the means to detect market undercurrents that do not have clear signatures on the surface, we might be able to steer clear of trouble, and perhaps even defuse financial landmines before things get out of hand. However, there are at present no reliable schemes for short- or long-term predictions, despite the fact that past information on all financial instruments are wholly available Transactions . This stands in stark contrast to our ability to predict solar and lunar eclipses to very high precision, starting from Newton’s Laws of Motion, and much less voluminous initial data. We believe this is due to the fact that financial markets are complex systems, whose dynamics follow self-organizing principles we do not yet understand. Clearly, an important first step towards writing down any predictive models of financial market dynamics would be to identify the important degrees of freedom. A priori, we have no clue whether these are individual financial instruments, or specific collections of instruments. We hence look to the physical sciences for inspiration.
I.1 Statistical Learning in the Physical Sciences
In the physical sciences, we talk about atoms and molecules as if they are real entities. Quantum-mechanically, all atomic and molecular systems must be described by a single many-body wave function whose dynamics is governed by the Schrödinger equation . If we admit that the wave function furnishes a sufficient description of the problem, then atoms have no real existence inside a molecule, and molecules have no real existence within an interacting collection of molecules. Nevertheless, it is very useful to continue speaking of them, because they simplify our mental models of the processes that take place within the collection of nucleons and electrons. This is admissible, and in fact physically meaningful, because the dynamical structures that atoms and molecules participate in evolve over time scales significantly longer than the intrinsic time scales set by nuclear and electronic motion, i.e. there is a separation between nuclear/electronic time scales and atomic/molecular time scales.
To better illustrate how our association of certain collections of nuclear and electronic degrees of freedom with atoms, and other collections of nuclear and electronic degrees of freedom with molecules arise naturally from this separation of time scales, let us imagine a universe containing a single water molecule 1H216O, consisting of ten protons, eight neutrons, and ten electrons. Under ordinary conditions, the 16O nucleons and the two 1H protons are always very well separated spatially, so in principle we have no problem telling them apart. For the ten indistinguishable electrons, however, we cannot simply assign eight labeled electrons to 16O, and one labeled electron each to the two 1H. Nevertheless, if we make a movie of the time evolution of electronic densities within the water molecule, we will find an electronic distribution close to 16O nucleus that evolves pretty much independently of the electronic distributions between the 16O nucleus and 1H nuclei. We think of the former as the density of 16O core electrons, and the latter as the density of the bonding electrons. Unlike the 16O core electrons, the bonding electrons cannot be associated with either the 16O atom or the 1H atom alone. Instead, they must be associated with the two chemical bonds — another conceptual tool we invent to help us understand the nature of stable bound states between atomic species — in the water molecule.
Now let us imagine actually producing such a movie, through direct integration of the time-dependent Schrödinger equation for the water molecule. If we assume that the nucleons are static, we can solve this problem in the basis of all possible 10-electron configurations. Some of these configurations will contribute predominantly to the core density, while others will contribute predominantly to the bond density. Because of the nucleon-electron and electron-electron Coulomb interactions, the quantum-mechanical amplitudes of these configurations will evolve with time, sometimes rapidly, and sometimes slowly. As a result of these variable rates of time evolution, if we examine the configurations contributing predominantly to the 16O core electronic density, over a time interval that is on the order of the electronic time scale, we might find their amplitudes to be sometimes correlated, and sometimes uncorrelated. In fact, over electronic time scales, some core electronic amplitudes might even be more correlated with bonding electronic amplitudes than with other core electronic amplitudes. Nevertheless, based on our intuitive picture of distinguishable core and bonding electronic densities, and the separation of electronic and atomic/molecular time scales, we expect the long-run averages of core-core short-time correlations, as well as the long-run averages of bond-bond short-time correlations, to tend towards some nonzero values, while the long-run averages of core-bonding correlations tend towards zero.
I.2 Atoms and Molecules as Robust Dynamical Structures
The understanding that emerges from this dynamical picture is that core and bond amplitudes should not be treated as objects with immutable labels. Instead, they ought to be identified as clusters emerging from a statistical learning procedure, where we repeatedly calculate correlations at the electronic time scale (the short time scale), and examine how the patterns of short-time correlations look like over a much longer duration (the long time scale). Given a collection of unlabeled time-dependent amplitudes, we can always make use of this procedure of statistical clustering at two different (separated) time scales to discover the compound objects, things that we would go on to call atoms and molecules. More generally, if we are given a large number of time-dependent variables, determining how short-time correlations are themselves correlated over longer times would allow us to determine which sets of variables are strongly correlated over long time scales. These strongly-correlated set of variables then serve as good candidates for effective degrees of freedom at the long time scale.
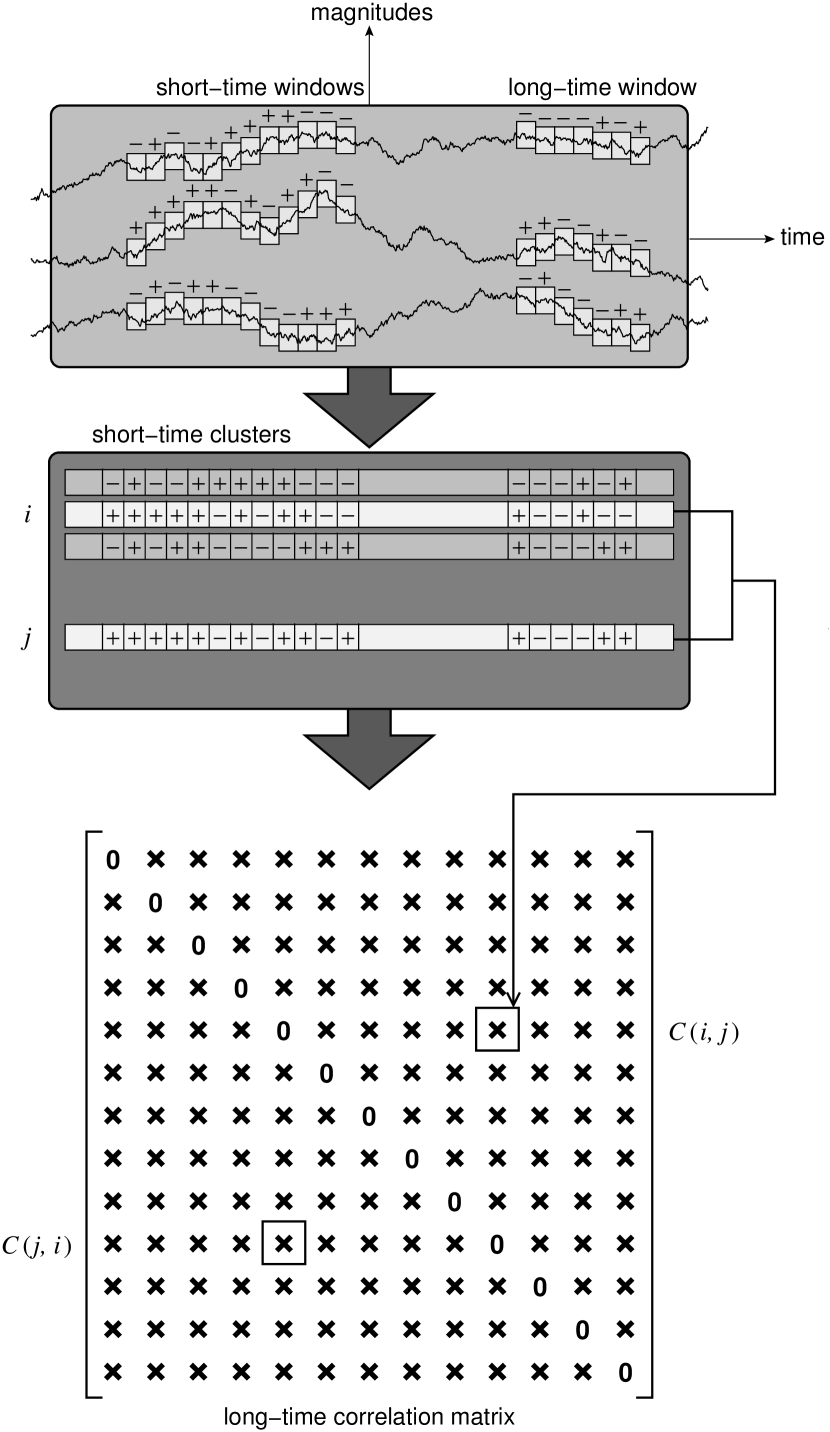
Ultimately, for dynamical features as robust as the core electronic densities and the bonding electronic densities, we expect their statistical signatures to be generally insensitive to specific choices of the short and long time scales, so long as the short time scale is comparable to electronic time scales, and the long time scale is comparable to the atomic/molecular time scale. In addition, it should not matter what short-time correlations we evaluate, and what long-time correlations of these we further determine. For some choices of short-time correlations, statistical signatures of the core and bond clusters of amplitudes might emerge fairly quickly during the long-time clustering. For other choices of short-time correlations, we might have to cluster over a longer time to detect these statistical signatures. Recast as a learning problem, the extraction of robust, and therefore physically meaningful, dynamical features boils down to a simple problem of statistics and statistical significance. The simplest scheme that implements the two-time-scale statistical clustering procedure outlined above is based on the sign of the rate of change, as shown in Figure 1. In this scheme, two scalar variables and are correlated over a short-time window if they are both increasing or decreasing. Otherwise, the two variables are considered to be uncorrelated. Over the long time scale, we define their long-time correlation to be the number of times they are correlated with each other at short time scales. These pairwise correlations can be organized into a long-time correlation matrix , which is the starting point for our identification of strongly-correlated compound objects.
II Data and Results
Armed with this understanding, we analyzed five financial markets, the New York Stock Exchange (NYSE), the London Stock Exchange (LSE), the Tokyo Stock Exchange (TSE), the Hong Kong Stock Exchange (HKSE), and the Singapore Stock Exchange (SGX) over a two-year period from January 2006 to December 2007 (see Table 1). These markets are chosen specifically for contrast: the NYSE, LSE, and TSE are mature markets in G7 countries, whereas the HKSE and SGX are emerging markets. Presumably, the dynamics in emerging markets should be different from that in mature markets, and thus one might naively expect structurally different self-organizations in these two classes of markets. To keep the datasets manageable, we restricted our analysis to only stocks and stock related securities. Since stocks are important components in any financial market, we believe their dynamics alone would offer us valuable insights into the inner workings of the financial world.
| NYSE | LSE | TSE | HKSE | SGX | |
| Total number of stocks | 67431 | 88202 | 26362 | 10703 | 5461 |
| Total number of market sectors | 103 | 105 | 395 | 124 | 126 |
| 1Thomson Datastream, http://www.datastream.com/. | |||||
| 2Taqtic, SIRCA, https://taqtic.sirca.org.au/TaqTic/. | |||||
| 3http://finance.yahoo.com/ Renfree . | |||||
| 4Hong Kong Stock Exchange, | |||||
| http://www.hkex.com.hk/invest/index.asp? | |||||
| id=company/profilemenu_page_e.asp. | |||||
| 5Reuters. | |||||
| 6SGX - Singapore Exchange Ltd, | |||||
| http://info.sgx.com/webstocks.nsf/revamp+new+all+ | |||||
| stocks+sector?OpenView. | |||||
II.1 Financial Atoms and Atomic Correlation Levels
For each financial market, we looked at the daily price movements of the stocks making up the market. Here, , and is the price of stock on day . For this choice of data frequency, we have effectively selected a short time scale of one day. Our long time scale, chosen to ensure statistical significance Significance , is the two-year observation period, consisting of 500+ short time windows. It is useful to keep in mind that for all financial markets, there is a microscopic time scale set by the average trading interval, which can be anywhere between s to s. Following the two-time-scale clustering procedure outlined above, we assign stocks and to the same short-time cluster at time , if and are of the same sign. A stock whose price does not change from day to day , i.e. , is left unassigned. In the long-time correlation matrix that emerges from this procedure, we find a background correlation level reflecting market-level drifts, experienced by all stock prices, that results from rallies and crashes. This background correlation level varies from market to market. In general, the larger is, the more liquid the market.
To get a rough sense of the dynamical structures having long-time correlations over and above market-level drifts, we zero matrix elements in below a threshold . As is raised, we go from a dense matrix, telling us that each stock is correlated with a large number of stocks (though not equally strongly), to a sparse matrix, telling us that each stock is correlated only with very few other stocks (but very strongly so). Just as surfaces of high constant electronic density frequently reveal the atomic constituents of a molecule, very large matrix elements in reveal the atomic constituents of the given financial market. We call these small clusters of very strongly correlated stocks financial atoms. The correlation levels within financial atoms rise significantly above the background level , because the dynamics of atomic stocks are coherent over time scales much longer than the average trading interval, which plays the role of the ‘nuclear/electronic’ time scale. The existence of such financial atoms is evident from earlier studies Mantegna1999EurPhysJB11p193 ; Bonanno2001QuantFin1p96 ; Onnela2002EurPhysJB30p285 ; Onnela2003PhysicaScriptaT106p48 ; Onnela2003PhysRevE68e056110 ; Bonanno2004EurPhysJB38p363 ; Onnela2004EurPhysJB38p353 ; Coronello2005ActaPhysPolB36p2653 ; Hawkesby2005SSRN724062 ; Jung2005ProcSPIE5848 ; Kim2005PhysRevE72e046133 ; Jung2006PhysicaA361p263 ; Coelho2007PhysicaA373p615 ; Coronello2007ProcSPIE66010T ; Heimo2007PhysicaA383p147 ; Pan2007PhysRevE76e046116 ; Sinha2007EconophysMarketsBusNet ; Zovko2007ProcComplexity , where they are referred to as synchronized clusters. However, the separation of ‘nuclear/electronic’ and atomic time scales was not recognized. The potential of using financial atoms as effective variables to describe real financial markets is also not widely appreciated.
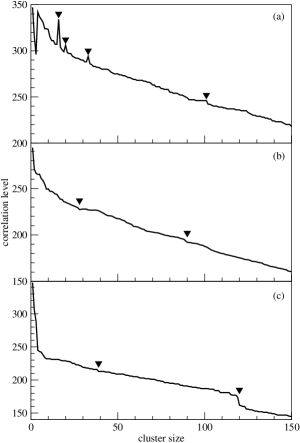
To properly identify these financial atoms in a given market, we need to be careful: just as core electronic densities are different for different atoms, we suspect the correlation levels may also be different for different financial atoms. This suggests the need for multiple thresholds, instead of a single threshold , if we use agglomerative hierarchical clustering to discover the financial atoms. In order for the association between clusters in the hierarchical clustering tree and atomic/molecular components in the financial market to be statistically robust, we require the clusters to be insensitive to variations in the individual thresholds. To accomplish this, one can imagine a sophisticated algorithm starting out with a large number of thresholds, which are progressively merged as they are slowly raised, based on how sensitive the clusters are to these thresholds. Such an algorithm, however, is difficult to implement, and thus we adopt a simpler approach, where we start from a seed cluster, i.e. a core set of two very-strongly-correlated stocks, and grow the hierarchical cluster outwards. We call this procedure partial hierarchical clustering, and the sequence of correlation levels at which new members are admitted into the growing cluster its partial hierarchical clustering history. Figure 2 shows the typical partial hierarchical clustering histories obtained using different linkage algorithms. With all linkage algorithms, the statistical signature to look out for is a sharp change in slope of the correlation level as a function of cluster size. This can take the form of sharp spikes, sharp drops, or simply kinks. These statistical signatures have different interpretations for the different linkage algorithms. We pick the complete link algorithm for our analysis proper, because the sharp drops and kinks in the correlation level can be most naturally interpreted as cluster boundaries. Compared to the statistical signatures used by most existing statistical learning algorithms Focardi2004QuantFin4p417 ; Gafichuk2004PhysicaA341p547 ; Idicula2004SSRN634681 ; Aste2005ProcSPIE ; Doherty2005ProcICSC ; Micciche2005ProcISSSP ; Tumminello2005PNAS102p10421 ; Allefeld2007PhysRevE76e066207 ; Rummel2007EuroPhysLett80e68004 ; Tumminello2007EurPhysLett78e30006 ; Heimo2008PhysicaA387p5930 ; Innocenti2008JPhysAMathTheor41e205101 ; Rummel2008PhysRevE77e016708 ; Tumminello2008socph08094165 ; Ma2008SIAMRev50p413 ; Alonson2006ComputStatistDataAnal51p762 ; FruthwirthSchnatter2008JBusinessEconStats26p78 ; Bauwens2007EconRev26p365 ; Corduas2008ComputStatistDataAnal52p1860 ; Juarez2006CRiSM ; Kullmann2000PhysicaA287p412 , we believe ours is more intuitive.
Since the total number of financial atoms in a given market is not known, we discover them iteratively as follows. First, let us use to denote our long-time correlation matrix, and find the maximum matrix element, . Using as our first seed cluster for complete-link partial hierarchical clustering, we look for the sharpest change in the slope of the correlation level as a function of cluster size, which marks the ‘boundary’ of the first candidate financial atom (see Figure 3). To find the second financial atom, we zero the rows and columns of , so that the partial hierarchical clustering can proceed independently of constituents of the first candidate financial atom. We call this modified correlation matrix . Again, we find , and use as our second seed cluster for complete-link partial hierarchical clustering. From the sharpest change in the slope of the correlation level, we identify the second candidate financial atom , and proceed to zero the rows and columns of to get . This iterative procedure mimics a full hierarchical clustering having different thresholds, which we can use to find as many candidate financial atoms as we like.
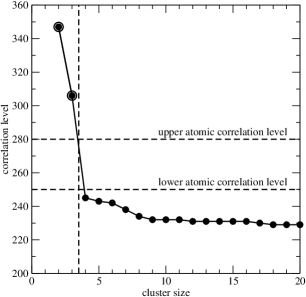
For a candidate to qualify as a true financial atom, the constituent atomic stocks must be more strongly correlated with each other than they are with stocks outside of the financial atom. This ‘self-consistency’ criterion defines an upper atomic correlation level, and if we are to adhere to this ‘self-consistency’ criterion strictly, only clusters of stocks with maximum long-time correlation rising above the upper atomic correlation level can be considered to have dynamically self-organized into strong financial atoms. This criterion is somewhat restrictive, so we looked for an alternative criterion compatible with the self-organization observed. Inspecting the various partial hierarchical clustering histories of the most strongly-correlated seed clusters, we find the correlation levels at which the first non-atomic stock was admitted into the growing clusters to be tightly clustered around a small number of lower atomic correlation levels. We can therefore define weak financial atoms to be those candidate financial atoms whose maximum correlations are greater than the average of the lower atomic correlation levels. In Table 2, we show the upper atom correlation level, the average lower atomic correlation level, and the number of financial atoms based on the two criterions, in each of the five financial markets. The compositions of strong financial atoms found in the five equity markets are shown in Appendix A.
| NYSE | LSE | TSE | HKSE | SGX | |
|---|---|---|---|---|---|
| Upper atomic correlation level | 420 | 370 | 380 | 340 | 280 |
| Number of strong financial atoms | 30 | 12 | 14 | 7 | 6 |
| Lower atomic correlation level | 379 | 355 | 348 | 306 | 262 |
| Number of financial atoms | 108 | 22 | 52 | 16 | 11 |
| Molecular correlation level | 349 | 310 | 320 | 269 | 211 |
In all markets, we find small financial atoms comprising on the order of 10 stocks. In all markets except for the TSE, we find trivial financial atoms consisting of different stocks issued by the same company, e.g. VIA.A and VIA.B (both offered by Viacom) in the NYSE, SDR and SDRt (both offered by Schroders plc) in the LSE, 0019 and 0087 (both offered by Swire Pacific) in the HKSE, and Singtel, Singtel 10, and Singtel 100 (all offered by Singtel) in the SGX. In the NYSE, LSE and TSE, the constituent stocks of nearly all strong financial atoms fall cleanly into the respective market sectors. In the LSE, the exception is financial atom 12, which consists of mostly insurance stocks (Aviva, Prudential, Legal and General Group, Friends Provident), but also contain one bank stock (Standard Chartered), and one investment trust stock (Foreign & Colonial Investment Trust). In the TSE, the exception is financial atom 9, which consists of real estate stocks (Tokyo Tatemono Co, Urban, Creed Co, Pacific Holding Inc), apart from Kenedix Inc, which is classified as belonging to the Services market sector. However, Kenedix Inc’s four business segments are all related to the real estate market.
In the HKSE and SGX, on the other hand, we find a significant proportion of strong financial atoms having constituents that straddle several market sectors (financial atoms 1 and 2 in the HKSE, and financial atoms 4 and 6 in the SGX). The emergence of these strong cross-sector correlations can only be explained by the underlying shareholder profiles, and confluential business interests. For example, in the HKSE financial atom 1, 40.23% of the stake in Cheung Kong is held by Hong Kong business tycoon Li Ka-Shing OSIRIS . Cheung Kong, in turn, owns 49.97% of Hutchison Whampoa’s shares. Similarly, the Hong Kong and Shanghai Banking Corporation (HSBC) owns 62.14% of the shares of the Hang Seng Bank, and holds a 42.01% net stake in Sun Hung Kai Properties. These two pairs of stocks have little in common in terms of ownership, and the main reason they are so strongly-correlated is probably Cheung Kong and Hutchison Whampoa buying over HSBC and Hang Seng’s stakes in the e-commerce setup iBusiness on July 27, 2007 CKHJul2007 . The HKSE financial atom 1 also contains the MTR Corp, a statutory corporation owned by the Hong Kong Government, and China Mobile, a state-owned enterprise of the People’s Republic of China. The exact reasons for these two to be strongly correlated with Cheung Kong-Hutchison Whampoa and Hang Seng-Sun Hung Kai Properties are unclear (HSBC has a 0.15% stake in MTR Corp, but this is surely too little to account for the observed correlations). We believe these strong correlations may be related to the perceived competition between China Mobile and Hutchison Whampoa, which has a telecommunications arm, the announcement on April 13, 2006 that the MTR Corp signed an agreement with the Beijing municipal government to build and operate a new Beijing rail line APApr2006 , or the announcement on Nov 28, 2007 that Cheung Kong won a HK$7 billion MTR property project ReutersNov2007 .
Another interesting observation that we would like to highlight, is the finding of more than one strong financial atom for some market sectors in the LSE and TSE. In contrast, we find at most one strong financial atom per market sector in the NYSE. In the LSE, we find a total of four strong financial atoms belonging to the Investment Trusts market sector, whereas in the TSE, we find two strong financial atoms each in the Real Estate, Banks, and Non-Ferrous Metals market sectors. Looking at the example of the LSE financial atoms 4 (Scottish Investment Trust and Witan Investment Trust) and 5 (Monks Investment Trust and Scottish Mortgage Investment Trust), we find that Scottish Investment Trust and Witan Investment Trust have in common ownership by the French holding company AXA, which holds 11.30% and 16.00% stakes in the two investment trusts respectively OSIRIS . The shareholders they have in common also include the Legal and General Gp (4.10% and 4.59% respectively) and Lloyds TSB Gp (2.99% and 0.26% respectively). In contrast, AXA is missing from the lists of larger shareholders for Monks Investment Trust and Scottish Mortgage Investment Trust, which feature instead Barclays (5.99% and 3.61% respectively), as well as Legal and General Gp (3.80% and 3.60% respectively). For the example of the TSE financial atoms 5 and 8, while the ownership makeups tell interesting stories, we believe the main reason for their dynamics to be decoupled is TSE financial atom 5 being made up entirely of large regional banks, with operating revenue less than US$1 billion, while TSE financial atom 8 consists of even larger diversified banks, with operating revenue significantly larger than US$1 billion.
Finally, we note that strong foreign financial atoms are detected in the NYSE and LSE, reflecting their more globalized character, but not in the other three markets. In the LSE, the only strong foreign financial atom (atom 11) consists of two Korean stocks issued by Samsung Electronics. In the NYSE, on the other hand, there are a total of 10 strong foreign financial atoms (the American Depository Receipts (ADR) atoms). In general, foreign financial atoms are smaller compared to the typical local financial atoms. Many of them are also part of strong financial atoms in their home markets. We shall also see later, while LSE atom 11 is weakly correlated with the rest of LSE, that the dynamics of some of the NYSE ADR atoms are strongly coupled to that of many US atoms in the NYSE.
II.2 Financial Molecules and Molecular Correlation Level
From Figure 2, we see statistical signatures indicating the presence of higher level self-organization in real financial markets. We refer to self-organized structures one level higher than financial atoms as financial molecules. Just as molecules are made up of atoms, we expect financial molecules to also be composed of financial atoms. Again, we intuitively expect financial atoms in the same financial molecule to be more strongly correlated with each other, compared to financial atoms in different financial molecules. To find these entities, we perform complete-link partial hierarchical clustering of the full correlation matrix — so that all financial atoms will be considered — starting from a given financial atom. We then examine the partial hierarchical clustering history, and look out for sharp changes in the slope of the correlation level as a function of cluster size (see Figure 4). These occur whenever a financial atom from a different financial molecule is added to the growing cluster by the partial hierarchical clustering procedure. Going over the partial hierarchical clustering histories of all strong financial atoms, we find the correlation levels at which the first non-molecular atom was admitted into the growing clusters to be tightly clustered around a small number of molecular correlation levels. To illustrate the separation of atomic and molecular correlation levels that result from the separation atomic and molecular time scales, we show the average molecular correlation level in Table 2, for easy comparison against the atomic correlation levels.
Using sharp changes in the slope of the correlation level-cluster size plots as natural markers for molecular boundaries, we can determine the collections of stocks making up various financial molecules in a given market. A molecular collection of stocks so identified represents part or whole of a financial molecule. In general, we need to examine several such molecular fragments to deduce the complete microscopic makeup of the financial molecule. However, we find this stock-level composition of the financial molecule less useful than its atom-level composition. If one or more stocks from a financial atom is found in any molecular fragment of a financial molecule, we say that the financial atom is a constituent atom of the financial molecule. We call the list of constituent atoms, and their pattern of correlations, the molecular structure of a given financial molecule. Within this atomic caricature of the financial molecule, the molecular fragments are groups of constituent atoms that are more strongly correlated with each other than they are with other constituent atoms. As we shall illustrate below using the SGX financial molecule as example, the molecular fragments that we obtained starting from different constituent atoms, plus and minus some non-atomic stocks, are consistent with the overall correlational structure of the financial molecule. This tells us that financial molecules are robust self-organized features in the dynamics of real financial markets.
Within a financial molecule, all constituent atoms are correlated with each other, but more strongly with some, and less strongly with others. To produce an intuitive picture of the correlational structure within the financial molecule, we draw bonds between financial atoms that are strongly correlated. There is no unique way to do this, but we find the following rules producing rather informative diagrams:
-
1.
area of a financial atom is proportional to the number of stocks it contains;
-
2.
solid circle for strong financial atoms, and dashed circle for weak financial atoms;
-
3.
select a upper correlation level and lower correlation level based on the intra-molecular correlations C1C2 , and draw:
-
(a)
a thick bond between two constituent atoms if their maximum and minimum interatomic correlation exceeds and respectively;
-
(b)
a thin bond between two constituent atoms if their maximum interatomic correlation exceeds , but their minimum interatomic correlation is below ;
-
(c)
a dashed bond between two constituent atoms if their maximum interatomic correlation is between and ;
-
(d)
no bond between two constituent atoms if their maximum interatomic correlation is below ;
-
(a)
-
4.
if a constituent atom is bonded to other constituent atoms by solid as well as dashed bonds, remove the dashed bonds;
-
5.
shade a constituent atom light gray, if its correlations with non-atomic components exceed .
II.2.1 Financial Molecules in the SGX and HKSE
| Code | Name | Market Sector |
| Atom 7 | ||
| BR9 | China Hongxing Sports | Manufacturing |
| P39 | Pine Agritech | Manufacturing |
| Atom 8 | ||
| F83 | Cosco Corp (Singapore) | TSC |
| N03 | Neptune Orient Lines | TSC |
| A04 | ASL Marine Holdings | Manufacturing |
| S68 | Singapore Exchange | Finance |
| 5GJ | AusGroup | Manufacturing |
| 5EE | Aqua-Terra Supply Co | Services |
| F12 | Fibrechem Technologies | Manufacturing |
| R07 | Rotary Engineering | Construction |
| U14 | UOL Gp | Property |
| T03 | Tat Hong Holdings | Commerce |
| Non-atomic Stocks | ||
| A61 | AsiaPharm Group | Manufacturing |
| B20 | Biosensors International Gp | Manufacturing |
| D79 | C&G Industrial Holdings | Manufacturing |
| C47 | China Aviation Oil (Singapore) Corp | Commerce |
| G86 | China Milk Products Gp | Commerce |
| E94 | Lizhong Wheel Gp | Manufacturing |
| 5EN | Midas Holdings | Manufacturing |
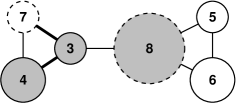
In the SGX, we find only one financial molecule, whose composition depends on the level of statistical significance we desire. When we look at the partial hierarchical clustering histories starting from the strong financial atoms 3, 4, or 5, we find two natural molecular boundaries (see bottommost panel in Figure 4). Depending on the starting financial atom, the statistically less significant first boundary suggests different lists of constituent atoms: (3, 4, 5, 6, 7, 8) when we start from strong financial atoms 3 and 5, and (3, 4, 7, 8) when we start from strong financial atom 4. From the partial hierarchical clustering history of strong financial atom 6, we identify only one natural molecular boundary, and list of constituent atoms suggested by this sole molecular boundary is (5, 6). Based on these observations, we conclude that the partial hierarchical clustering procedure finds different parts of the financial molecule if we start from different constituent atoms. These different parts, however, are consistent with the molecular structure of the six-atom financial molecule shown in Figure 5, which we deduce by taking the union of the different lists of constituent atoms, and drawing bonds based on the rules listed above. Different starting constituent atoms also give us different lists of constituent non-atomic stocks. Again, we take the union of these lists, and find that the constituent non-atomic stocks are most strongly correlated with the financial atoms 3, 4, and 8. Because their strong sub-atomic correlations with multiple financial atoms, we can interpret these constituent non-atomic stocks as ‘bonding’ stocks.
| Code | Name | Market Sector |
| Atom 9 | ||
| L28 | Longcheer Holdings | Services |
| L46 | Luzhou Bio-chem Technology | Manufacturing |
| Atom 10 | ||
| F20 | Federal International (2000) | Commerce |
| T06 | Tiong Woon Corp Holdings | TSC |
| Atom 11 | ||
| A17U | Ascendas Real Estate Investment Trust | Property |
| C61U | CapitaCommercial Trust | Property |
| C38U | CapitaMall Trust Management | Property |
| P27 | Parkway Holdings | Services |
| Additional Non-atomic Stocks | ||
| CEGL | China Essence Gp | Manufacturing |
| E13 | Ellipsiz | Services |
| 5DN | Ezra Holdings | TSC |
| H80 | Hongwei Technologies | Manufacturing |
| O10 | Orchard Parade Holdings | Property |
| P11 | Pacific Andes (Holdings) | Manufacturing |
| S63 | Singapore Technologies Engineering | Manufacturing |
| Y34 | Sunshine Holdings | Property |
| 5FG | Swissco International | TSC |
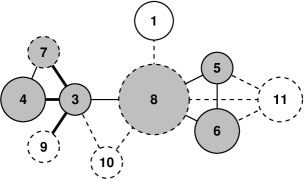
In Figure 5, we see that this six-atom financial molecule consists of two three-atom clusters, (3, 4, 7) and (5, 6, 8), connected by a single bond between atoms 3 and 8. Inspection of atomic compositions tells us that the property atom 5, banking atom 6, and shipping atom 8 consist mostly of local companies, whereas the manufacturing atoms 3, 4 and 7 consist only of Chinese companies listed on the SGX or China-related local companies. Most of the non-atomic stocks are also stocks of Chinese or China-related companies. The larger 10-atom financial molecule shown in Figure 6, suggested by the statistically more significant second boundaries in the partial hierarchical clustering histories of financial atoms 3, 4, and 5, tells an even more intricate story. Apart from the nested six-atom molecular core shown in Figure 5, we find also the participation of financial atoms 1, 9, 10, and 11. In this larger financial molecule, we find the same basic topology: a cluster of China related atoms , and a cluster of local atoms . Apart from the direct bonding between financial atoms 3 and 8, the two clusters are also bonded indirectly through the weak bonds between atoms 3 and 8 with the TSC atom 10. We believe it is likely that in 2005 or 2006, the two clusters might actually represent two distinct financial molecules, which became increasingly correlated with each other in the period leading up to, and beyond, the end-Feb 2007 market crash known as the Chinese Correction.
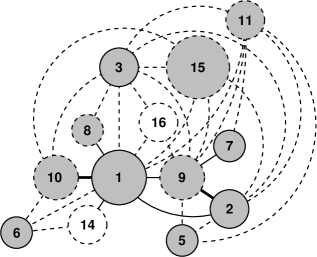
In the HKSE, we find also a single 13-atom financial molecule shown in Figure 7. Its molecular structure is considerably more complex than the SGX financial molecule, but we can still make out two molecular cores, and , as well as a group of bridging atoms. Inspection of the atomic compositions within the first molecular core, we realized that are all local atoms, whose constituent stocks are issued by companies based in Hong Kong. Apart from financial atom 14, which is a banking and finance atom, the rest are all property atoms. The second molecular core , on the other hand, contains only Chinese atoms, whose constituent stocks are issued by companies based in China. Unlike the local molecular core, atoms from the Chinese molecular core are from a variety of industries, ranging from banking and finance (2, 9), to oil and energy (7), to mining and metals (5). In the bridging group of financial atoms, we find a mix between local and Chinese atoms, primarily from the property market (3, 15, 16) and mining industry (11). In addition to indirect bonding of the two molecular cores through the bridging group of atoms, we also find strong direct bonds between the local atom 1 and Chinese atoms 2 and 9. The non-atomic stocks are also of mixed local and Chinese origins, representing a mixture of industries. These are strongly correlated with nearly every constituent atom, and can most appropriately be interpreted as a ‘valence cloud’ of the financial molecule. Unlike the situation in the SGX, many Hong Kong companies have direct business involvements in China, so it is perhaps not surprising to find strong correlations between the local and Chinese molecular cores. However, we believe that prior to 2006, atoms within the two molecular cores probably constitute several distinct financial molecules, whose movements become increasingly intertwined over 2006, culminating in the Chinese Correction of Feb 2007. We also believe that the industry cross section reflected in the HKSE financial molecule will provide important clues to understanding the Chinese Correction.
| Code | Name | Market Sector |
| Atom 64 | ||
| GS | Goldman Sachs Gp Inc | Financial |
| LBI | Lehman Brothers Inc | Financial |
| MER | Merrill Lynch & Co Inc | Financial |
| RJF | Raymond James Financial Inc | Financial |
| Non-Atomic Stocks | ||
| MHO | M/I Homes Inc | Homebuilding |
| NVR | NVR Inc | Homebuilding |
| MHK | Mohawk Industries Inc | Home Furnishing |
| DY | Dycom Industries Inc | Heavy Construction |
II.2.2 Financial Molecules in the NYSE, LSE and TSE
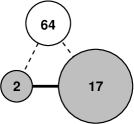
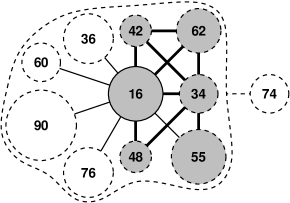
For the larger markets, we find more financial molecules, with a variety of sizes and compositions. One of the smallest financial molecule we find in the NYSE consists of the atoms (shown in Figure 8). This financial molecule is interesting because the strong financial atoms 2 and 17 are both in the homebuilding market sector, whereas component stocks in the weak financial atom 64 are in the Investment Services and Investment Trusts industries. Seeing that most component stocks in atom 64 got into trouble in 2008, this correlational structure is perhaps a tell-tale sign of the Subprime Crisis. Looking for further signatures of the Subprime Crisis, we found the large 11-atom financial molecule shown in Figure 9. This financial molecule contains almost exclusively real estate and property related atoms, except for atom 36, which is a mutual funds atom consisting mostly of Cohen & Steers funds. Based on the inter-atomic correlations, as well as correlations between the constituent atoms and constituent non-atomic stocks, we find in this financial molecule a molecular core consisting of the office, retail, residential and industrial real estate investment trust (REIT) atoms 16, 34, 42, 48, 55, and 62. This strongly-correlated molecular core is surrounded by a inner shell of four atoms (36, 60, 76, 90), bonded directly to atom 16, and an outer shell consisting of atom 74, which is weakly bonded to every atom in the financial molecule. We see here that the mutual funds atom 36 is strongly correlated with the molecular core through atom 16, but not with the remaining four shell REIT atoms. Inspecting their atomic compositions, we also see that the four shell REIT atoms are all rather specialized, either in the realty needs of the healthcare, hospitality or outlet mall sectors.
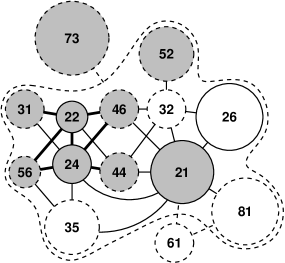
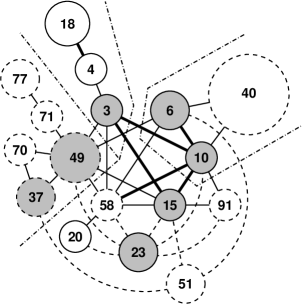
Another large financial molecule we found in the NYSE is the 14-atom oil and gas molecule shown in Figure 10. All atoms in this molecule contain local stocks, and all except one are in the closely related oil and gas (21, 26, 32, 81), drilling and exploration (22, 31, 46, 73), equipment and services (24, 44, 52, 56, 73), refining and marketing (35, 81) industries. The exception is atom 61, which is a coal atom. The topology of this molecule suggests a drilling & exploration and equipment & services molecular core, with very strong internal correlations, coupled strongly to a oil & gas molecular core, with strong internal correlations. Carefully analyzing the correlations this local oil & gas molecule have with other financial atoms in the NYSE, we find that it is strongly correlated with the 17-atom ADR molecule shown in Figure 11. This ADR molecule consists of three distinct molecular cores. The first is a foreign oil & gas molecular core comprising the ADR atoms 3, 4, and 18. Of these three, the European oil & gas atoms 4 and 18 are the most strongly correlated with each other. The second is a mining molecular core, which consists of the foreign mining atoms 6 and 10, and the US mining atom 40. The third molecular core consists of atoms associated with funds for and banks in emerging markets. In particular, the linear subcore (49, 71, 77) are all fund atoms, while the cyclic subcore consists of Indian (37) and Korean (70) bank atoms. It is through the foreign oil & gas molecular core, and also partially through the mining molecular core, that we find the strongest correlations between the ADR molecule and the US oil & gas molecule. The remainder of the ADR molecule has a rather complex composition, with 15 and 51 being European bank atoms, and 20 (beer), 23 (telecommunications), 58 (steel), 91 (energy) being Brazilian atoms. It is plausible that in the past, these five subclusters might represent five distinct financial molecules that somehow became increasingly correlated in the period leading up to the global financial crisis.
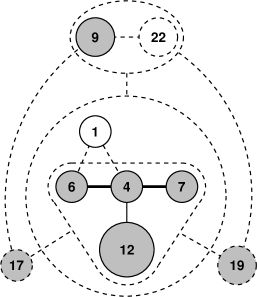
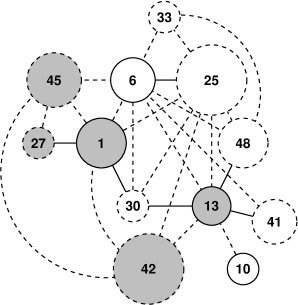
In the LSE and TSE, the financial molecules found are generally smaller than those found in the NYSE, and closer in size to the financial molecules found in the HKSE and SGX. For example, the LSE investment trusts financial molecule shown in Figure 12 comprises nine financial atoms, while the TSE heavy industry molecule shown in Figure 13 comprises 12 financial atoms. The structure of the LSE investment trusts molecule is relatively simple, with an inner core consisting of the investment trusts (1, 4, 6, 7) and insurance (12) atoms, and an outer shell consisting of the investment trusts atoms 9, 17, and 19. All non-atomic stocks are from the investment trusts and insurance industries, and the only surprising member of this molecule is the aerospace and defense atom 22. The TSE heavy industry molecule, on the other hand, has a significantly more complex structure, consisting apparently of two molecular cores, (6, 25, 33), and (1, 10, 13, 27, 30, 41, 48) as well as a group of bridging atoms (42, 45). Closer inspection, however, reveal a mismatch between the bonding structure and the industry distribution. In this TSE financial molecule, we find three major market sectors: steel, iron and metal mining (6, 10, 13, 25, 33, 41, 48), wholesale trade and distributing (1, 30), and heavy machineries (41, 42, 45). It is interesting that the (10, 13, 41, 48) group of metal mining atoms are more strongly correlated with the trading and distributing atom 30, than they are with the main steel and iron group of atoms (6, 25, 33). This is inspite of the fact that atom 48 consists of mostly steel production stocks. It is also surprising that the heavy machineries atom 27 is more strongly correlated with the wholesale trade atom 1 than it is with the other heavy machineries atoms, 41, 42, and 45. Based on the industry makeup of this financial molecule, it is not surprising to find that its non-atomic stocks are mostly from the steel and heavy machineries market sectors. However, we find it surprising that the non-atomic steel stocks are not strongly correlated with the steel and iron atoms 6, 25, and 33, but with the wholesale trade atom 1, the non-ferrous metal atom 13, and the heavy machineries atoms 27, 42, and 45.
While the molecular structures in the LSE and TSE hold some surprises, we find none of the extraordinary correlational structures seen in the NYSE, HKSE, and SGX, which we believe offer insights into such large-scale market events as the Chinese Correction and the Subprime Crisis. We believe that as a general rule, statistical signatures preceding a market crash can only be seen in the market(s) of origin. There should be little, or no symptoms at all, of such market crashes in the other markets that follow the market of origin into decline. However, because of strong coupling between global financial markets, we believe it might be possible to see statistical signatures of ‘aftershocks’ that play out simultaneously in all markets after the initial market crash.
II.3 Financial Supermolecules
In all markets, we find further self-organization at the level of hundreds of stocks. In markets where we find more than one financial molecule (NYSE, LSE, and TSE), these can be interpreted as bound states of financial molecules, and thus we call them financial supermolecules. From a finance point of view, the different market sectors in a developed economy are subjected to differing degrees of regulation, and as such, it is perhaps not surprising to find all stocks within the same market sector to be more correlated with each other, than with stocks from another market sector. This naturally suggests that the dynamics of an entire market sector self-organizes into a financial supermolecule Coronello2005ActaPhysPolB36p2653 ; Coronello2007ProcSPIE66010T ; Kim2005PhysRevE72e046133 ; Onnela2003PhysRevE68e056110 . From the top panel in Figure 14, we find three natural boundaries for a financial supermolecule in the NYSE, with the second boundary at cluster size of 176 stocks being the most significant statistically. If we analyze the composition of this financial supermolecule, starting from any of the natural boundaries, we find that this supermolecule is primarily the bound state between the US oil & gas molecule (shown in Figure 10) and the ADR molecule (shown in Figure 11). If we use the third boundary as our definition of the supermolecule, then we find it including other US atoms from the oil & gas (67, 105), steel (50, 95), emerging market funds (41, 45), industrial machinery (102), aerospace and defense (89), and construction materials (106) sectors. Most of these peripheral atoms are closely related to the US oil & gas molecule, or to the ADR molecule. From the middle panel in Figure 14, we find a single, statistically significant, natural boundary for a LSE supermolecule comprising nearly all the financial atoms in the market. This supermolecule is predominantly financials (atoms 1, 3, 4, 6, 7, 9, 12, 13, 14, 17, 19, many of which are components of the LSE investment trusts molecule shown in Figure 12) in character, and the excluded atoms — atom 2 (oil and gas), atom 11 (foreign consumer electronics), atom 15 (foreign oil and gas), and atom 21 (restaurants) — are all from market sectors distant from the finance sector.
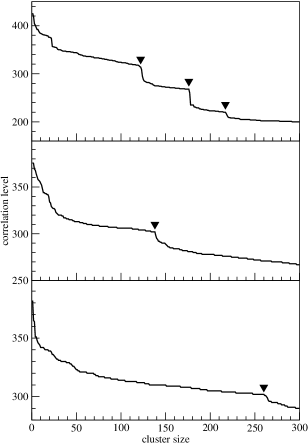
Of course, in the TSE, the financial molecules themselves do not respect sector boundaries, probably because of extensive cross-ownership practiced in this market Roehner2005PhysicaA347p613 . Therefore, the financial supermolecules do not represent any particular market sector, but represent instead some kind of ‘eigen’-trader, which is a collection of institutional and retail traders whose trading strategies are largely mutually reinforcing within the two-year time frame investigated. Different ‘eigen’-traders probably have different concentrations in their portfolio of stocks, and are therefore approximately ‘orthogonal’ in their impacts on the market. We suspect this ‘orthogonality’ of trading strategies lead to financial supermolecules being only weakly correlated, and thus an emergent supermolecular correlation level that is significantly lower than the molecular correlation levels. From the bottom panel in Figure 14, we find a natural boundary for a large financial supermolecule in the TSE. This supermolecule incorporates a large fraction of the 52 financial atoms found in the TSE, and the 11 financial atoms that are not incorporated are from the banks (5, 15, 34, 39, 47), insurance (2), other financing business (7), marine transportation (11, 22), utilities (24), and atom 20, which comprises the stocks issued by Toyota and Honda, Japan’s largest automobile makers. The exclusion of banks from this TSE supermolecule, however, is limited to regional banks, as atom 8, which comprises large diversified banks, is included in the supermolecule.
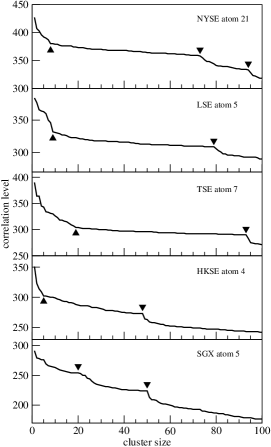
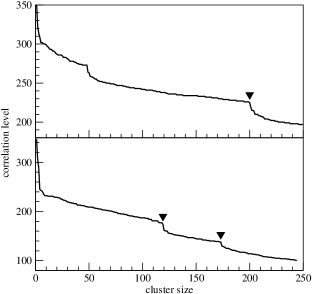
In small and less stringently regulated markets like the HKSE and SGX, where we find only a single financial molecule, market sector boundaries are again not statistically meaningful. For these small markets, we again find financial supermolecules consisting of over 100 stocks. These comprises the sole financial molecule, other financial atoms, and various more actively traded non-atomic stocks. The supermolecular correlation level is lower than for the large markets, and the separation of correlation levels is between actively-traded stocks and illiquid stocks. Again, this is the statistical signature left by the ‘eigen’-trader, which is the effectively the whole market in these small markets. From Figure 15, we find one natural boundary for the sole HKSE financial supermolecule, and two natural boundaries for the SGX financial supermolecule. All financial atoms in the HKSE and SGX are found to participate in the respective supermolecules. In fact, all financial atoms in the SGX are already found to included by the first natural boundary, and so the second natural boundary might indicate a further separation of correlation levels caused by different liquidity levels in the market.
III Summary and Discussions
In conclusion, we considered the phenomenon of separation of dynamical time scales, which arises generically as a result of self-organization in a complex system with a large number of interacting microscopic variables. We described how these separated time scales, and their associated dynamical structures, can be learned statistically, by examining short-time correlational statistics between the microscopic variables over a longer time, and identifying separated correlation levels at the long time scale. Arguing that only robust dynamical structures are physically meaningful, we explained why we need only look out for separated long-time correlation levels that are insensitive to details of the short-time and long-time statistics examined. After recasting the problem of finding a small number of effective variables (the self-organized dynamical structures) from a large number of interacting microscopic variables as a statistical learning problem, we moved on to describe our two-time-scale statistical clustering method. In this method, we would first cluster the time series of the microscopic variables on a short time scale. Thereafter, we would construct a structurally-simple long-time correlation matrix by counting the number of times pairs of microscopic variables are assigned to the same short-time clusters over the long time scale. We then developed the method of partial hierarchical clustering to automatically and systematically extract the separated correlation levels, and their associated collections of microscopic variables, from the long-time correlation matrix.
Using the two-time-scale statistical clustering method to analyze the five equity markets shown in Table 1 over the two-year period from 2006 to 2007, we found in all markets separated correlation levels that point to self-organization at several hierarchical levels. We call the separated correlation levels atomic, molecular, and supermolecular correlation levels, and the effective dynamical variables they are associated with financial atoms, financial molecules, and financial supermolecules. In all markets, financial atoms are found to consist of around 10 stocks, having internal correlations far above the background correlation level caused by market-level drifts. Some financial atoms are trivial, consisting of two or more stocks issued by the same company, while others have compositions expected of companies competing directly with each other within the same industry. Quite a number of financial atoms, however, consist surprisingly of stocks from very different industries. We find that these surprising atomic compositions can only be explained in terms of the ownership profiles and broader business conflicts and mutual interests of the constituent stocks. In the more globalized NYSE and LSE, we also find foreign atoms, which are part of financial atoms in their home markets.
In the smaller markets (HKSE and SGX), we find a single financial molecule made up of around 10 financial atoms. In the larger markets (NYSE, LSE, and TSE), we find many financial molecules, with sizes ranging from several to around 20 atoms. In the NYSE and LSE, financial molecules comprise atoms from a small number of closely related market sectors, whereas in the TSE, HKSE, and SGX, financial molecules do not respect market sector boundaries, sporting constituent atoms from distant sectors. We suspect that the former reflects the stringent market regulations in place in the NYSE and LSE, while the latter is a consequence of extensive cross-ownership in the TSE, and dominance by a small number of multi-industry holding companies in the HKSE and SGX. In the NYSE and LSE, market sector boundaries continue to be more or less respected by their financial supermolecules, and as such, market sectors can serve as high-level effective variables for understanding the dynamics in these markets. In contrast, the high-level effective variables in the TSE, HKSE, and SGX are multi-sector financial supermolecules associated with ‘eigen’ collections of institutional and retail traders with roughly ‘orthogonal’ market impacts. Close examinations of the correlational structures of the NYSE, HKSE, and SGX financial molecules reveal very interesting signatures of such large market events as the Subprime Crisis and the Chinese Correction. No extraordinary structures were seen in the LSE and TSE financial molecules. This led us to conclude that precursor signatures of large market events can only be detected in their markets of origin.
It is important to point out here that financial atoms and molecules are not merely curiosity items. The robust identification of financial atoms and molecules forms the first step in our program to understand real financial markets. Once the financial atoms and molecules are found, we will use them as effective variables to build effective dynamical models. Under normal market conditions, we will then apply understanding derived from this effective modeling to risk analysis and portfolio management. Portfolio optimization schemes based on the minimal spanning tree analysis of market correlations have been developed Onnela2003PhysRevE68e056110 ; Tola2008JEconDynControl32p235 , but we believe it is possible to bring the state of the art to a whole new level. For example, we believe current hedging strategies used by large fund managers must be revised, in line with the structures of financial atoms and molecules found in the respective markets. In particular, when designing a portfolio, it is important to observe that fluctuations in the price-weighted mean (the center of mass) of large financial molecules are suppressed relative to market-level fluctuations, because of the combined inertia of all their strongly-correlated constituent stocks. On the other hand, we need to be more careful investing in small financial molecules, because they are ‘lighter’, and are thus more susceptible to driving by market ‘forces’. More importantly, by making trading decisions at the financial molecule level, it is possible to unambiguously decompose the risk any given portfolio is exposed to, into a systematic risk component associated with the effectively deterministic dynamics of the financial molecules, and a stochastic risk component associated with random, unpredictable shocks experienced by the market on a whole. Our findings suggest that the systematic risk can be further reduced by taking into account the effective dynamics of the financial supermolecules.
Our analyses and findings have even more serious implications to understanding and coping with financial crises. As suggested by previous works Onnela2003PhysicaA324p247 ; Araujo2007QuantFin7p63 ; Bonanno2001PhysicaA299p16 ; Araujo2008PhysLettA372p429 , and also judging by the intriguing results seen in the NYSE, HKSE, and SGX, we believe a market becomes extremely susceptible to crashes when a significant fraction of stocks gets lock into a single financial supermolecule. If we can determine the critical size of such a market-spanning supermolecule, and also continuously track the sizes of growing supermolecules, we might be able to either forecast the onset of a financial crisis one or two months in advance, or perhaps even avert the crisis entirely. To this end, we are currently looking at the Chinese Correction on a shorter time scale. By tracking the dynamics of financial molecules in the SGX, and the evolution of their molecular structures from month to month over 2006 and 2007, we aim to develop a dynamical picture of bond formation prior to, and bond breaking after the market crash. We believe such a ‘chemical’ picture will offer important clues to understanding the end-February 2007 Chinese Correction, which probably catalyzed the Subprime Crisis that surfaced a few months later.
Acknowledgements.
This research is supported in part by the Nanyang Technological University startup grant SUG 19/07, and also by the Nanyang Technological University’s CN Yang Scholars Programme. We have had helpful discussions with Low Buen Sin, Charlie Charoenwong, Gerald Cheang Hock Lye, and Chris Kok Jun Liang.Appendix A Lists of Strong Financial Atoms
A.1 New York Stock Exchange
| Atom | Code | Name | Market Sector | Remarks |
|---|---|---|---|---|
| 1 | VIA | Viacom A | Services | |
| VIA.B | Viacom B | Services | ||
| 2 | LEN | Lennar A | Industrial Goods | Residential Construction |
| LEN.B | Lennar B | Industrial Goods | Residential Construction |
| Atom | Code | Name | Market Sector | Remarks |
| 3 | PBR | Petroleo Brasileiro SA | Basic Materials | ADR |
| PBR.A | Petroleo Brasileiro SA | Basic Materials | ADR | |
| 4 | RDS.A | Royal Dutch Shell A | Basic Materials | ADR |
| RDS.B | Royal Dutch Shell B | Basic Materials | ADR | |
| 5 | CBS | CBS | Services | |
| CBS.A | CBS | Services | ||
| 6 | BHP | BHP Billiton | Basic Materials | ADR |
| BBL | BHP Billiton | Basic Materials | ADR | |
| RTP | Rio Tinto plc | Basic Materials | ADR | |
| 7 | LAZ | Lazard | Financial | Asset Management |
| LDZ | Lazard 6.625% | Financial | Equity Security Units | |
| 8 | UN | Unilever NV | Consumer Goods | ADR |
| UL | Unilever plc | Consumer Goods | ADR | |
| 9 | CCL | Carnival Corp | Services | General Entertainment |
| CUK | Carnival plc | Services | ADR | |
| RCL | Royal Carribean Cruises | Services | General Entertainment | |
| 10 | RIO | Vale | Basic Materials | ADR |
| RIO- | Vale | Basic Materials | ADR | |
| 11 | FCE.A | Forest City Enterprises A | Financial | Property Management |
| FCE.B | Forest City Enterprises B | Financial | Property Management | |
| 12 | NWS | News Corp | Services | |
| NWS.A | News Corp A | Services | ||
| 13 | ETR | Entergy Corp | Utilities | Electric Utilities |
| ETR.PRA | Entergy Corp 7.625% | Utilities | Equity Security Units | |
| 14 | ENL | Reed Elsevier NV | Services | ADR |
| RUK | Reed Elsevier plc | Services | ADR | |
| 15 | BBD | Banco Bradesco SA | Financial | ADR |
| ITU | Banco Itau Hldg Financeira SA | Financial | ADR | |
| 16 | DDR | Developers Diversified Realty Corp | Financial | Retail REIT |
| REG | Regency Centers Corp | Financial | Retail REIT | |
| MAC | The Macerich Co | Financial | Retail REIT | |
| SPG | Simon Property Gp Inc | Financial | Retail REIT | |
| EQR | Equity Residential | Financial | Residential REIT | |
| GGP | General Growth Properties Inc | Financial | Retail REIT |
| Atom | Code | Name | Market Sector | Remarks |
| 17 | KBH | KB Home | Industrial Goods | Residential Construction |
| PHM | Pulte Homes Inc | Industrial Goods | Residential Construction | |
| CTX | Centex Corp | Industrial Goods | Residential Construction | |
| MDC | MDC Hldg Inc | Industrial Goods | Residential Construction | |
| TOL | Toll Brothers Inc | Industrial Goods | Residential Construction | |
| DHI | DR Horton Inc | Industrial Goods | Residential Construction | |
| RYL | The Ryland Gp Inc | Industrial Goods | Residential Construction | |
| HOV | Hovnanian Enterprises Inc | Industrial Goods | Residential Construction | |
| SPF | Standard Pacific Corp | Industrial Goods | Residential Construction | |
| MTH | Meritage Homes Corp | Industrial Goods | Residential Construction | |
| BHS | Brookfield Homes Corp | Industrial Goods | Residential Construction | |
| 18 | E | Eni SPA | Basic Materials | ADR |
| TOT | Total SA | Basic Materials | ADR | |
| BP | BP plc | Basic Materials | ADR | |
| REP | Repsol YPF SA | Basic Materials | ADR | |
| 19 | MET | MetLife Inc | Financial | Life Assurance |
| MetLife 6.375% | Financial | Equity Security Units | ||
| 20 | ABV | Companhia de Bebidas das Americas | Consumer Goods | ADR |
| ABV.C | Companhia de Bebidas das Americas | Consumer Goods | ADR | |
| 21 | CVX | Chevron Corp | Basic Materials | Integrated Oil & Gas |
| XOM | Exxon Mobile Corp | Basic Materials | Integrated Oil & Gas | |
| PEO | Petroleum & Resources Corp | Financial | Equity Closed-End Fund | |
| COP | ConocoPhillips | Basic Materials | Integrated Oil & Gas | |
| OXY | Occidental Petroleum Corp | Basic Materials | Independent Oil & Gas | |
| MRO | Marathon Oil Corp | Basic Materials | Oil & Gas Refining & Marketing | |
| 22 | ESV | Ensco Intl Inc | Basic Materials | Oil & Gas Drilling & Exploration |
| NE | Noble Corp | Basic Materials | Oil & Gas Drilling & Exploration | |
| PDE | Pride Intl Inc | Basic Materials | Oil & Gas Drilling & Exploration | |
| 23 | BRP | Brasil Telecom Participacoes SA | Technology | ADR |
| BTM | Brasil Telecom SA | Technology | ADR | |
| TBH | Brazilian Telecom HOLDRS | Technology | ADR | |
| 24 | SLB | Schlumberger | Basic Materials | Oil & Gas Equipment & Services |
| SII | Smith Intl Inc | Basic Materials | Oil & Gas Equipment & Services |
| Atom | Code | Name | Market Sector | Remarks |
| 25 | KV.A | KV Pharma A | Healthcare | Drug Delivery |
| KV.B | KV Pharma B | Healthcare | Drug Delivery | |
| 26 | CNQ | Canadian Natural Resources | Basic Materials | Independent Oil & Gas |
| SU | Suncor Energy Inc | Basic Materials | Independent Oil & Gas | |
| ECA | EnCana Corp | Basic Materials | Independent Oil & Gas | |
| TLM | Talisman Energy Inc | Basic Materials | Independent Oil & Gas | |
| SFY | Swift Energy Co | Basic Materials | Independent Oil & Gas | |
| CHK | Chesapeake Energy Corp | Basic Materials | Independent Oil & Gas | |
| NXY | Nexen Inc | Basic Materials | Independent Oil & Gas | |
| EOG | EOG Resources Inc | Basic Materials | Independent Oil & Gas | |
| PCZ | Petro-Canada | Basic Materials | Oil & Gas Refining & Marketing | |
| 27 | MIR | Mirant Corp | Utilities | |
| MIR.WSA | Mirant Corp | Utilities | ||
| MIR.WSB | Mirant Corp | Utilities | ||
| 28 | HEI | HEICO Corp | Industrial Goods | Aerospace & Defense |
| HEI.A | HEICO Corp | Industrial Goods | Aerospace & Defense | |
| 29 | BBI | Blockbuster Inc A | Services | |
| BBI.B | Blockbuster Inc B | Services | ||
| 30 | BNI | Burlington Northern Santa Fe Corp | Services | Railroads |
| UNP | Union Pacific Corp | Services | Railroads | |
| CSX | CSX Corp | Services | Railroads | |
| NSC | Norfolk Southern Corp | Services | Railroads |
A.2 London Stock Exchange
| Atom | Code | Name | Market Sector | Remarks |
| 1 | SDR | Schroders | Financials | Investment Services |
| SDRt | Schroders | Financials | Investment Services | |
| 2 | RDSa | Royal Dutch Shell | Energy | Integrated Oil & Gas |
| RDSb | Royal Dutch Shell | Energy | Integrated Oil & Gas | |
| 3 | HMSO | Hammerson | Financials | REIT |
| LII | Liberty Intl | Financials | REIT | |
| LAND | Land Securities Gp | Financials | REIT | |
| BXTN | Brixton | Financials | Real Estate Ops | |
| 4 | SCIN | Scottish Investment Trust | Financials | Investment Trusts |
| WTAN | Witan Investment Trust | Financials | Investment Trusts | |
| 5 | AAL | Anglo American | Basic Materials | Mining & Metals |
| BLT | BHP Billiton | Basic Materials | Mining & Metals | |
| RIO | Rio Tinto | Basic Materials | Mining & Metals |
| Atom | Code | Name | Market Sector | Remarks |
| 6 | MNKS | Monks Investment Trust | Financials | Investment Trusts |
| SMT | Scottish Mortgage Investment Trust | Financials | Investment Trusts | |
| 7 | EDIN | Edinburgh Investment Trust | Financials | Investment Trusts |
| MRCM | Mercantile Investment Trust | Financials | Investment Trusts | |
| 8 | ANTO | Antofagasta | Basic Materials | Mining & Metals |
| VED | Vedanta Resources | Basic Materials | Mining & Metals | |
| 9 | ATST | Alliance Trust | Financials | Investment Trusts |
| FEV | Fidelity European Values | Financials | Investment Trusts | |
| RCP | RIT Capital Partners | Financial | Investment Trusts | |
| 10 | BDEV | Barratt Developments | Cyclical Consumer Goods & Services | Homebuilding |
| PSN | Persimmon | Cyclical Consumer Goods & Services | Homebuilding | |
| RDW | Redrow | Cyclical Consumer Goods & Services | Homebuilding | |
| 11 | 0593q | Samsung Electronics | Cyclical Consumer Goods & Services | Consumer Electronics |
| 0593xq | Samsung Electronics | Cyclical Consumer Goods & Services | Consumer Electronics | |
| 12 | AV | Aviva | Financials | Insurance - Multiline |
| PRU | Prudential | Financials | Insurance - Life & Health | |
| LGEN | Legal and General Gp | Financials | Insurance - Multiline | |
| FP | Friends Provident | Financials | Insurance - Life & Health | |
| STAN | Standard Chartered | Financials | Banks | |
| FRCL | Foreign & Colonial Investment Trust | Financials | Investment Trusts |
A.3 Tokyo Stock Exchange
| Atom | Code | Name | Market Sector | Remarks |
|---|---|---|---|---|
| 1 | 8001 | Itochu Corp | Wholesale Trade | Section 1 |
| 8002 | Marubeni Corp | Wholesale Trade | Section 1 | |
| 8031 | Mitsui & Co | Wholesale Trade | Section 1 | |
| 8053 | Sumitomo Corp | Wholesale Trade | Section 1 | |
| 8058 | Mitsubishi Corp | Wholesale Trade | Section 1 |
| Atom | Code | Name | Market Sector | Remarks |
| 2 | 8725 | Mitsui Sumitomo Insurance Gp Hldg | Insurance | Section 1 |
| 8754 | NIPPONKOA Insurance Co. | Insurance | Section 1 | |
| 8755 | Sompo Japan Insurance Inc. | Insurance | Section 1 | |
| 8759 | Nissay Dowa General Insurance Co. | Insurance | Section 1 | |
| 8761 | Aioi Insurance Co | Insurance | Section 1 | |
| 8763 | Fuji Fire & Marine Insurance Co | Insurance | Section 1 | |
| 3 | 8601 | Daiwa Securities Gp Inc | Securities | Section 1 |
| 8604 | Nomura Hldg Inc | Securities | Section 1 | |
| 8606 | Shinko Securities Co | Securities | Section 1 | |
| 8607 | Mizuho Investors Securities Co | Securities | Section 1 | |
| 8609 | Okasan Securities Gp Inc | Securities | Section 1 | |
| 8613 | Marusan Securities Co | Securities | Section 1 | |
| 8614 | Toyo Securities Co | Securities | Section 1 | |
| 8616 | Tokai Tokyo Securities Co | Securities | Section 1 | |
| 8622 | Mito Securities Co | Securities | Section 1 | |
| 8624 | Ichiyoshi Securities Co | Securities | Section 1 | |
| 4 | 8801 | Mitsui Fudosan Co | Real Estate | Section 1 |
| 8802 | Mitsubishi Estate Co | Real Estate | Section 1 | |
| 8815 | Tokyu Land Co | Real Estate | Section 1 | |
| 8830 | Sumitomo Realty & Development Co | Real Estate | Section 1 | |
| 5 | 8356 | The Juroku Bank | Banks | Section 1 |
| 8360 | The Yamanashi Chuo Bank | Banks | Section 1 | |
| 8362 | The Fukui Bank | Banks | Section 1 | |
| 8368 | The Hyakugo Bank | Banks | Section 1 | |
| 8381 | The San-in Godo Bank | Banks | Section 1 | |
| 8382 | The Chugoku Bank | Banks | Section 1 | |
| 8386 | The Hyakujushi Bank | Banks | Section 1 | |
| 8388 | The Awa Bank | Banks | Section 1 | |
| 8390 | The Kagoshima Bank | Banks | Section 1 | |
| 8394 | The Higo Bank | Banks | Section 1 | |
| 6 | 5401 | Nippon Steel Corp | Steel & Iron | Section 1 |
| 5405 | Sumitomo Metal Industries | Steel & Iron | Section 1 | |
| 5406 | Kobe Steel | Steel & Iron | Section 1 | |
| 5411 | JFE Hldg Inc | Steel & Iron | Section 1 |
| Atom | Code | Name | Market Sector | Remarks |
| 7 | 8253 | Credit Saison Co | Other Financing Business | Section 1 |
| 8515 | Aiful Corp | Other Financing Business | Section 1 | |
| 8564 | Takefuji Corp | Other Financing Business | Section 1 | |
| 8572 | Acom Co | Other Financing Business | Section 1 | |
| 8574 | Promise Co | Other Financing Business | Section 1 | |
| 8583 | Mitsubishi UFJ Financial Gp Inc | Other Financing Business | Section 1 | |
| 8 | 8308 | Resona Hldg Inc | Banks | Section 1 |
| 8309 | Chuo Mitsui Trust Hldg Inc | Banks | Section 1 | |
| 8403 | The Sumitomo Trust & Banking Co | Banks | Section 1 | |
| 8404 | Mizuho Trust & Banking Co | Banks | Section 1 | |
| 8411 | Mizuho Financial Gp Inc | Banks | Section 1 | |
| 9 | 4321 | Kenedix Inc | Services | Section 1 |
| 8804 | Tokyo Tatemono Co | Real Estate | Section 1 | |
| 8868 | Urban* | Real Estate | Section 1 | |
| 8888 | Creed Co | Real Estate | Section 1 | |
| 8902 | Pacific Hldg Inc | Real Estate | Section 1 | |
| 10 | 5726 | Osaka Titanium Technologies Co | Non-Ferrous Metals | Section 1 |
| 5727 | Toho Titanium Co | Non-Ferrous Metals | Section 1 | |
| 11 | 9104 | Mitsui O.S.K. Lines | Marine Transportation | Section 1 |
| 9107 | Kawasaki Kisen Kaisha | Marine Transportation | Section 1 | |
| 12 | 1801 | Taisei Corp | Construction | Section 1 |
| 1802 | Obayashi Corp | Construction | Section 1 | |
| 1803 | Shimizu Corp | Construction | Section 1 | |
| 1812 | Kajima Corp | Construction | Section 1 | |
| 13 | 5711 | Mitsubishi Materials Corp | Non-Ferrous Metals | Section 1 |
| 5713 | Sumitomo Metal Mining Co | Non-Ferrous Metals | Section 1 | |
| 5771 | Mitsubishi Shind | - | - | |
| 14 | 4751 | CyberAgent Inc | - | Mothers |
| 4788 | Cyber Communications Inc | - | Mothers |
*This instrument code no longer exist on the TSE, but may be related to Urban Life Co, in the real estate sales, brokerage, and leasing business, traded on the Osaka Securities Exchange as 8851.
A.4 Hong Kong Stock Exchange
| Atom | Code | Name | Market Sector | Remarks |
| 1 | 0001 | Cheung Kong Hldg | Properties | |
| 0011 | Hang Seng Bank | Finance | ||
| 0013 | Hutchison Whampoa | Consolidated Enterprises | ||
| 0016 | Sun Hung Kai Properties | Properties | ||
| 0066 | MTR Corp | Utilities | ||
| 0941 | China Mobile | Consolidated Enterprises | ||
| 2 | 0762 | China Unicom (HK) | Consolidated Enterprises | |
| 2318 | Ping An Insurance (Gp) Co of China | Finance | ||
| 2628 | China Life Insurance Co | Finance | ||
| 3 | 0688 | China Overseas Land & Investment | Properties | |
| 1109 | China Resources Land | Properties | ||
| 3383 | Agile Properties Hldg | Properties | ||
| 4 | 2899 | Zijin Mining Gp Co | Miscellaneous | |
| 3330 | Lingbao Gold Co | Miscellaneous | ||
| 5 | 0323 | Maanshan Iron & Steel Co | Industries | |
| 0347 | Angang Steel Co | Industries | ||
| 6 | 0019 | Swire Pacific A | Consolidated Enterprises | |
| 0087 | Swire Pacific B | Consolidated Enterprises | ||
| 7 | 0857 | PetroChina Co | Industries | Oil & Natural Gas |
| 0883 | CNOOC | Industries | Oil & Natural Gas |
A.5 Singapore Stock Exchange
| Atom | Code | Name | Market Sector | Remarks |
| 1 | Z74 | Singtel | TSC | |
| Singtel 10 | TSC | |||
| Singtel 100 | TSC | |||
| 2 | C6L | Singapore Airlines | TSC | |
| Singapore Airlines 200 | TSC | |||
| 3 | C56 | Celestial Nutrifoods | Manufacturing | |
| C86 | China Sun Bio-Chem Tech Gp Co | Manufacturing | ||
| 4 | C68 | Mirach Energy | Services | |
| W81 | Sky China Petroleum Svcs | Services | ||
| F33 | Ferrochina | Manufacturing | ||
| E90 | China Sky Chemical Fibre Co | Manufacturing | ||
| 5 | C31 | CapitaLand | Properties | |
| C09 | City Development | Properties | ||
| 6 | D05 | DBS Gp Hldg | Finance | |
| U11 | United Overseas Bank | Finance | ||
| O39 | Oversea-Chinese Banking Corp | Finance | ||
| W05 | Wing Tai Hldg | Properties |
References
- (1) All transactions through electronic order books are automatically logged, and subsequently incorporated into various high-frequency financial databases. Some over-the-counter (OTC) transactions are also logged, but these do not always make their way into the main databases.
- (2) Downloaded using the MATLAB script http://www.mathworks.com/matlabcentral/fileexchange/18458 written by Josiah Renfree.
- (3) In principle, we can sacrifice some statistical significance, and use a shorter long-time window for better temporal resolution. Alternatively, we can work with higher-frequency time series data.
- (4) R. N. Mantegna, Eur. Phys. J. B 11, 193 (1999).
- (5) J.-P. Onnela, A. Chakraborti, K. Kaski, and J. Kertész, Eur. Phys. J. B 30, 285 (2002).
- (6) J.-P. Onnela, A. Chakraborti, K. Kaski, J. Kertész, and A. Kanto, Physica Scripta T106, 48 (2003).
- (7) J.-P. Onnela, K. Kaski, and J. Kertész, Eur. Phys. J. B 38, 353 (2004).
- (8) C. Coronello, M. Tumminello, F. Lillo, S. Miccichè, and R. N. Mantegna, Proc. SPIE 6601, 66010T (2007).
- (9) G. Bonanno, G. Caldarelli, F. Lillo, S. Miccichè, N. Vandewalle, and R. N. Mantegna, Eur. Phys. J. B 38, 363 (2004).
- (10) C. B. Hawkesby, I. W. Marsh, and I. Stevens, Bank of England Working Paper No. 256, 2005. Available at SSRN http:ssrn.com/abstract=724062.
- (11) S. Sinha and R. K. Pan, “Uncovering the internal structure of the Indian financial market: Large cross-correlation behavior in the NSE”, in Econophysics of Markets and Business Networks, edited by A. Chatterjee and B. K. Chakrabarti, pp. 3–19, 2007.
- (12) R. K. Pan and S. Sinha, Phys. Rev. E 76, 046116 (2007).
- (13) T. Heimo, J. Saramäki, J.-K. Onnela, and K. Kaski, Physica A 383, 147 (2007).
- (14) R. Coelho, S. Hutzler, P. Repetowicz, and P. Richmond, Physica A 373, 615 (2007).
- (15) C. Coronello, M. Tumminello, F. Lillo, S. Miccichè, and R. N. Mantegna, Acta Phys. Pol. B 36, 2653 (2005).
- (16) D.-H. Kim and H. Jeong, Phys. Rev. E 72, 046133 (2005).
- (17) J.-P. Onnela, A. Chakraborti, and K. Kaski, Phys. Rev. E 68, 056110 (2003).
- (18) G. Bonanno, F. Lillo, and R. N. Mantegna, Quant. Fin. 1, 96 (2001).
- (19) I. I. Zovko and J. D. Farmer, “Correlations and clustering in the trading of members of the London Stock Exchange”, in Proceedings of the International Conference on Complexity, Metastability, and Nonextensivity, pp. 287–299, 2007.
- (20) W.-S. Jung, S. Chae, J.-S. Yang, O. Kwon, and H.-T. Moon, “Analysis in correlation for the Korean stock market”, in Proceedings of the SPIE Conference on Noise and Fluctuations in Econophysics and Finance, edited by D. Abbott, J.-P. Bouchaud, X. Gabaix, and J. L. McCauley, pp. 330–338, 2005.
- (21) W.-S. Jung, S. Chae, J.-S. Yang, and H.-T. Moon, Physica A 361, 263 (2006).
- (22) L. Kullmann, J. Kertész, and R. N. Mantegna, Physica A 287, 412 (2000).
- (23) S. M. Focardi and F. J. Fabozzi, Quant. Fin. 4, 417 (2004).
- (24) V. V. Gafiychuk, B. Y. Datsko, and J. Izmaylova, Physica A 341, 547 (2004).
- (25) J. Idicula, NET Institute Working Paper No. 04-17, 2004. Available at SSRN http://ssrn.com/abstract=634681.
- (26) T. Aste, T. Di Matteo, M. Tumminello, and R. N. Mantegna, Proc. SPIE 5848, 100 (2005).
- (27) K. Doherty, R. Adams, N. Davey, and W. Pensuwon, “Hierarchical topological clustering learns market sectors”, Proceedings of the 2005 ICSC Symposium on Advanced Computing in Financial Markets. Available at http://hdl.handle.net/2299/776.
- (28) S. Miccichè, F. Lillo, and R. N. Mantegna, “Correlation based hierarchical clustering in financial time series”, Proceedings of the 31st Workshop of the International School of Solid State Physics (Sicily, Italy, July 20–26, 2004), pp. 327–335, World Scientific, 2005.
- (29) M. Tumminello, T. Aste, T. Di Matteo, and R. N. Mantegna, Proc. Natl. Acad. Sci. USA 102, 10421 (2005).
- (30) A. M. Alonso, J. R. Berrendero, A. Hernández, and A. Justel, Comput. Statist. Data Anal. 51, 762 (2006).
- (31) M. A. Juárez and M. F. J. Steel, “Model-based clustering of non-Gaussian panel data”, CRiSM Paper No. 06-14, Warwick University, 2006.
- (32) C. Allefeld and S. Bialonski, Phys. Rev. E 76, 066207 (2007).
- (33) L. Bauwens and J. V. K. Rombouts, Econ. Rev. 26, 365 (2007).
- (34) C. Rummel, G. Baier, and M. Müller, Euro. Phys. Lett. 80, 68004 (2007).
- (35) M. Tumminello, F. Lillo, and R. N. Mantegna, Eur. Phys. Lett. 78, 30006 (2007).
- (36) M. Corduas and D. Piccolo, Comput. Statist. Data Anal. 52, 1860 (2008).
- (37) S. Frühwirth-Schnatter and S. Kaufmann, J. Business & Econ. Stat. 26, 78 (2008).
- (38) T. Heimo, G. Tibély, J. Saramäki, K. Kaski, and J. Kertész, Physica A 387, 5930 (2008).
- (39) G. Innocenti and D. Materassi, J. Phys. A: Math. Theor. 41, 205101 (2008).
- (40) Y. Ma, A. Y. Yang, H. Derksen, and R. Fossum, SIAM Rev. 50, 413 (2008).
- (41) C. Rummel, Phys. Rev. E 77, 016708 (2008).
- (42) M. Tumminello, F. Lillo, and R. N. Mantegna, physics.soc-ph/0809.4615, 2008.
- (43) Osiris database on public companies worldwide, Bureau van Dijk. Company profiles retrieved Jan 2009.
- (44) Media release, Cheung Kong (Holdings) Ltd, 27 Jul 2007. http://www.ckh.com.hk/eng/media/2007/ew_0001ann-20070727.pdf.
- (45) Associated Press Worldstream, “Hong Kong MTR Corp. signs agreement to build, operate new Beijing rail line”, 13 Apr 2006. http://www.highbeam.com/doc/1P1-121872886.html.
- (46) Reuters, “MTR says Cheung Kong wins $900 mln property project”, 28 Nov 2007. http://www.reuters.com/article/rbssIndustryMaterialsUtilitiesNews/idUSHKG34536920071128.
- (47) This can be done in many ways, but we find identifying with the average of the maximum intra-atom correlation and with the average of mininum intra-atom correlation from all constituent atoms works most of the time.
- (48) B. M. Roehner, Physica A 347, 613 (2005).
- (49) V. Tola, F. Lillo, M. Gallegati, and R. N. Mantegna, J. Econ. Dyn. Control 32, 235 (2008).
- (50) G. Bonanno, F. Lillo, and R. N. Mantegna, Physica A 299, 16 (2001).
- (51) J.-P. Onnela, A. Chakraborti, K. Kaski, and J. Kertész, Physica A 324, 247 (2003).
- (52) T. Araújo and F. Louçã, Quant. Fin. 7, 63 (2007).
- (53) T. Araújo and F. Louçã, Phys. Lett. A 372, 429 (2008).