Do Active Regions Modify Oscillation Frequencies?
Abstract
We investigate the variation of high-degree mode frequencies as a local response to the active regions in two different phases of the solar activity cycle. We find that the correlation between frequency shifts and the surface magnetic activity measured locally are significantly different during the two activity periods.
1 Introduction
The oscillation frequencies are known to vary in phase with the solar activity cycle. In most of the earlier studies (see Jain & Bhatnagar 2003, and references therein), the variation between the frequency shifts and activity, as measured by different proxies, demonstrated a linear relation. But a detailed analysis using the improved and continuously measured eigen-frequencies over solar cycle 23 indicates complex relationships: a strong correlation during the rising and declining phases and a significantly lower correlation during the minimum phase (Jain et al. 2009). In addition, there is no consensus as to the solar origin of these changes. There is some indication that the variation of the high-degree mode frequencies are spatially as well as temporally associated with active regions (Hindman et al. 2000; Howe et al. 2008). In this context, we investigate the variation of high-degree mode frequencies as a local response to active regions.
2 Analysis and Results
We use the ring-diagram technique (Hill 1988; Corbard et al. 2003) to calculate the high-degree mode frequencies and examine the frequency shifts during two Carrington Rotation (CR) periods of the solar cycle 23: one during the descending phase covering the period October 21–November 19, 2003 (CR 2009) and the other during the low activity period of June 20–July 18, 2007 (CR 2058). We analyze a set of 189 individual regions on the solar disk, which is commonly referred to as a dense-pack mosaic. Each region is about 15∘ 15∘ in heliographic latitude and longitude and is tracked for a period of 1664 minutes. The centers of the regions are separated by 7.5∘ in latitude and longitude and extend roughly to 52.5∘ from disk center. By repeating the analysis over the entire dense-pack mosaic, the frequencies are determined as a function of ring-day (1664 min) and position on the solar disk. For each wavenumber and mode order, the frequency shifts () are computed relative to the spatial average obtained from the 189 tiles. The strength of the magnetic field associated with each tile is also estimated by calculating a Magnetic Activity Index (MAI) which represents the average over all the pixels in a given tile. This is obtained from the magnetograms mapped and tracked in the same way as the Dopplergrams.
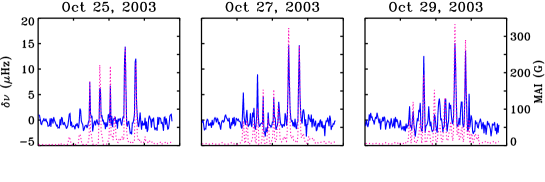
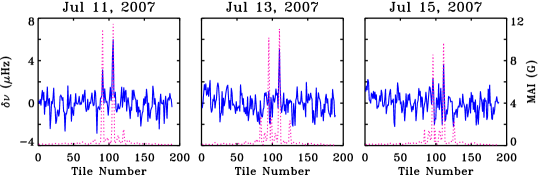
The frequency shifts corresponding to the ( = 3) mode with harmonic degree = 242 are shown in Figure 1. It reveals that the frequencies can vary as much as 20 Hz within an active region having high magnetic-field strength compared to the quiet Sun. In the same figure, we also plot the corresponding MAI (dotted line). A good agreement between and MAI, particularly for large shifts, is clearly visible.
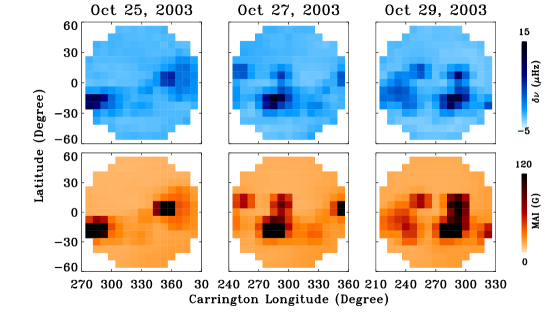
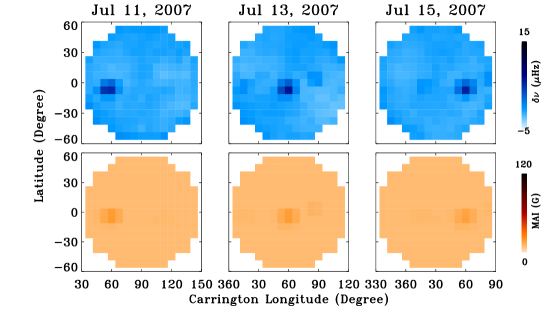
Figures 2–3 display images of the frequency shifts averaged over all modes (upper panels) as a function of the position of the solar disk for three days during CR 2009 and CR 2058, respectively. The lower panels in each figure correspond to the coeval MAI. For each of the images, each pixel corresponds to a single tile in the dense-pack mosaic. Comparing the top and bottom panels, it is clearly seen that the tiles with large frequency shifts match very well with the tiles at the same location having a large magnetic field. Thus, areas of high frequency shifts appear as active regions and viceversa. This confirms the findings of Hindman et al. (2000) that local frequency shift acts as a tracer of magnetic activity. However during the low-activity period (Figure 2), where both the shifts and MAI are small, we note a few tiles with positive frequency shifts that have no counterparts in the MAI image implying a weaker agreement. In order to estimate how well we can associate the locations of active regions as locations of frequency shifts, we calculate the Pearson’s correlation coefficient () between the shifts and MAI for each of the three ring-days. These are found to be 0.91, 0.93, and 0.88 and 0.74, 0.77, and 0.85, for CR 2009 and 2058, respectively and confirms that the correlation between shifts and the surface magnetic activity during the two activity periods are significantly different. This result is consistent with the recent findings inferred from global modes (Jain et al. 2009).
Thus the argument that the solar-cycle variations in the global mode frequencies are due to global averaging of the local effect of active regions (Hindman et al. 2001) is only partially supported by our analysis. We believe that the weak component of the magnetic field, e.g. ubiquitous horizontal field or turbulent field, must be taken into account to fully explain the frequency shifts, particularly during the minimal-activity phase of the solar cycle.
Acknowledgements.
We thank John Leibacher for a critical reading of the manuscript. This research was supported in part by NASA grants NNG 05HL41I and NNG 08EI54I. This work utilizes data obtained by the Global Oscillation Network Group program, managed by the National Solar Observatory, which is operated by AURA, Inc. under a cooperative agreement with the National Science Foundation. The data were acquired by instruments operated by the Big Bear Solar Observatory, High Altitude Observatory, Learmonth Solar Observatory, Udaipur Solar Observatory, Instituto de Astrofísica de Canarias, and Cerro Tololo Interamerican Observatory. This work also utilizes 96-minute magnetograms from SOI/MDI on board Solar and Heliospheric Observatory (SOHO). SOHO is a project of international cooperation between ESA and NASA.References
- Corbard et al. (2003) Corbard, T., Toner, C., Hill, F., Hanna, K. D., Haber, D. A., Hindman, B. W., & Bogart, R. S. 2003, in ESA SP-517, Local and Global Helioseismology: The Present and Future, ed. H. Sawaya-Lacoste, ESA SP 517, 255
- Hill (1988) Hill, F. 1988, ApJ, 333, 996
- Hindman et al. (2000) Hindman, B., Haber, D., Toomre, J., & Bogart, R. 2000, Solar Phys., 192, 363
- Hindman et al. (2001) Hindman, B. W., Haber, D. A., Toomre, J., & Bogart, R. S. 2001, in Helio- and Asteroseismology at the Dawn of the Millennium, ed. A. Wilson, ESA SP 464, 143
- Howe et al. (2008) Howe, R., Haber, D. A., Hindman, B. W., Komm, R., Hill, F., & Gonzalez Hernandez, I. 2008, in Subsurface and Atmospheric Influences on Solar Activity, eds. R. Howe, R. W. Komm, K. S. Balasubramaniam and G. J. D. Petrie, ASP Conf. Ser., 383, 305
- Jain & Bhatnagar (2003) Jain, K. & Bhatnagar, A. 2003, Solar Phys., 213, 257
- Jain et al. (2009) Jain, K., Tripathy, S. C., & Hill, F. 2009, ApJ, in press