A high-speed bi-polar outflow from the archetypical pulsating star Mira A
Optical images and high–dispersion spectra have been obtained of the ejected material surrounding the pulsating AGB star Mira A. The two streams of knots on either side of the star, found in far ultra–viollet (FUV) GALEX images, have now been imaged clearly in the light of H. Spatially resolved profiles of the same line reveal that the bulk of these knots form a bi–polar outflow with radial velocity extremes of 150 km s-1 with respect to the central star. The South stream is approaching and the North stream receding from the observer. A displacement away from Mira A between the position of one of the South stream knots in the new H image and its position in the previous Palomar Observatory Sky Survey (POSS I) red plate has been noted. If interpreted as a consequence of expansion proper motions the bipolar outflow is tilted at 69∘ 2∘ to the plane of the sky, has an outflow velocity of 160 10 km s-1 and is 1000 y old.
Key Words.:
CSM:general–CSM: AGB stars –CSM: individual objects: Mira1 Introduction
The binary system Mira AB has attracted attention over 400 yr (for a summary see Hoffleit, 1997), for apart from being very close to the Sun (the Hipparcos distance is 107 10 pc) Mira A is the archetypical pulsating variable star with a period of hundreds of days and brightness range of 8 mag (Reid & Goldston 2002). Its periodic outbursts over the last 80 cycles are listed by Percy & Bagby (1999). Hubble Space telescope images have shown Mira B to be separated by 0.5″ from A ( 54 AU; Matthews & Karovska 2006). Mira A of intermediate mass is certainly in its volatile asymptotic giant branch (AGB) phase whereas B was previously identified as a White Dwarf but recently as a somewhat innocuous F-type star similar to the Sun though with an accretion disk formed by the mass ejections from A (Karkova et al. 2005; Ireland et al. 2007 and refs. cited therein). In any case B is too well separated from A to affect significantly the overall dynamics of the ejected material.
Interest in Mira A has been further heightened by the discovery with the GALEX satellite of a 2∘ long ( 4 pc) FUV emitting tail (Martin et al. 2007). They propose that this traces the interactions with the local interstellar medium (ISM) over the past 30,000 y of the ejected material from Mira A. This is plausible (Wareing et al. 2007) for the star has a high space velocity of 120 km s-1 at an angle of 28∘ with respect to the plane of the sky tilted away from the observer and what appears to be a preceding bow-shock (Raga & Canto 2008). Perhaps relevant is the tail of similar dimensions apparently projecting from the similarly mass–ejecting proto–typical Luminous Blue Variable (LBV) star P Cygni (Meaburn et al. 1999); though later, deeper, observations in the higher excitation [O iii]5007 Å line show this tail as part of a larger complex of filaments but still convincingly associated with the star (Meaburn et al. 2004; Boumis et al. 2006 and references therein).
In the GALEX FUV images a group of emission knots close to Mira AB and called North Stream and South Stream by Martin et al. (2007) have been identified as recent manifestations of the mass ejections from Mira A. As these are within a field of a few arcmin diameter they have now been investigated at optical wavelengths using occulting strip imagery, to exclude scattered continuum light from the bright stellar image, and longslit, spatially resolved, high-dispersion spectrometry. The results of these optical observations will now be presented.
2 Observations and results
Observations were made with the Manchester Echelle Spectrometer (MES-SPM - see Meaburn et al. 1984; 2003) combined with the 2.1-m San Pedro Martir, (B.C. Mexico) telescope on 2008, 26 to 28 Oct. A SITe CCD was the detector with 10241024, 24 m pixels although 22 binning was employed. The ‘seeing’ throughout was 1″.
2.1 Imagery
MES-SPM has a limited imaging capability with a retractable plane mirror isolating the echelle grating and a clear area (4.375.32 arcmin2) replacing the spectrometer slit.
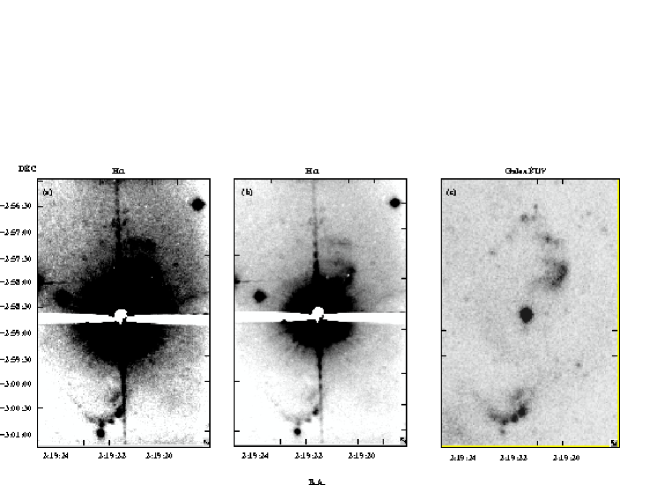
The image in Fig. 1 is a subset from this larger field obtained on the 2008 28 Oct. An occulting strip of chromium suppressed the bright image of Mira. The integration time was 2000 s. The coordinates (J2000) were added using the STARLINK gaia software. The 90Å bandwidth interference filter transmits predominantly the H nebular line as [N ii] 6548 & 6584 Å emission has been shown (Martin et al. 2007) to be very low. Confusing, faint star images were eliminated using the PATCH routine of the STARLINK gaia software. Deep and lighter representations of the new H image are compared in Fig. 1 to the FUV GALEX image from Martin et al. (2007).
2.2 Longslit spectroscopy
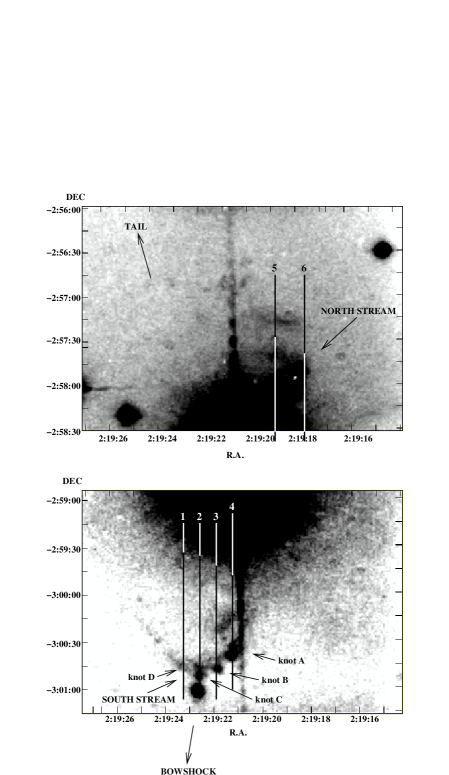
Spatially resolved, longslit H line profiles were obtained with the MES–SPM along the lines marked 1–6 in Fig. 2. These are only partial lengths of the full NS slits as measurable H emission only occurred over small sections of the full slit lengths containing the bright knots in the North and South streams. The increments along the slit length each corresponds to 0.63″.
In this spectroscopic mode MES–SPM has no cross–dispersion consequently, for the present observations, a filter of 90 Å bandwidth was used to isolate the 87th echelle order containing the H and [N ii] 6548 & 6584 Å nebular emission lines. The slit width was always 300 m which is 3.8″ on the sky and 20 km s-1 spectral halfwidth (HPBW). Each integration time was 1800 s. Also indicated in Fig. 2 are the directions of the 2∘ long FUV emitting tail detected by Martin et al. (2007) and of the proposed bowshock found in the same wavelength domain.
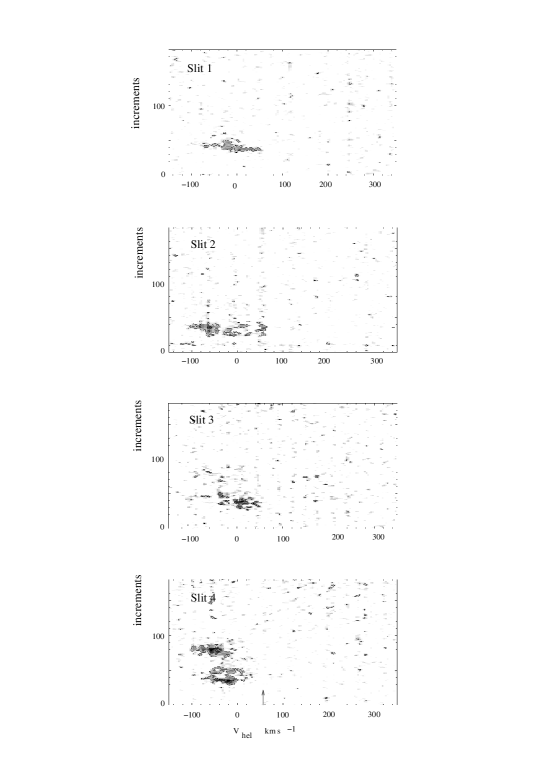
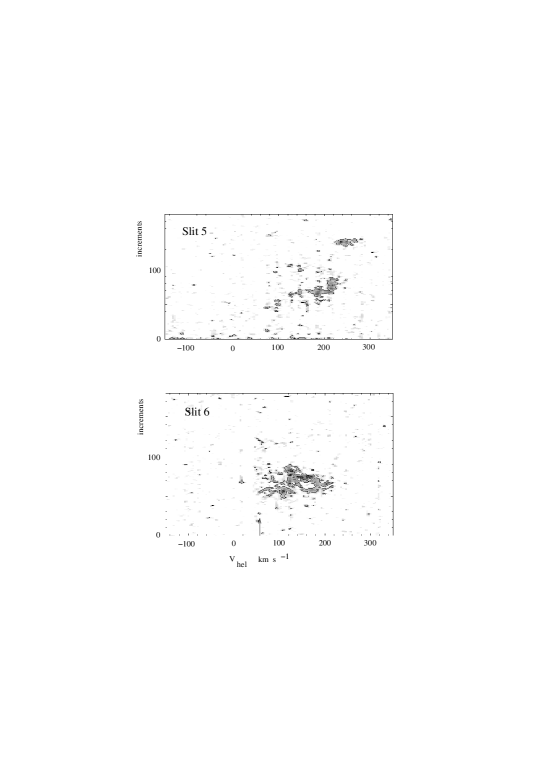
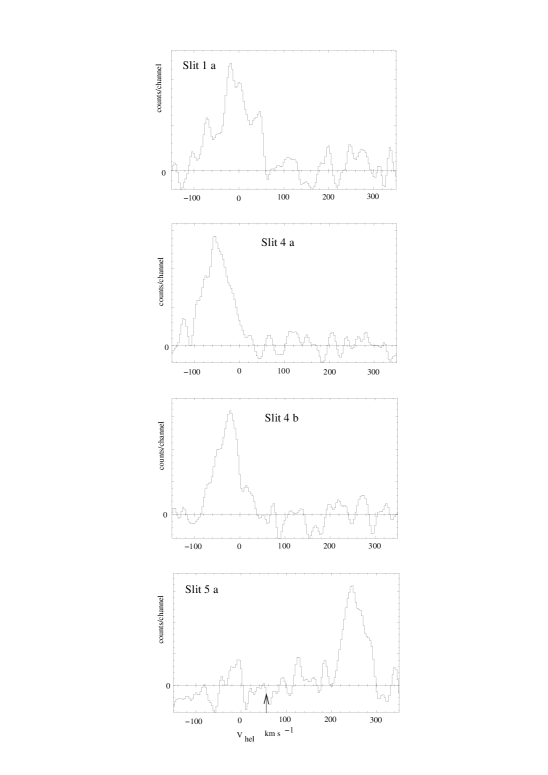
The longslit spectra were cleaned of cosmic rays, bias corrected and calibrated in wavelength to 1 km s-1 accuracy in the usual way using STARLINK figaro software. The greyscale representation of the position–velocity (pv) arrays of H line profiles (after subtraction of the sky background spectra) for the partial slit lengths shown in Fig. 2 for Slits 1–4 and 5–6 are shown in Figs. 3 & 4 respectively. Here contours of the H relative surface brightnesses with linear intervals have been overlain on the negative greyscale representations. As no standard star was observed the absolute surface brightnesses are unreliable and will not be presented here. Line profiles from various incremental lengths of these pv arrays of profiles are shown in Fig. 5.
3 Discussion
3.1 The bi-polar outflow
The radial velocities of the South stream of knots shown in Fig. 3 show a shift of around -150 km s-1 with respect to the heliocentric systemic radial velocity = 56 km s-1 as given by Matthews et al. (2008 – N.B. = - 9.44 km s-1 for Mira A). A very similar shift, but now to positive radial velocities can be seen in Fig. 4 for the North Stream on the opposite side of Mira A. Only the more distant arc from Mira A (Figs. 1 & 2) covered by the element Slit 5a (see the profile in Fig. 5) has a greater shift (200 km s-1) in radial velocity with respect to . There seems therefore to be a strong bi-polar structure to the principal elements of this outflow.
This expansion radial velocity measurement of the bi-polar lobes has to be combined with a measurement of their expansion tangential velocity relative to Mira A to determine their actual expansion velocity. The expansion proper motions (PMs) then of the knots relative to Mira A are required for this purpose. Simple inspection of the H image in Fig. 1b and FUV image in Fig. 1c reveal that the knots in H emission are 2″ closer to the reference star at the bottom of both frames than in the FUV emission. This could indicate the displacement caused by a high expansion PM in the intervening 1.9 y between the two observation leading to an expansion velocity of 600 km s-1. However, a more likely cause is the spatial difference within the knots of the H and FUV emission regions.
This suggestion is born out by the spatial displacement of Knot B (Fig. 2) in the first Palomar Observatory Sky Survey POSS I red plate taken on the 26 Nov. 1954 and the H image in Fig. 1b obtained on the 20 Oct 2008. Only Knot B is clearly identifiable on this POSSI plate with the image of the brighter Knot A confused with that of a faint star.Curiously none of the Mira knots nor this star are detectable on the follow-up POSS II (23 Aug 1995) red plate. However, using the STARLINK gaia software the displacement of Knot B, measured with respect to the faint star field, in the intervening 53.90 y is +2″ in Right Ascension () and -17″in Declination () with an uncertainty of 2″ in both measurements determined mainly by the poor quality of the image of Knot B in the POSS I plate. This low quality is not surprising for the POSS bandwidth is many times greater than the present one, photographic emulsion was the detector and the focal length shorter. The PM of Knot B is then measured as d(,)/dt = (+37, -319) mas y-1 each to around 40 mas y-1 uncertainty. Here it is assumed that H dominates in the POSS I detection even though the bandwidth also encompasses the [S ii] 6717 & 6731Å lines and much more continuum light than the present observations.
For comparison a similar PM measurement of Mira A itself was made between the POSS I and POSS II red plates. In the intervening 40.74 y the displacement is -1.7″ in right ascension and -8.4″ in declination to give d(,)/dt = (-40, -206) mas y-1 with (30) mas y-1 uncertainties for the Mira A positions for these were only determined from the centroids of the diffraction spikes in the two images but still corrected for the small differences in coordinates of the faint star field.
It is firstly interesting that from these PM measurements Knot B is moving along PA = 173∘ which is reasonably aligned with bipolar axis of the South stream knots in Fig. 1 and tilted by a few degrees to the direction of Mira A (as noted by Martin et al. 2007) along PA 190∘ which is also the orientation of the long FUV tail (Fig. 2). An expansion along this bi-polar axis of 115 mas y-1 of Knot B relative to Mira A is therefore indicated to give an expansion tangential velocity of 58 20 km s-1. When combined with the expansion radial velocity of 150 km s-1, this indicates an outflow velocity of 160 km s-1 tilted for the southern lobe at 69 15∘ towards the observer with respect to the plane of the sky when all uncertainties are considered. More precise PM measurements of the knots are required to refine these estimations. The PM of Knot B with respect to Mira A, which is 127″ away from it, gives a time of 1000 y since its ejection. The Mira A outburst in 1070 (Ho 1962; Hoffleit 1997) then become candidate for the creation of these bi–polar lobes.
3.2 The leading bow-shock
The preceding arc of FUV emission in the direction of motion of Mira A has been interpretated as a bow–shock being generated by the 120 km s-1 space motion of Mira A through the local ISM (Martin et al. 2007). It should now be considered that the bi-polar outflow identified here could contribute to the creation of this bow–shock. In any case the radial velocity measurements (Figs 3 & 4) and the angular extent of the bi-polar lobes (Fig. 1) certainly indicate, without consideration of expansion PMs, that the outflow velocity is 200 km s-1. Incidently several planetary nebulae (PNe) with central binary systems, one star of which has evolved beyond its Mira A AGB phase, exhibit bow-shocks emitting optical lines, as they plough through the local ISM (Bond & Livio 1990 and refs. therein). However, the question is posed that if bi–polar ejecta are favoured as the creators of these bow–shocks then why has GALEX only detected one such system?
3.3 Evolution
Mira A is currently in its AGB phase and shows all the signs that it could evolve soon into a complex PN maybe with multiple bi-polar lobes. For comparison, such lobes of the PN NGC 6302 have been conclusively shown to have been ejected at a high velocity (630 km s-1; Meaburn et al 2005 & 2008) and formed over a timescale of 2000 yr. The bi–polar outflow from Mira A revealed here could easily develop into such features over a similar timescale. Meanwhile, if Mira A itself evolves into a hot PN progenitor as it sheds its outer layers in its current AGB phase during this period these high speed lobes will become radiatively ionized and emit a wide range of emission lines.
Acknowledgements.
We acknowledge the excellent support of the staff at the San Pedro Martir observatory during these observations. JAL gratefully acknowledges financial support from DGAPA-UNAM grant IN116908. MPR is supported by the IRCSET, Ireland. We are grateful to the referee, Dr. B. Welsh, for drawing our attention to the image of southern knots on the POSS I plates.References
- (1) Bond, H. E. & Livio, M., 1990, ApJ, 355, 568.
- (2) Boumis, P., Meaburn, J., Redman, M. P. & Mavromatakis, F., 2006, A&A, 457, L13.
- (3) Ho, P. Y., 1962, VA, 5, 127
- (4) Hoffleit, D., 1997, J. Am. Ass. Var. Star. Observ., 25, 115.
- (5) Ireland M. J. et al., 2007, ApJ, 662, 651.
- (6) Karovska, M., Schiegel, E., Hack, W., Raymond, J. C. & Wood, B. E. A., 2005, ApJ, 623, L137.
- (7) Martin, D. C., Seibert, M & Neill, J. D. et al., 2007, Nature, 448, 780.
- (8) Matthews, L. D. & Karovska, M., 2006, ApJ, 637, L49.
- (9) Matthews, L. D., Libert, Y., Gérard, E., Le Bertre, T., Reid, M. J., 2008, ApJ, 684, 603
- (10) Meaburn, J., Blundell, B., Carling, R., Gregory, D. E., Keir, D. F. & Wynne C. G., 1984, MNRAS, 210, 463.
- (11) Meaburn J., López J. A. & O’Connor J. A., 1999, ApJ, 516, L29.
- (12) Meaburn, J., López, J. A., Gutiérrez, L., Quiróz, F., Murillo, J. M., Valdéz, J., Pedrayez, M., 2003, RMxAA, 39, 185.
- (13) Meaburn,J., Boumis, P., Redman, M. P., López, J. A & Mavromatakis, F., 2004, A&A, 422, 602.
- (14) Meaburn, J., López, J. A., Steffen, W., Graham, M. F. & Holloway, A. J., 2005, AJ, 130, 2303.
- (15) Meaburn, J., Lloyd, M., Vayet, N. M. H. & López, J. A., 2008, MNRAS, 385, 269.
- (16) Percy, J. R. & Bagby, D. H., 1999, PASP, 111, 203.
- (17) Raga, A. C. & Cantó, J., 2008 ApJ, 685, L141.
- (18) Reid, M. J. & Goldston, J. E., 2001, ApJ, 568, 931.
- (19) Wareing, C. J., Zijlstra, A. A., O’Brien, T. J. & Seibert, M., 2007, ApJ, 670, L125.