Noise properties of the CoRoT††thanks: The CoRoT space mission, launched on December 27th 2006, has been developed and is operated by CNES, with the contribution of Austria, Belgium, Brazil, ESA, Germany, and Spain. CoRoT data become publicly available one year after release to the Co-Is of the mission from the CoRoT archive: http://idoc-corot.ias.u-psud.fr/. data
In this short paper, we study the photometric precision of stellar light curves obtained by the CoRoT satellite in its planet finding channel, with a particular emphasis on the timescales characteristic of planetary transits. Together with other articles in the same issue of this journal, it forms an attempt to provide the building blocks for a statistical interpretation of the CoRoT planet and eclipsing binary catch to date.
After pre-processing the light curves so as to minimise long-term variations and outliers, we measure the scatter of the light curves in the first three CoRoT runs lasting more than 1 month, using an iterative non-linear filter to isolate signal on the timescales of interest. The bevhaiour of the noise on 2 h timescales is well-described a power-law with index 0.25 in -magnitude, ranging from 0.1 mmag at to 1 mmag at , which is close to the pre-launch specification, though still a factor 2–3 above the photon noise due to residual jitter noise and hot pixel events. There is evidence for a slight degradation of the performance over time. We find clear evidence for enhanced variability on hours timescales (at the level of 0.5 mmag) in stars identified as likely giants from their magnitude and colour, which represent approximately 60 and 20% of the observed population in the direction of Aquila and Monoceros respectively. On the other hand, median correlated noise levels over 2 h for dwarf stars are extremely low, reaching 0.05 mmag at the bright end.
Key Words.:
methods: data analysis – techniques: photometric – stars: planetary systems1 Introduction
This letter presents a global assessment of the noise properties of the CoRoT planet-finding channel data to date, from a transit detection perspective, based on data collected over the first 14 months of the satellite’s operations.
A preliminary discussion of CoRoT’s photometric performance from an instrumental point of view was given by Auvergne et al. (2009). In this work, we start from the science grade data as released to the CoRoT community and, one year later, to the public. We focus specifically on the ‘white’ (– nm) light curves collected in the planet-finding channel of CoRoT.
We detail the pre-processing steps taken to minimise instrumental and astrophysical signals which can impede transit detection, and discuss the noise on transit timescales after pre-processing. The motivation for doing this is two-fold. First, it enables us to check whether the CoRoT planet-finding data meets its pre-launch specifications, and provides the first estimate of correlated noise levels in space-based time series based on a large dataset. Second, it provides us with a means of estimating the detection threshold for planetary transits as a function of stellar magnitude.
This is the first in a series of three papers: based on the photometric performance detailed here and on the results of the transit detection and ground-based follow-up program to date: Pont et al. (2009) presents an assessment of the overall CoRoT detection threshold, which in turn serves as the input for Fressin et al. (2009)’s attempt at a preliminary statistical interpretation of the CoRoT planet catch to date.
2 Light curve pre-processing
The CoRoT N2 (science-grade) data contain a number of artifacts and signals of astrophysical origin other than transits, which must be removed or reduced before the transit search can proceed. In this section, we detail the steps taken to do this, since it is the properties of the pre-processed light curves which determine the detectability of transits. In practice, of course, the CoRoT data are and will be analysed by different teams employing a variety of methods, which will no doubt be improved upon in the future. However, the output of the method presented here is, to the best of our knowledge, representative of the quality of the light curves used to detect transits in CoRoT data to date.
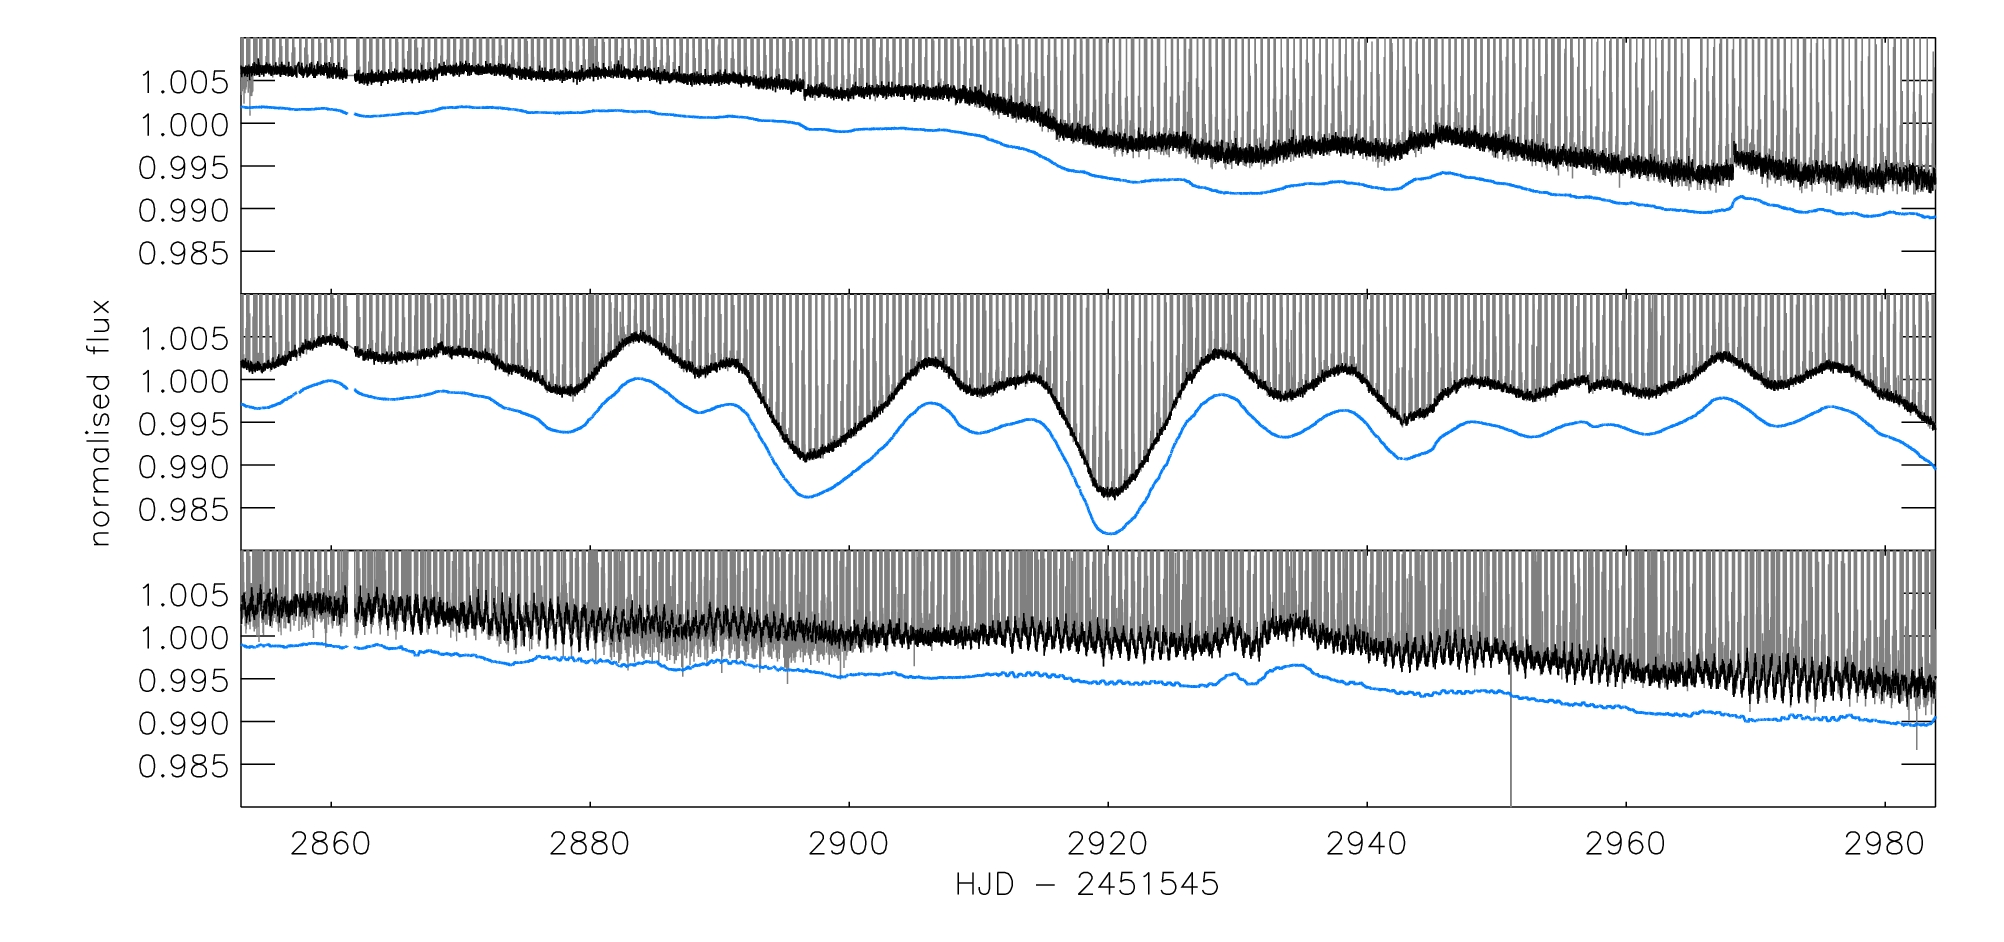
To illustrate the effects to be removed, three typical CoRoT N2 light curves for bright stars are shown in Fig. 1 (in grey). All were taken from the second CoRoT long run (150 d), LRa01, during which the satellite was pointed in the direction of the Monoceros constellation.
Most pro-eminent are upward outliers, due to the increased background during the satellite’s quasi-periodic crossings of the South Atlantic Anomaly (SAA), and a long term decay assumed to be of instrumental origin. Although data points collected during the SAA crossings are flagged by the N2 pipeline, not all of these data points are outliers. To maximise the duty cycle of the final light curves, we apply a short baseline iterative non-linear filter with - outlier rejection to identify and reject outliers. The non-linear filter consists of a 5-point boxcar filter followed by a median filter whose baseline was chosen to correspond to one hour (see Aigrain & Irwin 2004 for further details of this type of filter).
There are also, though at a much lower level, downward outliers associated with the satellite’s entry into and exit from the Earth’s shadow, which introduces a temporary loss of pointing accuracy (these are most clearly visible in the third example on Fig. 1 around date 2 885). These losses of pointing accuracy generally affect a single data point, which is flagged by the N2 pipeline. We use these flags to clip out the affected data. The example light curves after clipping are shown in black on Fig. 1.
For light curves which are binned on board to 512 s sampling111On-board exposure times are 32 s, but most data are rebinned to 512 s by averaging sets of 16 exposures on board. Where this is not the case, we perform the rebinning ourselves so as to work with a data set with approximately uniform sampling, though we use medians rather than averages to minimise sensitivity to outliers., some points which appear affected by eclipse entry and exit events are not flagged. For short (21d) runs, usually taken around equinoxes when theses events are most pro-eminent, we fold the light curves at the satellite orbital period and automatically identify the remaining data points affected. It is not easy to do the same thing for the longer runs, as the magnitude of these events and their timing within the satellite’s orbit evolve over timescales of months, so some minor effects of the Earth eclipses remain in those light curves.
All light curves share a long term downward trend, presumably due to some kind of instrumental decay or gradual pointing drift. In addition, most light curves show variations on timescales of days to weeks, which are generally interpreted as resulting from rotational modulation and evolution of active regions on the surface of the star. We estimate the long-term component of the light curve variations using a 1-day iterative non-linear filter (where the median filter has a 1-day baseline and the other parameters are as before). This estimate, shown in blue in Fig. 1, is subtracted from the clipped light curve, and the resulting detrended light curve is used to perform the transit search.
Most light curves also contain one or more sudden jumps, which are often followed by an exponential decay, though in some cases the decay is delayed and sudden rather than exponential. These so called ’hot pixel events’ are caused by high-energy particles impacts on the detector, which temporarily alter the sensitivity of one or more pixels (see Pinheiro da Silva et al. 2008). Hot pixels leave local high-frequency residuals in the detrended light curves which can be a source of false alarms in the transit search, though they do not obviously affect the global detrended light curve scatter.
In some cases, shorter timescale variations are also visible; these can be periodic or quasi-periodic, as expected for pulsations or residual satellite pointing jitter, or stochastic, as expected for e.g. surface granulation. This type of variability, occuring on typical transit timescales, cannot be filtered out without affecting a potential transit signal.
3 Noise estimates
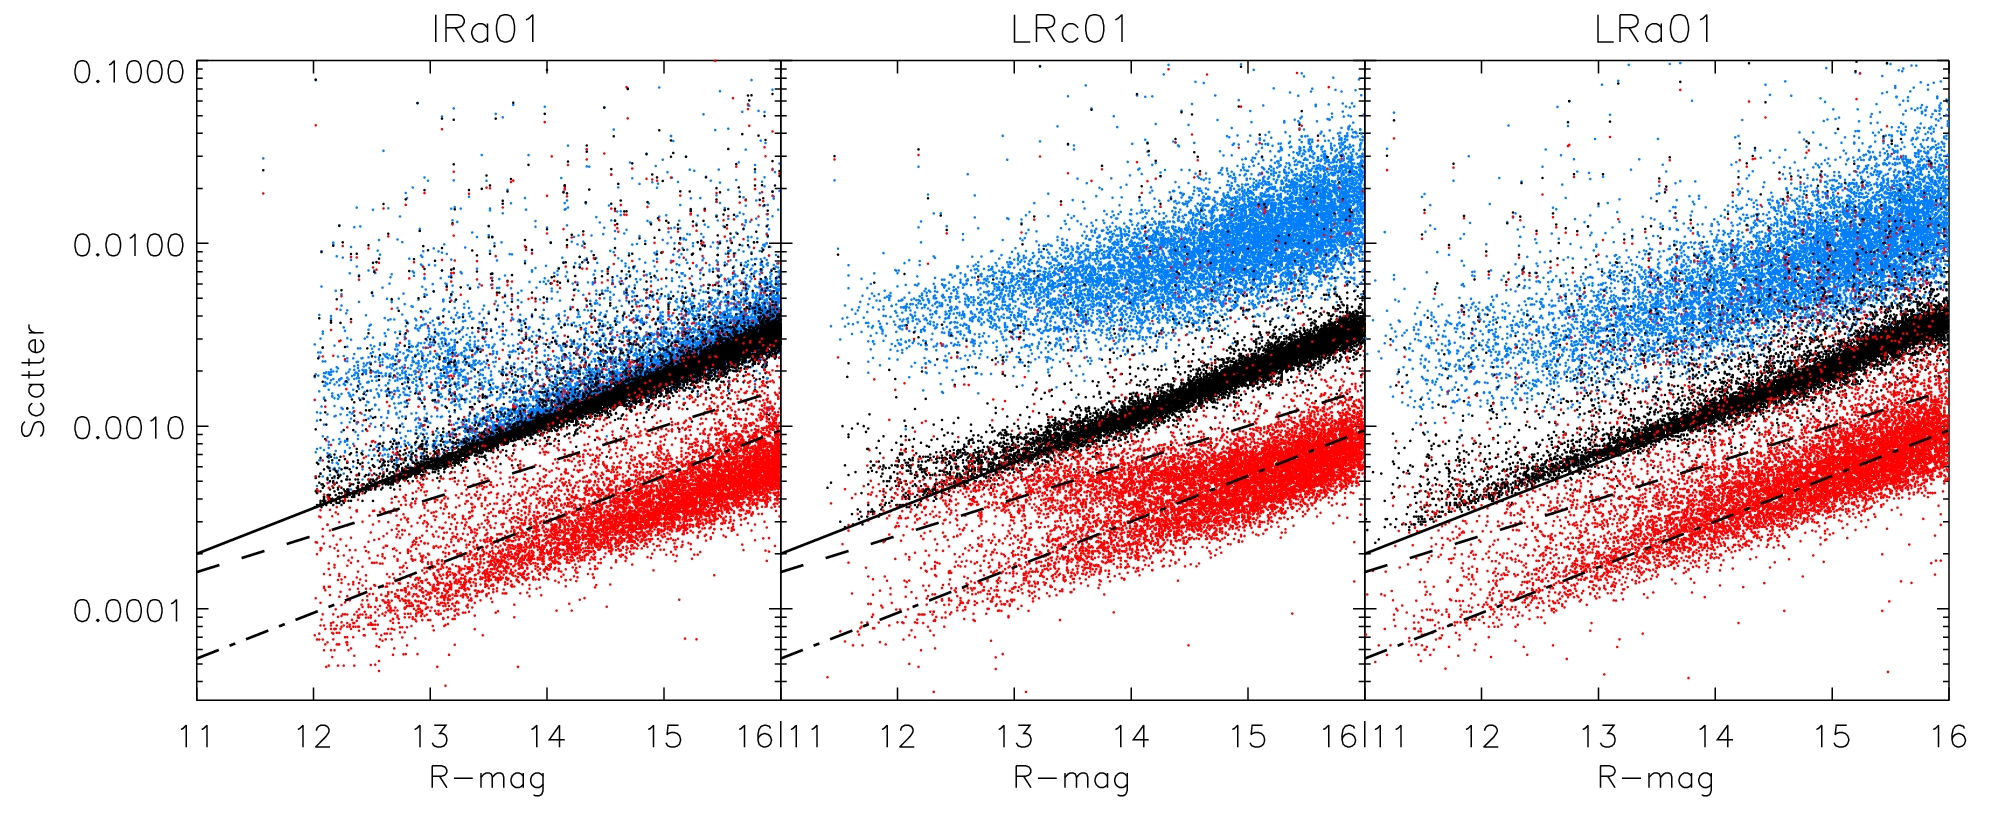
As shown by Pont et al. (2006), what determines the detectability of transits is the noise level over a typical transit duration, which is generally not equal to what one might infer from the point-to-point scatter of the light curve, due to the presence of correlated noise on hours timescales. We therefore evaluate the scatter of each light curve after detrending over both 512 s (point-to-point) and 2 h (CoRoT is sensitive to transits with periods up to a few weeks, which last approximately 2 h). The latter estimate is obtained by applying a 2 h baseline iterative non-linear filter to the detrended light curve. In both cases, we evaluate the scatter as , where MAD is using the median of absolute deviations from the median, an estimate of the standard deviation that is robust to outliers (Hoaglin et al., 1983).
If the noise was entirely white, the ratio between the two estimates (point-to-point and over 2 h) should correspond to the square root of the number of data points in a 2 h interval (in this case 14). The quadrature difference between the measured noise level on 2 h timescales and the value expected if the noise were white provides an estimate of the component of the noise which is correlated on 2 h timescales. For comparison, we also evaluate the scatter on long timescales from the light curve component which is subtracted in the detrending process.
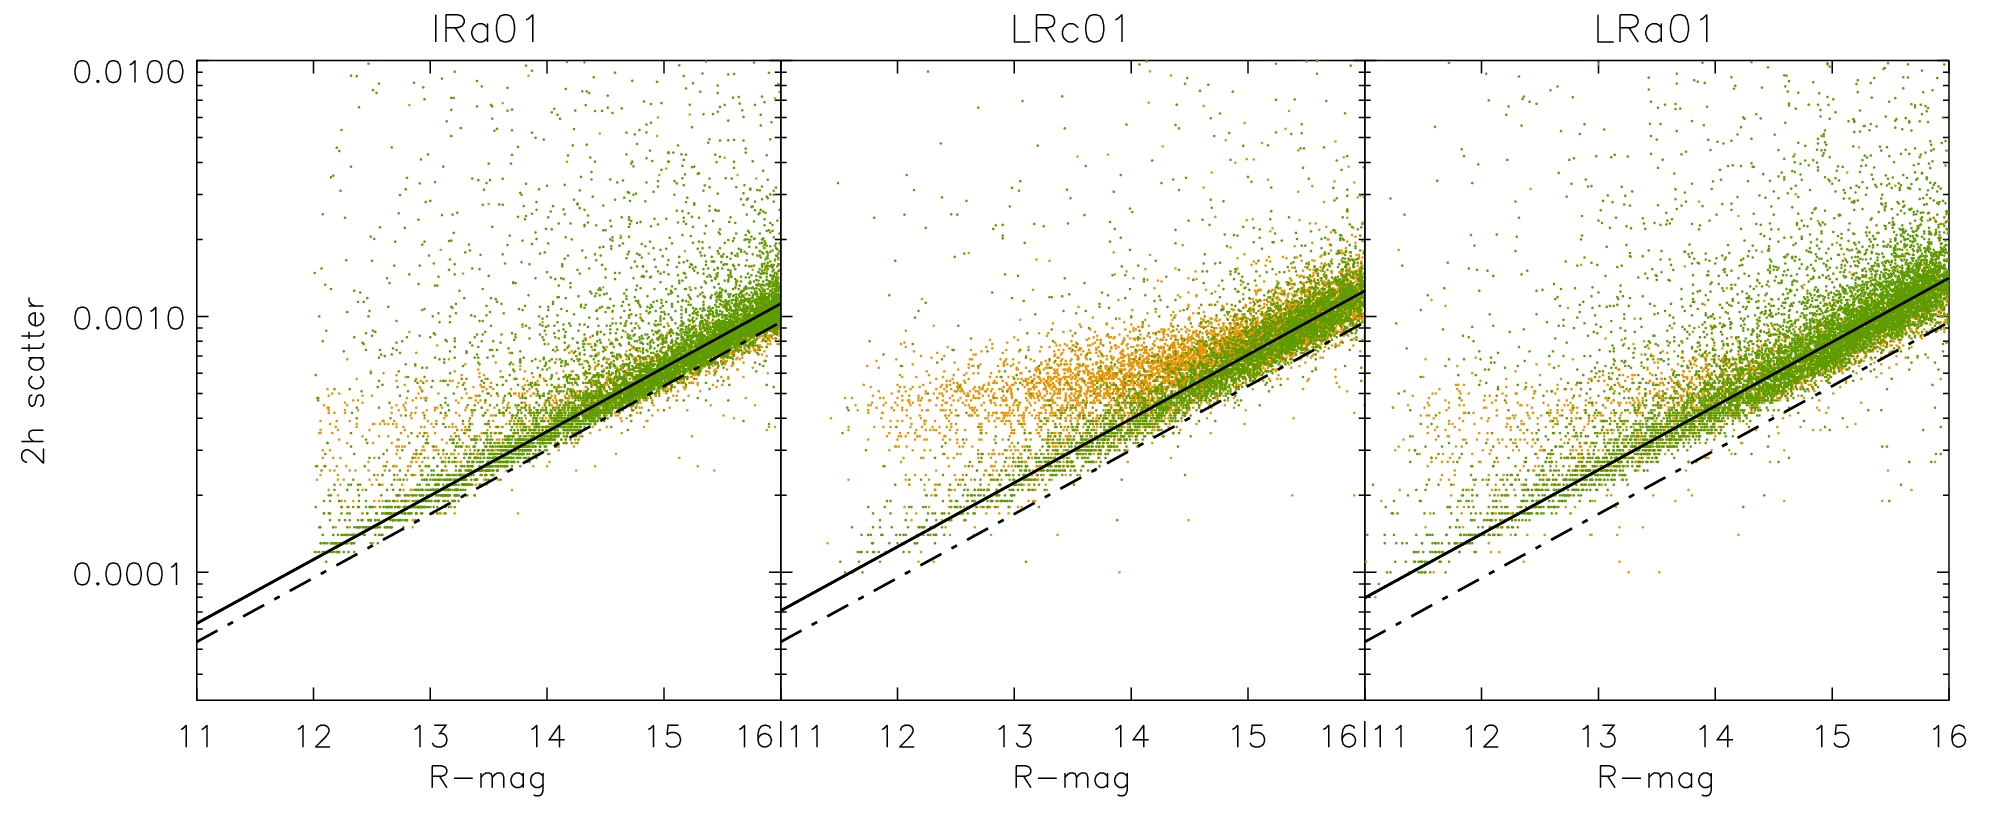
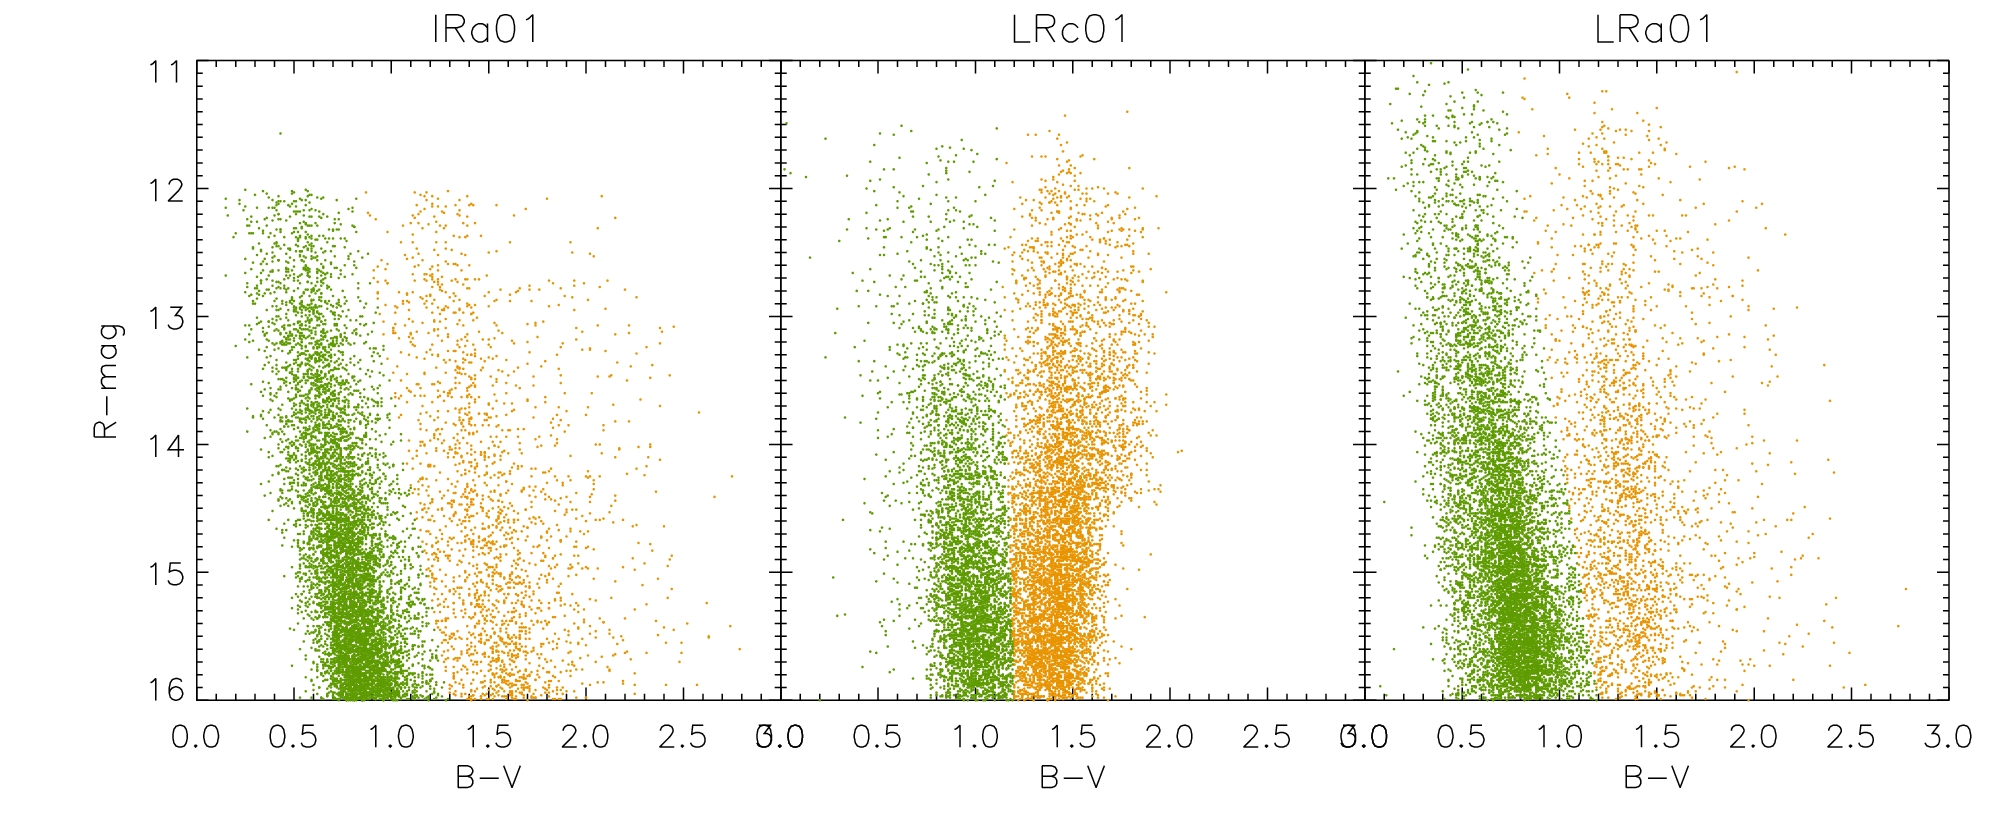
This was done for the CoRoT initial run IRa01 (60d in the Galactic Monoceros direction) and the first two long runs (LRc01 in the Aquila direction, and LRa01). The results are shown in Figs. 2 and 3. Each data point in both figures is a MAD-estimated scatter measurements for one star over the entire run. Fig. 2 shows the noise per 512 s exposure (black), compared to the noise on daily and longer timescales (blue), and the correlated noise over 2 h (red). Fig. 3 shows the total noise over 2 h, for stars identified as likely dwarfs (green) and giants (orange) from versus colour magnitude diagrams, which are shown in Fig. 4. We note that the colour-magnitude cuts we adopted are an over-simplification, and in particular also select some K-dwarfs as giants, but that the global inferred fractions of giants in each run (20% in IRa01, 58% in LRc01 and 22% in LRa01) are in agreement with more sophisticated estimates based on multi-colour photometry and, where available, spectroscopy (see Barbieri et al. Gandolfi et al. in prep.).
4 Discussion
The lower envelope of the point-to-point scatter (solid line in Fig. 2) is a factor 2 above the photon noise (dashed line) at the bright end, and rises somewhat more steeply (slope 0.25 in log, versus 0.2 for photon noise). However, the correlated noise on transit timescales (red points) is comparable to or slightly smaller than the white noise on 2 h timescales (dot-dashed line). The empirical relations between total 2 h noise and magnitude for dwarfs, shown as solid lines on Fig. 3, are given by:
| (1) |
where for IRa01, for LRc01 and for IRa01, indicating a gradual degradation of the photometric performance over time, which may be associated with the increase in incidence of hot pixel events. Again, the slope of this relation is slightly above that expected for source photon noise.
The pre-launch specification for CoRoT’s photometric performance is in 1 h down to (Auvergne et al., 2003). This specification was designed to ensure the detectability of transits of planets down to approximately in short-period ( week) orbits, assuming that noise averaged out in a white manner over timescales longer than 1 h. Thus it corresponds to in 2 h, while corresponds approximately to for a typical CoRoT dwarf target. Eq. (1) gives values of 6.3, 7.1 and at , close to, but slowly receding from, the pre-launch specification.
Although this level of photometric performance is already a vast improvement on any previously available long-baseline photometry of large samples of stars, there clearly remains scope for further improvement. The behaviour of the correlated noise with magnitude suggests it may dominated by effects such as satellite pointing jitter (as the aperture masks are smaller for fainter stars), and imperfect background correction. Improvements to the light curve generation, including e.g. a new jitter correction based on improved PSF modeling, and a posteriori ensemble light curve analysis, have recently been tested on CoRoT data (see Fiahlo et al., Mazeh et al. in prep.), and these will hopefully lead to improved performance in the short to medium term. The importance of developing an effective method for the treatment of light curve discontinuities, more sophisticated than the detrending applied here, is rapidly increasing, as visual examination of light curves from LRa01 indicates that almost every light curve is affected by at least one discernible discontinuity, compared to approximately one in four in IRa01. Such techniques are under development, though it is challenging to apply them in an automated fashion without unwittingly affecting other signals in the light curves.
|
|||||||||||||||||||||||||||||||||||||||||||||||||||||||||||||||||||||||||||||||||||||||||||||
Although we now have a simple relationship between noise on transit timescales and magnitude for dwarf stars, which can be used to estimate transit detection thresholds (Pont et al., 2009), for a statistical interpretation of the CoRoT planet catch (Fressin et al., 2009), it is also important to know what fraction of the stars deviate significantly from this relation. Table 1 lists the percentage of light curves, in each run, whose scatter over 2 h timescales is more than 1.5 times above the relation given by Eq. (1). At the bright end, 50% or more of the light curves show significant variability on transit timescales, rising to 70% in LRc01, while the fraction of drops to a few percent at the faint end.
Interestingly, because it is closer to the direction of the Galactic centre, LRc01 has a significantly larger fraction of giants (see Fig. 4). Fig. 3 clearly shows that a large fraction of stars identified as likely K-dwarfs or giants from the versus colour-magnitude diagram vary at the 0.5 mmag level on 2 h timescales, whereas no such trend is seen in stars identified as likely F or G dwarfs. In a detailed Fourier domain study of the light curves of a sample of red giants observed by CoRoT, Kallinger et al. (2009) found significantly enhanced variability on timescales of a few hours compared to the Sun, but we confirm here that this is a systematic effect, clearly visible over thousands of stars spanning a range of colours. We note this enhanced variability was expected from 3–D simulations of granulation (Freytag, 2001; Svensson & Ludwig, 2005), which indicate that granulation cell size – and hence the strength and timescale of the photometric signature of granulation – increase significantly as surface gravity decreases.
5 Conclusions
We have evaluated the noise per exposure and on 2 h timescales for the first three CoRoT observing runs lasting more than a month. We find that the photometric performance on transit timescales is close to the pre-launch specification, with a level of correlated noise at least an order of magnitude below that obtained from the ground. The observed performance is sufficient to detect transits of planets of a few Earth radii in short period ( d) orbits around bright stars.
However, there is scope for further improvement, since the noise level per exposure exceeds the photon noise by a factor 2 to 3 and the level of correlated noise, although low, is non-zero. The slight degradation of the performance from IRa01 to LRa01 indicates that the impact of hot pixels is gradually increasing, so that improving the treatment of these artifacts is becoming increasingly important.
We also show that giants – tentatively identified from the versus colour-magnitude diagram – constitute a significant fraction of the CoRoT targets (from 20% for Monoceros runs to 50% for Aquila runs). Giants are in any case less than ideal targets for transit surveys due to their large radii, but we also find that they tend to be variable at the 0.5 mmag level on transit timescales, which we interpret as a granulation effect.
Finally, one aspect which has not been touched upon here so far, but will be explored in more detail in a forthcoming paper, is the fact that the global variability levels on timescales of a day and longer (blue points in Fig. 2) are relatively high: very few CoRoT light curves have dispersions below 1 mmag on those timescales. For comparison, we measured in the same way the scatter of the total irradiance variations of the Sun from SoHO/VIRGO/PMO6 at times of minimum and maximum activity (see Aigrain et al. 2004 and references therein for details of this dataset), finding 0.07 and 0.3 mmag respectively. However, to quantify this tentative but interesting result further requires discrimination between the effects of instrumental decay, hot pixels, satellite pointing jitter and true stellar variability, which is beyond the scope of this paper.
Acknowledgements.
HD acknowledges support from grant ESP2007-65480-C02-02 of the Spanish Science and Innovation ministry, the German CoRoT team (TLS and Univ. Cologne) from DLR grants 50OW0204, 50OW0603, and 50QP0701, and SZ from the Israel Science Foundation – Adler Foundation for Space Research (grant No. 119/07).References
- Aigrain et al. (2004) Aigrain, S., Favata, F., & Gilmore, G. 2004, A&A, 414, 1139
- Aigrain & Irwin (2004) Aigrain, S. & Irwin, M. 2004, MNRAS, 350, 331
- Auvergne et al. (2009) Auvergne, M., Bodin, P., Boisnard, L., et al. 2009, A&A, in press
- Auvergne et al. (2003) Auvergne, M., Boisnard, L., Buey, J.-T. M., et al. 2003, in Proc. SPIE, ed. J. C. Blades & O. H. W. Siegmund, Vol. 4854, 170–180
- Fressin et al. (2009) Fressin, F., Pont, F., & Aigrain, S. 2009, A&A, in prep.
- Freytag (2001) Freytag, B. 2001, in Astronomical Society of the Pacific Conference Series, Vol. 223, 11th Cambridge Workshop on Cool Stars, Stellar Systems and the Sun, ed. R. J. Garcia Lopez, R. Rebolo, & M. R. Zapaterio Osorio, 785–+
- Hoaglin et al. (1983) Hoaglin, D. C., Mostellar, F., & Tukey, J. W. 1983, Understanding Robust and exoploratory data analysis (New York: John Wiley)
- Kallinger et al. (2009) Kallinger, T., Weiss, W. W., Barban, C., et al. 2009, A&A, in press
- Pinheiro da Silva et al. (2008) Pinheiro da Silva, L., Rolland, G., Lapeyrere, V., & Auvergne, M. 2008, MNRAS, 384, 1337
- Pont et al. (2009) Pont, F., Aigrain, S., & Fressin, F. 2009, A&A, in prep.
- Pont et al. (2006) Pont, F., Zucker, S., & Queloz, D. 2006, MNRAS, 373, 231
- Svensson & Ludwig (2005) Svensson, F. & Ludwig, H.-G. 2005, in ESA Special Publication, Vol. 560, 13th Cambridge Workshop on Cool Stars, Stellar Systems and the Sun, ed. F. Favata, G. A. J. Hussain, & B. Battrick, 979–+