Time-dependent absorption of very high-energy gamma-rays from the Galactic center by pair-production
Abstract
Very high energy (VHE) gamma-rays have been detected from the direction of the Galactic center. The H.E.S.S. Cherenkov telescopes have located this -ray source with a preliminary position uncertainty of 8.5” per axis (6” statistic + 6” sytematic per axis). Within the uncertainty region several possible counterpart candidates exist: the Super Massive Black Hole Sgr A∗, the Pulsar Wind Nebula candidate G359.95-0.04, the Low Mass X-Ray Binary-system J174540.0-290031, the stellar cluster IRS 13, as well as self-annihilating dark matter. It is experimentally very challenging to further improve the positional accuracy in this energy range and therefore, it may not be possible to clearly associate one of the counterpart candidates with the VHE-source. Here, we present a new method to investigate a possible link of the VHE-source with the near environment of Sgr A∗(within approximately 1000 Schwarzschild radii). This method uses the time- and energy-dependent effect of absorption of VHE -rays by pair-production (in the following named pair-eclipse) with low-energy photons of stars closely orbiting the SMBH Sgr A∗.
Keywords:
Galactic center, S-stars, absorption by pair-production, -rays:
95.10.Eg, 95.30.Cq, 95.85.Pw1 Introduction
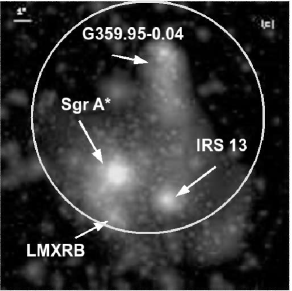
Because of its vicinity of about 8 kpc, the center of our own galaxy offers a unique possibility to study a galactic nucleus. Especially the super massive black hole (SMBH) in the center (for a recent review see e.g. Reid (2008)) and the objects in its direct neighborhood can be observed with high precision compared to distant galaxies. While the observation of the Galactic center (GC) in the optical waveband suffers strongly from obscuration by dust, it has been studied intensely at radio, infrared, X-ray and -ray wavelengths. The H.E.S.S. telescopes have detected VHE -rays from the direction of the GC in an energy range between 165 GeV and 10 TeVAharonian et al. (2006a). One of the two sources reported there, HESS J1745-290, is coincident with Sgr A* within the positional errors. Despite the unprecedented accuracy achieved, the identification with a counterpart observed at other wavelengths is difficult because the observation has a systematic positional uncertainty of 6” van Eldik et al. (2007). In this region four possible counterparts exist (see figure 1). Additionally, the VHE -rays could also originate from self-annihilating dark matter. Even with the next generations of Imaging air Cherenkov telescopes (IACT), H.E.S.S. II, MAGIC 2 or the planned CTA, with a great improvement of sensitivity, the positional accuracy (limited by systematics) will remain the same achieved today. So it stays difficult to directly identify the VHE -ray source.
Here, we present an indirect method which uses the timing signature of absorption of VHE -rays by pair-production with low-energy photons of stars orbiting the SMBH. This method is uniquely applicable to the GC because only here stars close to a SMBH are known. With this method we can investigate a possible alignment of the VHE -rays with one of the candidates, the SMBH Sgr A∗. In the first part of this paper we present the orbits of the S-stars followed by a short review of the pair-production process. Finally simulated lightcurves for present and future IACTs will be presented.
2 Stars orbiting the SMBH Sgr A∗
From observations in the near-infrared 27 stars (so called S-Stars) with a magnitude are known to move on stable Keplerian orbits very close () to Sgr A∗. Using high precision measurements with the VLT Eisenhauer et al. (2005) and the Keck telescope Ghez et al. (2005) the orbital parameters and the stellar classes Martins et al. (2008) of some of these stars were determined. Figure 2 shows the projected orbits of 7 S-stars calculated from Gillessen (2008). Beside S17, which is a late-type star, these stars are identified as early type main-sequence stars of type B. For the calculations given here, it is assumed that all stars produce a blackbody photon density at a distance ( : photon energy)
| (1) |
with a temperature of and a stellar radius of equivalent to a early type spectral class (being the mean value for S2 Martins et al. (2008)). The factor is a dilution factor to take into account the decrease with the distance (see figure 3). Equation 1 is of course only valid for which is the case here ( compared to ).

| S2 | S8 | S14 | |
| Orbital period [years] | |||
| Minimal distance to | |||
| Sgr A∗ [mas] | |||
| Time | |||
| Minimal distance to | |||
| line of sight [mas] | |||
| Maximal Absorption | |||
| Time |
Table 1 shows some parameters of selected S-stars. The values of the minimal distance and the minimal distance to the line of sight were derived from the orbital parameters. The estimated uncertainties on the distances are in the order of .
3 Absorption by pair-production

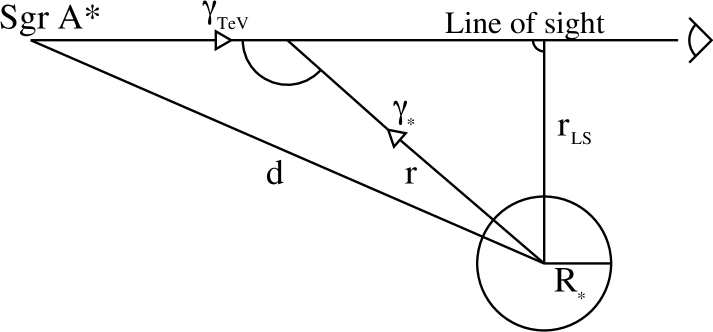
A schematic view of the underlying geometry assumed is shown in figure 3. A -ray propagating from Sgr A∗ interacts with a low-energy photon from the S-star under an angle . The relative position of the line of sight (LoS) is defined by the distance .
The process of pair-production () of two photons with energy and is well studied Gould and Schréder (1967). The cross-section is given by equation (2) with an energy threshold of .
| (2) | ||||
In order to exactly calculate the optical depth for a -ray from Sgr A∗ with the low-energy photons from the S-star one has to integrate over the line of sight, the surface of the star and the energy of the low-energy photon. Here we use the point-source approximation for the star emitting the low energy photons, reducing the calculation to a double integral Dubus (2006):
| (3) |
For this is an appropriate approximation. Also the integration along the LoS is changed to an integration over the angle from 0 (photons are parallel) to a maximal angle derived from the distance from Sgr A∗ to the star. The absorption is strongly energy dependent with a maximum at about 200 GeV for the assumed photon density. The distance is derived from the orbital parameters. The resulting optical depth is time dependent because the photon density changes with the star moving along the orbit. Figure 4 shows the result of the calculation for the S-stars. In Table 1 the values for the maximal absorption effect are shown. The error on the absorption from the orbital uncertainties are under investigation. Additionally, the uncertainty on the spectral class of the star, as well as the relative positional uncertainty of the radio position of Sgr A∗( Gillessen (2008)) will lead to an even higher error for . Only for the stars S2, S8 and S14 the absorption effect is and the largest absorption is seen for S14 as expected ().


4 Simulation of lightcurves
| H.E.S.S. | H.E.S.S. II | CTA | |
|---|---|---|---|
| [Hz] | [Hz] | [Hz] | |
| 0.1-0.3 TeV | |||
| energy band | |||
| 3-10 TeV | |||
| energy band |
The flux modulation due to the absorption is very likely in the range ¡10% (based on the estimates of the underlying uncertainties) for a VHE -ray origin in the SMBH. Current limits on variability Aharonian et al. (2006a) from the GC are not sufficient to put a meaningful constraint on the GC origin of the VHE -ray emission. In order to investigate the potential for discovering the signature of pair eclipses, we simulate the measured lightcurve for future ground based installations like H.E.S.S. II and CTA. For completeness, we also simulated the expected H.E.S.S. lightcurve. The simulations shown here are for the star S14 which is the candidate with the largest absorption effect. To simulate the lightcurves we first derived the expected photon rate (equation (4)) for two energy bands (low: to , high: to ).
| (4) |
The parts of this equation are the following:
Table 2 shows the derived photon rates for the three IACT configurations. The values given there are without absorption. The derived values are then Gaussian distributed within the error (the expected number of photons in each energy bin is sufficently large to justify Gaussian errors). Every lightcurve is integrated over one month taking into account the theoretically possible observation time for the Galactic Center (at the H.E.S.S. site in Namibia). Figure 5 and 6 show the result of the simulation for the three different telescopes configurations. In the lower energy band the absorption has its maximum while in the higher band almost no absorption is expected. The higher band can be used to eliminate to first order all systematic effects which could mimic variability. For H.E.S.S. and H.E.S.S. II it is not possible to determine the absorption feature within the errors. A large telescope array, like CTA, should be able to measure the effect.
5 Conclusions
We have shown that some S-stars in the vicinity of Sgr A∗ are getting close enough to the line of sight to cause a notable absorption effect. The absorption leads to a dimming of the measured VHE -ray flux at energies between 100 GeV to 300 GeV. We presented simulations of lightcurves for present and future IACTs. The current generation of IACTs is not sensitive enough to detect the effect, but the required sensitivity will be achieved with high count-rate experiments ( Hz) with large collection areas, like CTA. If this time- and energy-dependent feature can be measured in the spectrum of the TeV-emission from the GC, then it is possible to limit the origin of the VHE -rays to the direct vicinity of Sgr A∗(within approximately 1000 Schwarzschild radii).
References
- Reid (2008) M. J. Reid, ArXiv e-prints 808 (2008), 0808.2624.
- Aharonian et al. (2006a) F. Aharonian, A. G. Akhperjanian, A. R. Bazer-Bachi, et al., Nature 439, 695–698 (2006a).
- van Eldik et al. (2007) C. van Eldik, O. Bolz, I. Braun, G. Hermann, J. Hinton, and W. Hofmann, ArXiv e-prints 0709.3729 (2007).
- Wang et al. (2006) Q. D. Wang, F. J. Lu, and E. V. Gotthelf, MNRAS 367, 937–944 (2006).
- Eisenhauer et al. (2005) F. Eisenhauer, R. Genzel, T. Alexander, R. Abuter, and T. Paumard, ApJ 628, 246–259 (2005).
- Ghez et al. (2005) A. M. Ghez, S. Salim, S. D. Hornstein, A. Tanner, J. R. Lu, M. Morris, E. E. Becklin, and G. Duchêne, ApJ 620, 744–757 (2005).
- Martins et al. (2008) F. Martins, S. Gillessen, F. Eisenhauer, R. Genzel, T. Ott, and S. Trippe, ApJ 672, L119–L122 (2008).
- Gillessen (2008) S. Gillessen, submitted (2008).
- Gould and Schréder (1967) R. J. Gould, and G. P. Schréder, Physical Review 155, 1404–1407 (1967).
- Dubus (2006) G. Dubus, A&A 451, 9–18 (2006).
- Aharonian et al. (2006b) F. Aharonian, A. G. Akhperjanian, A. R. Bazer-Bachi, et al., A&A 457, 899–915 (2006b).
- Punch (2005) M. Punch for the HESS Coll., in Towards a network of Atmospheric Cherenkov Detectors VII Palaiseau, 2005.
- Aharonian et al. (2006c) F. Aharonian, A. G. Akhperjanian, A. R. Bazer-Bachi, et al., Physical Review Letters 97, 22 (2006c).