11email: vvh@astro.uni-jena.de 22institutetext: Max-Planck-Institut für extraterrestrische Physik, Giessenbachstrasse, D–85741 Garching, Germany 33institutetext: Astrophysikalisches Institut Potsdam, An der Sternwarte 16, D-14482 Potsdam, Germany
XMM-Newton RGS spectrum of RX J0720.43125:
An absorption feature at 0.57 keV††thanks: Based on observations obtained with
XMM-Newton, an ESA science mission with instruments and contributions directly funded by ESA Member States and NASA
Abstract
Aims. By measuring the gravitational redshift of spectral features in the spectrum of thermal radiation emitted from neutron stars, useful constraints for the equation of state of superdense matter can be obtained via an estimate of the mass-to-radius ratio. We searched for spectral line features in the high-resolution X-ray spectrum of the isolated neutron star RX J0720.43125.
Methods. Our target was observed by XMM-Newton on many occasions. We used the XMM-Newton SAS task rgscombine in order to create a co-added RGS spectrum of RX J0720.43125. We modeled the resulting spectrum with absorbed blackbody radiation with a Gaussian absorption features using the XSPEC package.
Results. We found a narrow absorption feature at 0.57 keV in the co-added RGS spectrum of the isolated neutron star RX J0720.43125 with an equivalent width of eV and FWHM eV. The feature was identified with an absorption line of highly ionized oxygen O VII, most probably originating in the ambient medium of RX J0720.43125. An extensive investigation with the photo-ionization code CLOUDY indicates the possibility that the optical flux excess observed in the spectrum of RX J0720.43125 at least partially originates in a relatively dense (e.g. ) slab, located in the vicinity of the neutron star (e.g. ).
Key Words.:
RX J0720.4-3125–Isolated neutron stars – spectrum – ISM1 Introduction
The study of thermally emitting and radio-quiet, nearby, isolated neutron stars (INSs) may allow an important input to our understanding of neutron stars. In particular, measuring the gravitational redshift of a spectral feature in the spectrum of thermal radiation emitted from the neutron star surface (atmosphere) may provide a useful constraint for various equations of state for superdense matter. Independent of the estimate of the neutron star radius (e.g. Trümper et al. 2004) from the thermal spectrum of an INS, it will also allow us to directly estimate the mass-to-radius ratio. RX J0720.43125, originally discovered as a soft X-ray source during the ROSAT All-Sky Survey by Haberl et al. (1997), is a special case among the INS. Clear spectral variations on times scales of years were detected during XMM-Newton observations in the data of the high spectral resolution Reflection Grating Spectrometers (RGS) (de Vries et al. 2004) and the imaging-spectroscopic instrument EPIC pn (Haberl et al. 2006). However, during individual RGS observations the number of counts received from RX J0720.43125 in a single resolution element were not enough to study the spectrum in detail.
From this point of view, it is interesting to study a co-added XMM-Newton RGS spectrum of RX J0720.43125, despite of the spectral variations shown by the INS.
2 Observations and data reduction
RX J0720.43125 has been observed many times by XMM-Newton (Hohle et al. 2009) and we focus here on the data collected with RGS (den Herder et al. 2001) from the 14 publicly available observations, in total presenting about 500 ks of effective exposure time.
| Obs. ID | Obs. Date Start | Exposure | Effective exposure |
|---|---|---|---|
| JD - 2400000 | ksec | ksec | |
| 0124100101 | 51678.1503935 | 65.87 | 15.45 |
| 0132520301 | 51870.2714931 | 30.91 | 30.24 |
| 0156960201 | 52585.2443171 | 30.24 | 29.60 |
| 0156960401 | 52587.3090509 | 32.04 | 31.03 |
| 0158360201 | 52762.0499190 | 81.63 | 73.43 |
| 0161960201 | 52940.2405093 | 44.92 | 44.67 |
| 0164560501 | 53147.9273380 | 51.95 | 44.36 |
| 0300520201 | 53488.8618634 | 53.31 | 50.69 |
| 0300520301 | 53636.4891551 | 53.01 | 51.38 |
| 0311590101 | 53687.4349306 | 39.71 | 38.91 |
| 0400140301 | 53877.6977662 | 21.91 | 21.57 |
| 0400140401 | 54044.9718634 | 21.91 | 21.69 |
| 0502710201 | 54226.2093171 | 21.91 | 21.57 |
| 0502710301 | 54421.7184259 | 24.92 | 24.59 |
The data were reduced using standard threads from the XMM-Newton data analysis package SAS version 8.0.1. We reprocessed all publicly available data (see Table 1) with the standard metatask rgsproc with the aim to co-add the spectra with the task rgscombine. To determine good time intervals free of background flares, we used the filtering expression ‘rate 1.0’ on the background light curves. This reduced the total exposure time by 13%. First order source and background spectra were produced from the cleaned events. A model background spectrum was also generated with the task rgsbkgmodel that also was used for the background correction as an additional check for possible phenomena related to background variations seen during some of the observations. No significant differences between RGS spectra reduced in these two different ways were seen.
The background subtracted co-added spectra of RX J0720.43125 revealed the existence of a relatively narrow absorption-like feature at 0.57 keV. No sharp variation is present in the spectral response of the instrument, indicating an astronomical origin. A similar narrow absorption feature was reported in the XMM-Newton RGS spectrum of another INS RX J1605.3+3249 at 0.576 keV by van Kerkwijk et al. (2004).
We fitted the resulting co-added RGS1111The RGS2 spectrum was used only for consistency checks; in the energy range of 0.5-0.59 keV it has a significantly reduced effective area owing to the failure of CCD4 in September 2000, see XMM-Newton Users Handbook spectrum of RX J0720.43125 (see Fig. 1) using the XSPEC package version 12.5.0. We fitted an absorbed blackbody model with a broad (0.08 keV) Gaussian absorption feature at 0.3 keV, well known from XMM-Newton EPIC pn spectral studies (Haberl 2007).
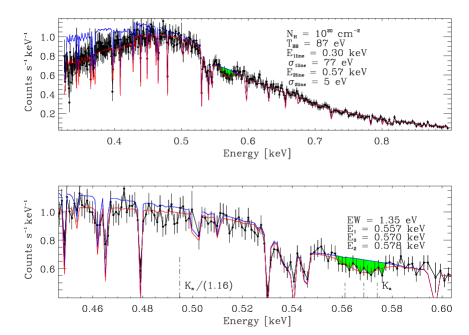
Another additive Gaussian absorption component was used to fit the feature at 0.57 keV. We used this model to estimate the equivalent width of the detected absorption feature at 0.57 keV. As the continuum level the absorbed blackbody model including the broad Gaussian line in absorption was used. With different levels (normalizations) of continuum and absorption lines an error of the equivalent width was determined. Results of the fit and equivalent width estimates are presented in Fig. 1.
As already mentioned, RX J0720.43125 showed spectral variations, first noticed from the comparison of RGS spectra observed at different epochs (de Vries et al. 2004). After the detection of the absorption feature at 0.57 keV in the co-added RGS spectrum of RX J0720.43125, we examined its behavior over time. We divided all publicly available observations into three groups from different epochs. In the first group, we combined the RGS spectra of RX J0720.43125 from the year 2000 (ObsIds 0124100101 and 0132520301), for the second group the spectra between Nov. 2002 and May 2003 (0156960201, 0156960401 and 0158360201, and in the third group, the spectra from Oct. 2003 to Nov. 2007. This devision was inferred from our recent study on the nature of global variations observed from RX J0720.43125 (Hohle et al. 2009) which was mainly based on the analysis of the EPIC pn data. In this way the variations in the blackbody temperature and the depth of the broad absorption feature in the spectra within each group of observations (see, Fig. 7, Hohle et al. 2009) are kept to a minimum and below the sensitivity of the RGS instrument. The results of this analysis are presented in Fig.2. It shows a tendency for a reciprocal dependence of the measured equivalent width on the derived blackbody temperature. To decide whether this is due to pure flux (blackbody temperature) variations or to changes in the number of atoms in the line of sight, we fitted the three data sets with linked parameters of absorption features and the blackbody temperature was left free. The estimated equivalent widths are consistent with the variations when parameters of the narrow absorption feature were left free (Fig. 2). However, this needs confirmation with higher S/N ratio data sets.

3 Discussion
We report the detection of an absorption line at 0.57 keV in the XMM-Newton RGS spectra of RX J0720.43125. Since there is no uncalibrated instrumental feature in the energy range of 0.55059 keV (2122.5Å), this line is clearly of astronomical origin. Whether it originates at the surface (atmosphere) of the neutron star, in its vicinity or in the interstellar medium is not clear a priori.
According to the atomic database ATOMDB222http://cxc.harvard.edu/atomdb, a few relatively strong spectral lines are expected in the energy range of 0.561.0 keV (with a typical value of gravitional redshift of INS ) from plasma with a temperature of K, mainly belonging to highly ionized oxygen (O VII, O VIII) and neon (Ne IX). Among them the O VII resonance Kα spectral line at 0.574 keV has a maximal intensity and is compatible with our detection without any significant redshift. It is likely that the absorption feature consists of a number of blended absorption lines. However, given the data quality (i.e., spectral resolution and S/N ratio) it is difficult to identify all of them.
Moreover, similar absorption features were detected in high-resolution X-ray spectra of other galactic and extragalactic sources (but not in all cases333Futamoto et al. (2004) did not detect the absorption line of O VII in the spectrum of Cyg X-2. According to Yao & Wang (2005), 3 of 10 Galactic low-mass X-ray binaries show absorption of O VII and/or O VIII. see, eg., Futamoto et al. (2004), Nicastro et al. (2005), Yao & Wang (2005), Fang et al. (2006), Bregman & Lloyd-Davies (2007)). This, as well as its relatively narrow nature (Chang et al. 2006; Paerels 1997), make it more plausible that it originates in the circumstellar/interstellar medium along the line of sight towards RX J0720.43125. Indeed, the estimates of strength of the magnetic field of B G (from dipole braking) and B G (proton-cyclotron absorption feature) of RX J0720.43125 predict 20–60eV broadening of spectral features originating in the magnetized atmosphere of the INS (Paerels 1997). Nevertheless, with a gravitational redshift of INS of 0.16, a strong lines of O VIII at 0.653 keV are expected at 0.56 keV. In this case the O VII resonance Kα spectral line from the INS atmosphere is expected at 0.49 keV. A very faint absorption feature is present in the spectrum of RX J0720.43125(Fig. 1). However, given the fitted blackbody temperature ( 1MK) and the magnetic field strength (significantly increasing the binding energy of atoms) of RX J0720.43125, it is quite difficult to reconcile the presence of significant number of O VIII or other ions (e.g., Ne IX, with higher excitation temperature) in the atmosphere of RX J0720.43125.
If the detected absorption line has an origin in the circumstellar/interstellar medium, it may be identified with the highly ionized oxygen O VII. Indeed, according to the atomic database (ATOMDB) the strongest laboratory-measured spectral lines from O VII in the energy range 0.550.59 keV are: 0.5611, 0.5686 and 0.5740 keV. However, the first two spectral lines are forbidden and only in specific conditions (density 1010 cm-3, as well as temperature MK of “hybrid plasma”, i.e. photo-ionized and collisionally excited) may have a comparable intensity to the Kαresonance line (Porquet & Dubau 2000, see their Fig.11). Therefore, these two lines also may be excluded from further consideration, unless there is evidence of the presence of nearby, very high-density plasma of RX J0720.43125.
From the measured value of the equivalent width eV of the spectral line of O VII we estimate the number of ions (column density, NOVII) in the direction of RX J0720.43125 in two different ways. First, using the dependence of the equivalent width of the absorption feature on the column density of O VII (Futamoto et al. 2004), we estimated a lower limit of log N in the direction of RX J0720.43125.
Second, we arrive at similar results, log N, using the general relationship between measured equivalent width and number of atoms in the line of sight, , where f is the oscillator strength of the O VII Kαline (ATOMDB) and Nj is the column density (Spitzer 1978).
On the other hand, from the the average444Average nH hot gas density estimated in the direction of 7 low-mass X-ray binaries (Yao & Wang (2005)), assuming oxygen abundance relative to hydrogen (Anders & Grevesse 1989) and an ionic fraction of O VII 1 (see, Fig. 3). and the distance to RX J0720.43125 ( pc, Kaplan et al. 2007) one obtains a value of 15.015.7 cm-2 for log N. Moreover, using a very recent estimate of the spatial density of the hot gas on the Galactic plane ( ,Yao et al. (2009)) based on Suzaku observations, we have the value of 14.015.3 cm-2 for log NOxygen in the direction of RX J0720.43125.
This difference may be due to the origin of the absorption lines in the immediate, ambient environment of the INS. If the absorption feature at 0.57 keV originates in the ionized plasma near the INS and belongs to highly ionized O VII, then the presence of the absorption line itself may constrain the possible location (separation from RX J0720.43125) of the ionized cloud. Indeed, according to Tarter et al. (1969), if the plasma is located at a distance of from RX J0720.43125, the ionization parameter is strongly determined by the luminosity of . If so, oxygen will be fully photo-ionized at a distance (Kallman & McCray 1982, see, also Fig. 3).
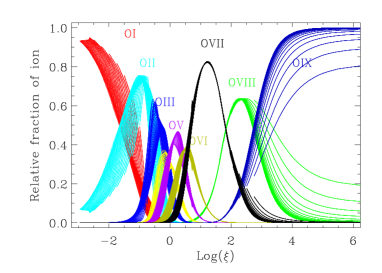
Moreover, in order to have a sufficient amount of O VII ions near a thermally emitting ionizing source with temperature and X-ray luminosity of , for the ionizing parameter the condition should be satisfied (Fig. 3). This means that a cloud/slab with rather high density (eg. ) must be located within a distance of from the ionizing source.
On the other hand, the hydrogen column density must be cm-2 (from the EPIC pn spectroscopy), ie. assuming oxygen abundance relative to the hydrogen (Anders & Grevesse 1989), we obtain for oxygen a total column density cm-2.
Given the abovementioned general restrictions, a photo-ionized plasma associated with RX J0720.43125 may contribute to the observed fluxes in the UV and optical bands.
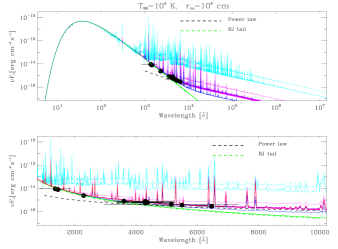
The optical and ultraviolet fluxes observed from rather faint, optical counterparts of thermally emitting INSs, in general, lie a factor of 10 above the extrapolated blackbody spectrum in X-rays (e.g. Kaplan 2008), the so-called “optical excess”. In the case of RX J1856.43754, the optical/UV spectrum is consistent with the slope of a Rayleigh-Jeans tail (van Kerkwijk & Kulkarni 2001; Burwitz et al. 2003), while for RX J0720.43125 there is a deviation and an additional power-law component was necessary to fit the data (Kaplan et al. 2003).
In order to estimate the contribution from a photo-ionized plasma near an INS, as mentioned above, we have used the widespread photoionization code CLOUDY (calculations were performed with version 07.02.02 of Cloudy, as described by Ferland et al. 1998). Despite the restrictions (luminosity of the ionizing source, ionization parameter, ie. a combination of location of the cloud relative to the source and spatial density of the medium) there are still a number of free parameters for input to the CLOUDY code: Covering factor555The covering factor is the fraction of 4 covered by gas, as viewed from an ionizing source, ie. . For details, see Ferland et al. (1998), CLOUDY documents (open or closed geometry), chemical abundances, filling factor, turbulence, etc.
Nevertheless, as shown by our simulations, in principle, the existence of a small, relatively dense ambient medium (e.g. , covering factor , located at the distance of from INS, see Fig 4), may at least partially explain the enigmatic “optical excess” observed at RX J0720.43125 (Motch et al. 2003; Kaplan et al. 2003) and provide sufficient O VII ions.
The satisfactory fit to the observed “optical excess” was not unique and may also be provided with other sets of parameters.
A partial origin of the absorption feature in the local, interstellar hot medium (e.g. Local Bubble) cannot be excluded completely. However, the non-detection of the absorption feature in other cases 666The absorption feature is absent in the co-added RGS spectrum of RX J1856.4-3754 ( pc (van Kerkwijk & Kaplan 2007), but clearly seen in the co-added spectra of RBS1223 and RX J1605.3+3249 with lower significance (see, http://xmm.esac.esa.int/BiRD) beyond the Local Bubble (for other objects, see, Yao & Wang (2005), Fang et al. (2006), Bregman & Lloyd-Davies (2007)) makes the proposition of the origin of the absorption feature mainly in the ambient medium of RX J0720-3125 more likely.
4 Conclusions
-
1.
An absorption feature at 0.57 keV is clearly detected in the co-added XMM-Newton RGS spectrum of RX J0720.43125. The detected absorption feature likely is a blend.
-
2.
Most probably, it originates mainly in the ambient medium of RX J0720.43125 and may be identified with highly ionized oxygen (O VII), consisting of Doppler shifted components. Neither an interstellar nor an atmospheric, partial origin can be excluded completely.
-
3.
The observed optical/UV flux excess of RX J0720.43125 compared to the extrapolated X-ray blackbody radiation partially may be caused by emergent emission of a nearby, relatively dense photo-ionized cloud.
Further investigation, in particular simultaneous X-ray and optical short-term variations could shed some light on the nature of this enigmatic object.
Acknowledgements.
VH and MMH acknowledge support by the German Deutsche Forschungsgemeinschaft (DFG) through project C7 of SFB/TR 7 “Gravitationswellenastronomie”. We thank the anonymous referee for very important comments and discussion.References
- Anders & Grevesse (1989) Anders, E. & Grevesse, N. 1989, Geochim. Cosmochim. Acta., 53, 197
- Bregman & Lloyd-Davies (2007) Bregman, J. N. & Lloyd-Davies, E. J. 2007, ApJ, 669, 990
- Burwitz et al. (2003) Burwitz, V., Haberl, F., Neuhäuser, R., et al. 2003, A&A, 399, 1109
- Chang et al. (2006) Chang, P., Morsink, S., Bildsten, L., & Wasserman, I. 2006, ApJ, 636, L117
- de Vries et al. (2004) de Vries, C. P., Vink, J., Méndez, M., & Verbunt, F. 2004, A&A, 415, L31
- den Herder et al. (2001) den Herder, J. W., Brinkman, A. C., Kahn, S. M., et al. 2001, A&A, 365, L7
- Eisenbeiss et al. (2009) Eisenbeiss, T., Ginski, C., Hohle, M., et al. 2009, A&A, submitted
- Fang et al. (2006) Fang, T., Mckee, C. F., Canizares, C. R., & Wolfire, M. 2006, ApJ, 644, 174
- Ferland et al. (1998) Ferland, G. J., Korista, K. T., Verner, D. A., et al. 1998, PASP, 110, 761
- Futamoto et al. (2004) Futamoto, K., Mitsuda, K., Takei, Y., Fujimoto, R., & Yamasaki, N. Y. 2004, ApJ, 605, 793
- Haberl (2007) Haberl, F. 2007, Ap&SS, 308, 181
- Haberl et al. (1997) Haberl, F., Motch, C., Buckley, D. A. H., Zickgraf, F.-J., & Pietsch, W. 1997, A&A, 326, 662
- Haberl et al. (2006) Haberl, F., Turolla, R., de Vries, C. P., et al. 2006, A&A, 451, L17
- Hohle et al. (2009) Hohle, M., Haberl, F., Vink, J., et al. 2009, A&A, in press.
- Kallman & McCray (1982) Kallman, T. R. & McCray, R. 1982, ApJS, 50, 263
- Kaplan (2008) Kaplan, D. L. 2008, in American Institute of Physics Conference Series, Vol. 983, 40 Years of Pulsars: Millisecond Pulsars, Magnetars and More, ed. C. Bassa, Z. Wang, A. Cumming, & V. M. Kaspi, 331–339
- Kaplan et al. (2007) Kaplan, D. L., van Kerkwijk, M. H., & Anderson, J. 2007, ApJ, 660, 1428
- Kaplan et al. (2003) Kaplan, D. L., van Kerkwijk, M. H., Marshall, H. L., et al. 2003, ApJ, 590, 1008
- Kulkarni & van Kerkwijk (1998) Kulkarni, S. R. & van Kerkwijk, M. H. 1998, ApJ, 507, L49
- Motch et al. (2003) Motch, C., Zavlin, V. E., & Haberl, F. 2003, A&A, 408, 323
- Nicastro et al. (2005) Nicastro, F., Mathur, S., Elvis, M., et al. 2005, ApJ, 629, 700
- Paerels (1997) Paerels, F. 1997, ApJ, 476, L47+
- Porquet & Dubau (2000) Porquet, D. & Dubau, J. 2000, A&AS, 143, 495
- Spitzer (1978) Spitzer, L. 1978, Physical processes in the interstellar medium (New York Wiley-Interscience, 1978. 333 p.)
- Tarter et al. (1969) Tarter, C. B., Tucker, W. H., & Salpeter, E. E. 1969, ApJ, 156, 943
- Trümper et al. (2004) Trümper, J. E., Burwitz, V., Haberl, F., & Zavlin, V. E. 2004, Nuclear Physics B Proceedings Supplements, 132, 560
- van Kerkwijk & Kaplan (2007) van Kerkwijk, M. H. & Kaplan, D. L. 2007, Ap&SS, 308, 191
- van Kerkwijk et al. (2004) van Kerkwijk, M. H., Kaplan, D. L., Durant, M., Kulkarni, S. R., & Paerels, F. 2004, ApJ, 608, 432
- van Kerkwijk & Kulkarni (2001) van Kerkwijk, M. H. & Kulkarni, S. R. 2001, A&A, 378, 986
- Yao & Wang (2005) Yao, Y. & Wang, Q. D. 2005, ApJ, 624, 751
- Yao et al. (2009) Yao, Y., Wang, Q. D., Hagihara, T., et al. 2009, ApJ, 690, 143