Thermal and Transport Behavior of Single Crystalline R2CoGa8
(R = Gd, Tb, Dy, Ho, Er, Tm, Lu and Y) Compounds
Abstract
The anisotropy in electrical transport and thermal behavior of single crystalline R2CoGa8 series of compounds is presented. These compounds crystallize in a tetragonal structure with space gropup P4/mmm. The nonmagnetic counterparts of the series namely Y2CoGa8 and Lu2CoGa8show a behavior consistent with the low density of states at the fermi level. In Y2CoGa8, a possibility of charge density wave transition is observed at 30 K. Gd2CoGa8 and Er2CoGa8 show a presence of short range correlation above the magnetic ordering temperature of the compound. In case of Gd2CoGa8, the magnetoresistance exhibits a significant anisotropy for current parallel to [100] and [001] directions. Compounds with other magnetic rare earths (R = Tb, Dy, Ho and Tm) show the normal expected magnetic behavior whereas Dy2CoGa8 exhibits the possibility of charge density wave (CDW) transition at approximately same temperature as that of Y2CoGa8. The thermal property of these compounds is analysed on the basis of crystalline electric field (CEF) calculations.
pacs:
71.20.Eh, 71.70.Ch, 72.15.Eb, 73.43.Qt, 74.25.Ha and 75.50.EeI INTRODUCTION
Recently we reported the magnetic properties of single crystalline R2CoGa8 series of compounds, inferred from the thermal and field dependence of magnetization Devang (1). These compounds form only with the heavy rare earths (R = Gd to Lu), in contrast to the iso-structural indides R2CoIn8Devang1 (2) where the phase forms for all the rare earths except for La, Yb and Lu. Y2CoGa8 and Lu2CoGa8 show diamagnetic behavior pointing out a relatively low density of states at the Fermi level. R2CoGa8 with magnetic rare earths order antiferromagnetically at low temperatures with the highest Nel temperature TN = 28 K in Tb2CoGa8. The magnetic ordering temperatures are less compared to their corresponding indides. The easy axis of magnetization for Tb2CoGa8, Dy2CoGa8 and Ho2CoGa8 was found to be along the [001] direction whereas for Er2CoGa8 and Tm2CoGa8 the easy axis changes to the basal plane namely (100). Gd2CoGa8 having the S-state ion Gd3+ was found to show isotropic magnetic behavior. A point charge model calculation of the crystal electric field (CEF) effects gave a qualitative explanation of the magnetocrystalline anisotropy in this series of compounds and the appreciable deviation of the ordering temperatures in Tb2CoGa8 and Dy2CoGa8 from that expected on the basis of de-Gennes scaling. The aim of the present paper is to investigate in detail the heat capacity and electrical transport properties of R2CoGa8 compounds to get more information about the crystal electric field effects, Schottky contribution to the heat capacity, entropy associated with the magnetic ordering, etc. The magnetoresistivity was also studied keeping in mind the anomalously high magnetoresistance (2700 % at 2 K) of Tb2CoIn8Devang1 (2).
II EXPERIMENTAL
Single crystals of R2CoGa8 compounds were grown using Ga flux as described elsewhereDevang (1). An energy dispersive X-ray analysis (EDAX) was performed on all the obtained single crystals to estimate the actual crystal composition. The EDAX results confirmed the crystals to be of the stoichiometric composition 2:1:8. To check for the phase purity, powder x-ray diffraction pattern of all the compounds were recorded by powdering a few small pieces of single crystal followed by the Rietveld analysis of the obtained pattern. For the anisotropic transport measurements, the single crystals were oriented along the principle directions viz., [100] and [001] by Laue back reflection method. The crystals were cut to the required size for resistivity and heat capacity measurements using a spark erosion wire cutting machine. The heat capacity, resistivity and magnetoresistance measurements were performed using physical property measurement system (PPMS - Quantum Design). The AC susceptibility of Gd2CoGa8 and Tb2CoGa8 was also measured in MPMS - Qunatum Design.
III Results and Discussion
III.1 Y2CoGa8 and Lu2CoGa8
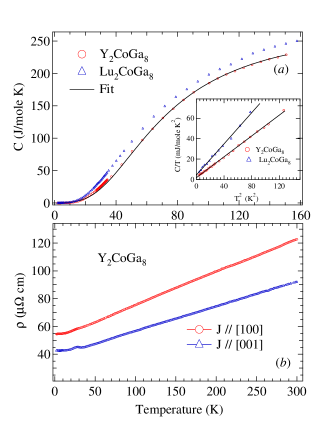
We first present the data on Y2CoGa8 and Lu2CoGa8, which are the nonmagnetic analogs of the R2CoGa8 compounds, Co being non-magnetic in this family of compounds. As mentioned above Y2CoGa8 and Lu2CoGa8 show diamagnetic behavior, in contrast to the indide Y2CoIn8Devang1 (2), which is Pauli-paramagnetic. The diamagnetic contribution arises from the filled electronic shells, which dominate a modest Pauli-paramagnetic contribution arising from a low density of the conduction electron states at the Fermi level . The evidence for low comes from the low temperature (1.8 to 10 K) heat capacity data which furnish values of 2 and 4 mJ/mole K2 for Y2CoGa8 and Lu2CoGa8 respectively (Fig. 1a inset). These values are low in comparison to the corresponding indide Y2CoIn8 (12 mJ/mole-K2). An estimate of the density of states at the Fermi level is obtained using the free electron relation
| (1) |
where is the Boltzmann constant. Substituting the value of = 2 mJ/mole-K2, the density of states in Y2CoGa8, for example, is found to be 1.6 x 1035 erg-1mole-1 or 5.8 Ry-1atom-1.
This value, for example, is comparable to that obtained in the diamagnetic compound YPd3Koenig (3) from band structure calculations. In the free electron approximation and the Pauli susceptibility are related by the relation: . For Y2CoGa8 and Lu2CoGa8 the gamma values furnish less than emu/mol. On the other hand using the relation for diamagnetic contribution Z, where Z is the atomic number, we infer values of and emu/mole for Y and Lu compounds, respectively, which in absolute magnitude are higher than . Replacing indium fully by gallium results in the appearence of diamagnetism. Since the valency of both In and Ga is same (both of them have one extra p electron), it is possible that shrinking of the unit cell in gallides results in shifting of the Fermi level to a region of low density of states.
From the slope of plots (inset Fig. 1a) we infer the lattice heat capacity coefficient as 0.501 and 0.782 in Y2CoGa8 and Lu2CoGa8, respectively. Using the relation of the Debye model , where is in the units of and is the Debye temperature, we obtain = 349 and 301 K in Y2CoGa8 and Lu2CoGa8, respectively. Based on the Debye approximationHofmann (6),
| (2) |
the ratio of the Debye temperatures is 1.16 in fair agreement with the r.h.s value of 1.4.
The main panel of Fig. 1 shows the heat capacity of Lu2CoGa8and Y2CoGa8 from 1.8 to 160 K. The heat capacity curve for Y2CoGa8was fitted to the equation
| (3) |
where the two terms represents the electronic and phononic contributions, respectively. CPh can be written in terms of Debye integral as
| (4) |
where = , is the number of atoms in the formula unit and is the Debye temperature. Here was fixed to the values derived above and = 11. The best fit shown by solid line in Fig. 1 is obtained with = 291 K. This value of is lower than that derived above, which may be due to the variation of with temperature. Around 30 K the fit for Y2CoGa8 is relatively poor for which a possible reason is mentioned below.
Fig. 1(b) shows the resistivity curves for the Y2CoGa8 compound with current (J) parallel to the crystallographic directions [100] and [001], respectively. Along both the directions the temperature dependent resistivity demonstrates a metallic behavior, the resistivity decreases linearly at high temperatures followed by a nearly temperature independent behavior below 15 K. The observed behavior is in tune with the phonon-induced scattering of the charge carriers expected in a non-magnetic compound. There occurs a hump between 20 and 35 K which is more prominent along [001] direction. A similar hump was also found in polycrystalline Y2CoIn8Devang1 (2). Such a hump in the resistivity of a nonmagnetic compound is rarely seen and may arise due to a charge density wave induced formation of an anisotropic energy gap in the Fermi surface. Similar behavior is also seen in case of 2H-NbSe2, Nb3Te4, 2H-TaSe2, NbSe3, ZrTe3, LaAgSb2, etcSekine (7, 5, 4, 8, 9). The absence of hysteresis in resistivity indicates a second order nature of the proposed charge density wave transition. The prominent effect along the [001] may be due to a larger gap along this direction. The deviation of the fit based on the Debye formula to the heat capacity around 30 K (Fig. 1(a)) may also be due to the same effect. The resistivity along [001] direction is found to be lower compared to the in-plane [100] resistivity. The similar anisotropic behavior in the resistivity was found for all the compounds described below and may arise due to the inherent structural anisotropy of the compound. The residual resistivity along [100] and [001] directions is 42 and 54 respectively. Overall, the resistivity values are higher compared to corresponding polycrystalline indide Y2CoIn8Devang1 (2). It may be due to the low density of states at the Fermi level in Y2CoGa8. A similar observation on Lu2CoGa8 would have strengthened our conjucture but single crystals of Lu2CoGa8 were too small for resistivity measurements.
III.2 Gd2CoGa8
The results on Gd2CoGa8 are presented next as Gd is an S-state ion and the CEF effects are negligible in the first order approximation. Fig. 2(a) shows the temperature dependence of resistivity for Gd2CoGa8 with current parallel to [100] and [001] directions, respectively. The inset shows the expanded low temperature part below 37 K. The resistivity shows a metallic behavior with temperature down to 35 K. Similar to Y2CoGa8 the resistivity with current along [100] direction is higher than along [001]. Below 35 K the resistivity with current parallel to [100] levels off followed by a minor kink at TN = 20 K and then it drops almost linearly down to 2 K. The upward kink at TN can be attributed to a small gap introduced in the Fermi surface due to the magnetic super-zone effectElliot (11). The resistivity with current along [001] direction shows an apparently anomalous behavior. It increases below 35 K in the paramagnetic region well above the ordering temperature followed by a sharp increase at TN and then decreases at low temperatures. The decrease is not as sharp as expected from the loss in spin disorder resistivity but tends to fall slowly. The sharp rise at TN is due to the dominant super-zone gap effect along [001]. The rise in resistivity in the paramagnetic state as the temperature approaches TN, is most likely due to the short range antiferromagnetic correlations Balberg (13, 12). It has been shown theoretically that the temperature derivative of resistivity has a negative divergence as TN is approached from the paramagnetic regime due to the large angle scattering and the divergence in the spin-spin correlation function at Nel temperature Suezaki (12) and in reality it is the life time of the anomalous fluctuation is masked by the energy transfer from the conduction electrons resulting in the increase in the resistivity of the compound. Some antiferromagnetic compounds are known to show similar behavior; for example: Tb Meaden (14), (RPd3)8Al (R = Tb and Gd) Surjeet Singh (15), UNiAl Sechovsky (16). When a magnetic field of 30 kOe is applied along the [100] direction, the upturn in the resistivity in the paramagnetic state between K and TN is partially suppressed as shown in the inset of Fig. 2(a). The suppression of the upturn in resistivity with field supports the short range antiferromagnetic correlation in the compound along the [001] axis. Above 30 K, the crossover in the H = 0 and 30 kOe plots is likely due to the positive cyclotron contribution of the charge carriers to magneto-resistance.
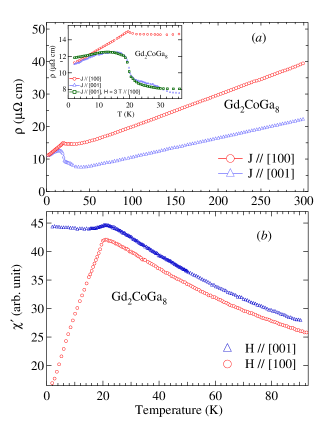
The anisotropic behavior of resistivity in the neighborhood of TN in contrast to the corresponding isotropic behavior of DC magnetization (5 kOe)Devang (1) motivated us to investigate Gd2CoGa8 with AC susceptibility. The data are shown in Fig.2(b), with the AC field applied along the two crystallographic directions. χ´ along [100] increases in the paramagnetic state followed by a peak at TN and then decreases as expected for a simple antiferromagnet. On the other hand, along [001] direction χ´ does not decrease below TN and shows a slight upturn at low temperatures, indicating the presence of complicated magnetic structure with anisotropy. The interaction of the charge carriers with anisotropic magnetic configuration is responsible for the observed behavior of resistivity around TN.
The transverse magnetoresistance (MR), defined as MR = [R(H)-R(0)]/R(0), of the compound at 2 K with current applied along the two principal crystallographic directions shows significant anisotropy (Fig. 3(a)). With current along [100] the MR increases almost linearly with field up to approximately 12 % at 90 kOe, where as along [001] direction it varies more strongly increasing nonlinearly up to 57 % at 90 kOe. The contribution to the total MR due to spin-orbit coupling will be negligible for Gd3+ ions. The cyclotron contribution will also not give rise to such a large MR. Field induced metamagnetic transitions can give rise to a large MR, but Gd2CoGa8 does not show any metamagnetic behavior at 2 K and further the magnetic isotherms at 2 K along both the directions nearly coincide with each other Devang (1) thereby pointing out that the magnetoresistivity behavior in Gd2CoGa8 is primarily influenced by other factors. Further with both current and field constrained to ab plane (J // [100] and H // [010]) but transverse to each other, the magnetoresistance increases to 5 % at 90 kOe. Hence the direction of the field does not play a major role for anomalously high magnetoresistance with current parallel to [001] and only the direction of the current matters. We suggest that the anisotropy in MR arises due to the anisotropy of the Fermi surface.
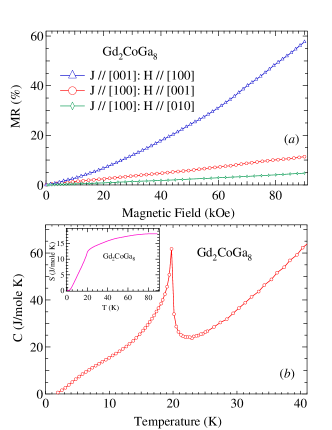
The heat capacity behavior of Gd2CoGa8 is shown in Fig. 3(b). It undergoes a lambda type second order magnetic transition at TN = 20 K consistent with the magnetic susceptibility and resistivity data. The magnetic contribution to the heat capacity was isolated using the data for Lu2CoGa8, assuming it as a measure of phonon contribution, taking into account the mass difference between Gd and Lu. The magnetic entropy calculated as a function of temperature is shown in the inset of Fig. 3(b). The entropy at TN is 13 J/mole K and it attains the theoretical value of Rln8 (17.3 J/mole K) at about 60 K. It nearly saturates above 60 K. This indicates the presence of short range antiferromagnetic correlations above TN and provides further support to our explanation of the upturn in the resistivity in the paramagnetic state as mentioned above.
III.3 Tb2CoGa8, Dy2CoGa8 and Ho2CoGa8
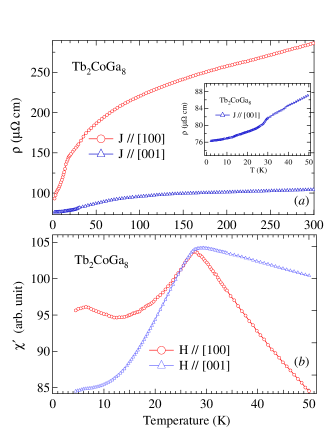
We now describe our results for compounds in which CEF effects are operative. In ref.1Devang (1), it was found that for compounds with Tb, Dy and Ho, the easy axis of magnetization is along [001]. The resistivity of Tb2CoGa8 with current parallel to [100] and [001] directions, respectively, is shown in Fig. 4(a). The resistivity along both the directions initially decreases linearly with temperature down to 130 K followed by a relatively faster drop at lower temperatures, which we attribute to the CEF effect. The thermally induced variation of the fractional Boltzmann occupation of the CEF levels changes the otherwise constant spin disorder resistivity. Overall, the decreases in the resistivity between 1.8 and 300 K is more prominent for J // [100] ( cm) than for J // [001] ( cm), indicating a significant anisotropy in the transport property of the compound. A change in the slope at TN for J // [001] (see, inset) occurs due to the loss of spin disorder resistivity. There is no discernible anomaly at TN for J // [100] but a change in slope exists below 15 K. To investigate a possible origin of this feature, the AC susceptibility was measured with AC field along [100] and [001] directions as shown in Fig. 4(b). It decreases monotonically below TN along [001] but along the [100] direction it increases below 15 K followed by a peak at 6 K. The change in the slope of resistivity at 15 K thus appear to be correlated to the behavior of the AC susceptibility below 15 K. It is possible that because of some complicated magnetic structure there is a component along the ab -plane whose variation with temperature affects the variation of resistivity.
The magnetoresistance of the compound with current parallel to [100] and [001] directions, respectively, is shown in Fig. 5(a). The positive magnetoresistance along both the crystallographic directions is consistent with the antiferromagnetic behavior of the compound. Magnetoresistance at 2 K with H // [100] and J // [001] increases almost linearly by 17 % with applied field increased to 90 kOe. On the other hand the magnetoresistance shows a complex behavior for H // [001]. At 2 K for J // [100], MR initially increases linearly with field. There is a rapid increase in a narrow interval near H 35 kOe followed by a distinct change in the variation near 82 kOe. The magnetoresistance at 90 kOe is 77 %, which though appreciable is far less than that of the corresponding indide Tb2CoIn8( 2700 % at 2 K). The anomalies at 42 and 82 kOe are consistent with the metamagnetic transitions observed in the magnetic isotherm of the compound at 2 K along the easy axis as reported in ref.1Devang (1). At 5 K, the magnetoresistance decreases but qualitatively the behavior is similar to that at 2 K. Increasing the temperature to 10 K, the first anomaly in MR is slightly shifted up in field whereas above 80 kOe the magnetoresistance decreases with field. The latter is due to the reduction in the scattering of the conduction electrons by the ferromagnetically aligned Tb3+ ions at high fields where the compound enters the field induced ferromagnetic state. Here the field-induced polarized state is achieved by the combined action of field and temperature ( 80 kOe and 10 K, respectively).
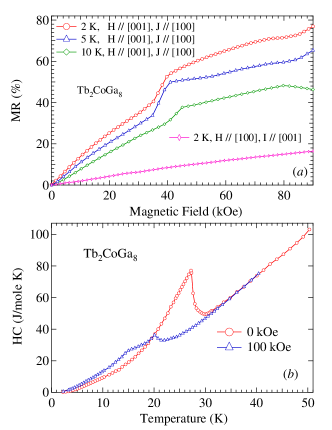
Higher fields are required to induce the ferromagnetic state at lower temperatures. The heat capacity of the Tb2CoGa8 (Fig. 5(b)) in zero field is dominated by a lambda type anomaly at the Nel temperature (TN= 27.5 K). In an applied field of 100 kOe the anomaly disappears; a broad hump and a kink appear at lower temperatures, reflecting an overall weakning of the antiferromagnetic configuration in applied fields and field induced metamagnetic transition in the compound.
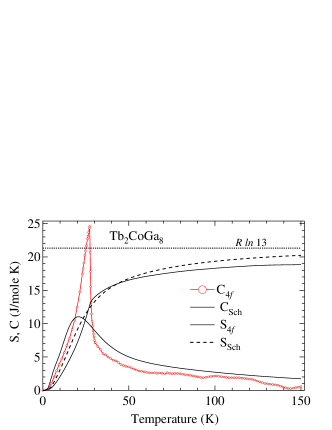
The 4f contribution to the heat capacity, C4f, determined using the same procedure as mentioned for Gd2CoGa8, and the entropy S4f is shown in Fig. (6). In addition we have also plotted the Schottky specific heat CSch and the corresponding entropy SSch calculated from the following expressions
| (5) |
| (6) |
where, Z is the partition function, En are the CEF split energy levels derived from the CEF fitting of the inverse magnetic susceptibility in ref.1Devang (1). It is evident from the figure that there is a reasonably good agreement between C4f and CSch in the paramagnetic regime. This supports the validity of the CEF level scheme for Tb2CoGa8 as derived from the magnetization data. The entropy obtained from the magnetic contribution to the heat capacity is 18.9 J/mole K at 150 K. The theoretically expected value of (21.32 J/mole K) will be achieved at higher temperatures when all the CEF levels are thermally populated.
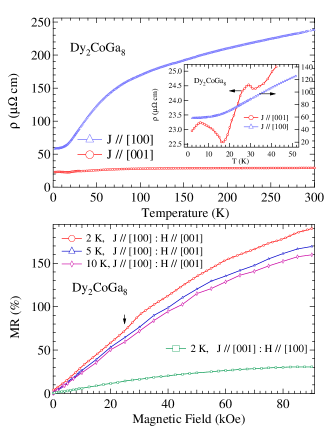
The temperature dependence of electrical resistivity from 1.8 to 300 K for Dy2CoGa8 is shown in Fig. 7(a). The high temperature part of the electrical resistivity of Dy2CoGa8 is qualitatively similar to that of Tb2CoGa8 along the two crystallographic directions, whereas the low temperature resistivity shows a different behavior. The resistivity for J // [100] decreases monotonically below 50 K and does not show any anomalies and becomes nearly temperature independent below 20 K. Along [001] the resistivity shows peaks at 29 and 6 K, the former in the paramagnetic state and the latter below TN. The increase in the resistivity below TN (17 K) is due to the super-zone gap effects, and it is also consistent with the magnetization results which show that the moments order along the [001] direction. In order to look for possible origin of the paramagnetic peak at 29 K, we measured the AC susceptibility with field along [001] direction (not shown). However, no anomaly was found in AC susceptibility; neither do we observe any anomaly at 29 K in the heat capacity (may be overridden by the magnetic contribution) (Fig. 8(a)).
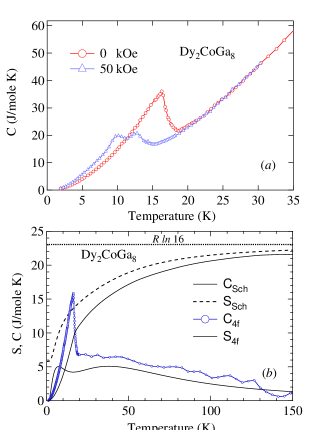
The sharp drop in resistivity below 29 K (Fig. 7(a) inset) with decreasing temperature rules out the possibility of spin fluctuation. The 29 K peak in Dy2CoGa8 exists nearly at the same temperature as in Y2CoGa8. Hence it may also be due to a charge density wave induced gap in the Fermi surface as speculated for Y2CoGa8. However, this needs further investigation. The magnetoresistance at 2 K with J // [001] and H // [100] as depicted in Fig. 7(b) is similar to Tb2CoGa8 and it increases to 25 % at 90 kOe. For J // [100] and H // [001] there is a change in slope at 24 kOe (shown by an arrow) above which the magnetoresistance increases monotonically to 190 % at 90 kOe. With increase in the temperature the magnetoresistance decreases and shows a negative curvature indicating the onset of field induced ferromagnetic behavior. The heat capacity of Dy2CoGa8 is shown in Fig 8(a). A lambda type anomaly indicates the magnetic transition. Application of a magnetic field of 50 kOe results in two humps. The effect is similar to that observed in Tb2CoGa8. The 4f contribution to the heat capacity of Dy2CoGa8 and the Schottky curve calculated as explained above are shown in Fig. 8(b). In the paramagnetic regime, CSch and C4f are in fair qualitative agreement with each other. S4f and SSch are seen to approach the theoretically expected value at high temperatures. It may be mentioned here that Dy is a Kramer’s ion, and the CEF levels in the tetragonal point symmetry will split into 8 doubletsDevang (1). But the calculated CSch and SSch do not take into account the contribution (Rln2) from the doublet ground state. Therefore, we have shifted up our plot of SSch up by .
Ho2CoGa8 orders antiferromagnetically at 6 K with easy axis of magnetization along the [001] directionDevang (1). The resistivity of the compound is shown in Fig. 9(a) with the magnified low temperature part as an inset. The resistivity shows a drop at the ordering temperature of the compound with current parallel to [100] and [001] directions.
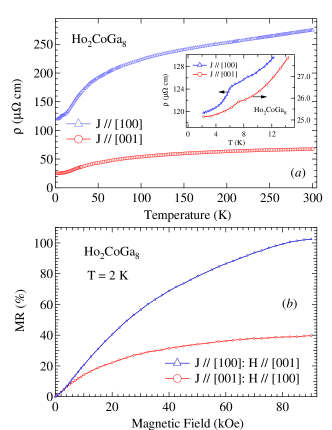
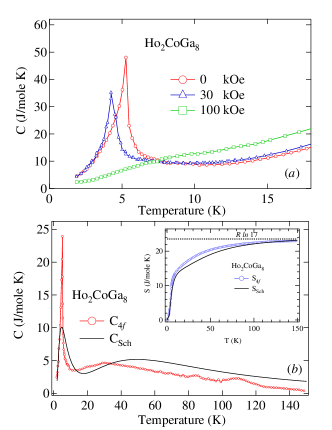
The overall electrical resistivity with J // [100] is similar to that observed by Adriano et al.Adriano (17). Similar to the other members of the series, the resistivity with current parallel to [100] is higher than with the current parallel to [001]. Below 100 K CEF effects manifest in a relatively faster decrease of the resistivity with temperature along both the directions. The magnetoresistance of the compound is shown in Fig. 9(b) with the indicated direction of current and field. The magnetoresistance with J // [100] and H // [001] increases with field up to 102 % at 90 kOe while the corresponding variation with J // [001] and H // [100] is 40 %. The high magnetoresistance with H // [001] is in agreement with the easy axis of magnetization [001] of the compound. The heat capacity of Ho2CoGa8 plotted in Fig. 10(a) shows a sharp lambda type anomaly at the magnetic ordering temperature of the compound. The peak shifts to lower temperatures in an applied field of 30 kOe as anticipated for an antiferromagnetically ordered compound. On further increasing the field to 100 kOe the peak disappears completely and the heat capacity shows a large hump centered at 8 K. Both these effects most likely arise from the metamagnetic transition in the compound. The 4f contribution to the heat capacity of Ho2CoGa8 and the Schottky curve is shown in Fig. 10(b). The Schottky curve shows a peak and hump in fair agreement with the experimental curve. The estimated entropies from the 4f contribution to the heat capacity and the Schottky energy levels are almost equal to the theoretically expected value of .
III.4 Er2CoGa8 and Tm2CoGa8
In case of Er2CoGa8 and Tm2CoGa8 the easy axis of magnetization is along the ab -plane, unlike the other compounds described above where the easy axis of magnetization was along the [001] direction. These two compounds order antiferromagnetically at 3 K and 2 K, respectivelyDevang (1). The resistivity of both the compounds is shown in Fig. 11. For Er2CoGa8 (Fig. 11(a)) the resistivity decreases linearly from room temperature as expected for a metallic compound down to 100 K. Below 100 K the faster drop is attributed to crystal field effects. The inset shows the low temperature part of the resistivity. When J // [100] the resistivity increases below 6 K followed by the downward drop for T < TN and with J // [001] the resistivity falls below 6 K.
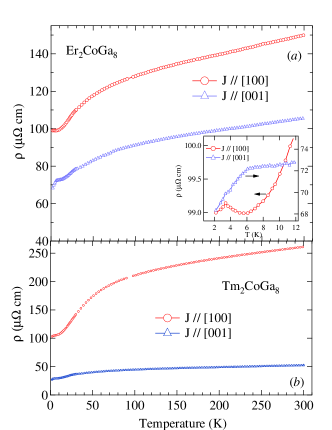
The upturn in the resistivity with J // [100] below 6 K can occur due to the presence of short range antiferromagnetic correlations along the ab plane which incidentally is the easy axis of magnetization. The drop in the resistivity at TN (3 K) is due to disappearance of spin disorder resistivity. The electrical resistivity for J // [001] direction shows a drop exactly at the same temperature (6 K) where there was an increase in the resistivity along the other direction. Although the exact reason for this behavior is not known at present, we tentatively attribute it to the short range correlations of the moments along the easy axis. These relatively opposite variations in the thermal variation of the resistivity indicate that the configurations of the moments when resolved along different directions can be different. Compared to relatively simple ferromagnets, magnetic moments in antiferromagnetic compounds can have very complicated alignments described by a number of wave vectors, phase angles, etc. In case of Tm2CoGa8 the high temperature resistivity has the behavior similar to that of Er2CoGa8 and at low temperatures the resistivity falls at the Neel temperature (2 K) of the compound. The magnetoresistance at 2 K for Er2CoGa8 and Tm2CoGa8 is shown in Fig. 12.
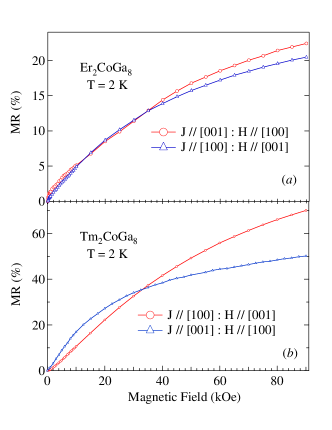
The magnetoresistance for Er2CoGa8 with H // [100] and [001] respectively are close to each other up to 30 kOe. At higher fields the magnetoresistance with H // [100] is marginally higher and attains a maximum value of 23 % at 90 kOe. The result is consistent with lesser anisotropic magnetic behavior seen in the magnetization data; also the MR is measured close to the ordering temperature of the compound. In case of Tm2CoGa8 the magnetoresistance with J // [001] and H // [100] is higher than that with J // [100] and H // [001] below 30 kOe but at higher fields the latter dominates up to the highest applied field.
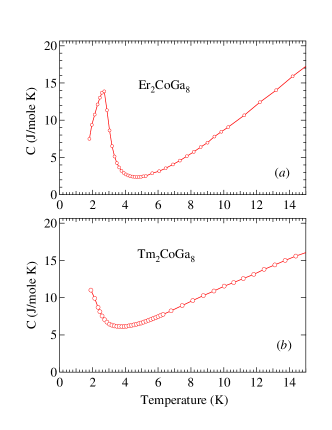
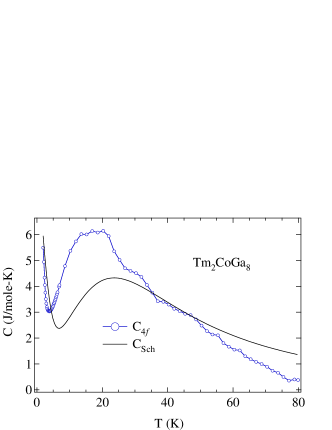
The magnetoresistivity at 90 kOe with H // [001] is 70 % and 50 % for H // [100]. The initial high value of magnetoresistance for J // [001] and H // [100] can be understood by the fact that [100] is the easy axis of magnetization for the compound. Above 30 kOe the magnetoresistance tends to saturate with field along [100] direction indicating the development of the ferromagnetic component (-ve component). With field along the hard direction [001] the development of ferromagnetic component will be achieved at higher fields and because of this the magnetoresistance increases leading to the observed crossover. The heat capacity of both the compounds is shown in Fig. 13. Er2CoGa8 shows an anomaly at the ordering temperature (3 K) while the up turn below 3 K is precursor to the magnetic transition at 2 K in Tm2CoGa8. Since the heat capacity is still large at the lowest temperature data point in Er2CoGa8 and it is necessary to have the heat capacity data to lower temperatures in both the Er and Tm compounds, it is not possible to calculate S4f in these two compounds. The 4f contribution to the heat capacity of Tm2CoGa8 and the Schottky curve is shown in Fig. 14. The Schottky curve shows a low temperature rise and hump in fair agreement with the experimental curve. A similar analysis for Er2CoGa8 is not shown because the CSch calculated from the CEF energy levels as deduced from the magnetization data [1] did not match well with 4f contribution to the heat capacity.
III.5 Conclusion
To conclude, we have studied the anisotropic electrical resistivity, magnetoresistance and heat capacity of R2CoGa8 single crystals. Heat capacity data provide evidence of bulk magnetic transitions with ordering temperatures matching with our earlier magnetization studies. The effect of external magnetic field on the heat capacity of these compounds is in conformity with their antiferromagnetic nature. The Schottky heat capacity calculated from the CEF energy levels derived from the magnetization data compares well with 4f contribution to the heat capacity in the paramagnetic regime for R = Tb, Dy, Ho and to a lesser extent in Tm2CoGa8, thus strengthening the validity of the CEF level scheme obtained in ref. [1] for these compounds. The electrical resistivity shows a significant anisotropy, the resistivity along the ab plane being higher compared to its magnitude along the c -axis. This anisotropic transport behavior indicates a dominant electron motion along the c -axis and may arise due to the structural anisotropy of the compound. Anomalous upturn in the electrical resistivity of some compounds as TN is approached from the paramagnetic side is attributed to short range antiferromagnetic correlations. A hump in the non-magnetic Y2CoGa8 and Dy2CoGa8 near 29 K is tentatively attributed to CDW ordering, which needs to be probed further for confirmation. The highly anisotropic magnetoresistance data reflect the effect of metamagnetic transition in these compounds.
References
- (1) Devang A. Joshi, R. Nagalakshmi, S.K. Dhar and A. Thamizhavel, Phys. Rev. B 77, 174420 (2008).
- (2) Devang A. Joshi, C.V. Tomy and S.K. Malik, J. Phys.: Condens. Matter, 19, 136216 (2007).
- (3) C. Koenig, Z. Phys. B 50, 33 (1983).
- (4) F. Soto, H. Berger, L. Cabo, C. Carballeira, J. Mosqueira, D. Pavuna, and F. Vidal, Phys. Rev. B 75, 094509 (2007).
- (5) R. A. Craven and S. F. Meyer, Phys. Rev. B 16, 4583 (1977).
- (6) J. A. Hofmann, A. Paskin, K.J. Tauer and R.J. Weiss, J. Phys. Chem. Solids, 1, 45 (1956).
- (7) Tomoyuki Sekine, Yoshinari Kiuchi, Etsuyuki Matsuura, Kunimitsu Uchinokura and Ryozo Yoshizaki, Phys. Rev. B 36, 3153 (2007).
- (8) C. Felser, E. W. Finckh, H. Kleinke, F. Rocker and W. Tremel, J. Mater. Chem., 8, 1787 (1998).
- (9) K. D. Myers, S. L. Bud’ko, I. R. Fisher, Z. Islam, H. Kleinke, A. H. Lacerda and P. C. Canfield, 205, 27 (1999).
- (10) M. B. Fontes, J. C. Trochez, B. Giordanengo, S. L. Bud’ko, D. R. Sanchez, E. M. Baggio-Saitovitch and M. A. Continentino, Phys. Rev. B 60, 6781 (1999).
- (11) R. J. Elliott and F. A. Wedgwood, Proc. Phys. Soc., 81, 846 (1963).
- (12) Y. Suezaki and H. Mori, Prog. Theor. Phys. 41, 1177 (1969) and Phys. Lett. 28A, 70 (1969).
- (13) I. Balberg, Physica 91B, 71 (1977).
- (14) G. T. Meaden, N. H. Gsze and J. R. Jonstoan (1972), Dynamical Aspect of critical Phenomina, Ed. J. I. Budnik and M. P. Kawatra (New York; Gorden and Bridge), page 315.
- (15) Surjeet Singh and S. K. Dhar, J. Phys.: Condens. Matter, 14, 11795 (2002).
- (16) V. Sechovsky, F. Honda, B. Janousova, K. Prokes, P. Svoboda, O. Syshchenko, A.V. Andreev, Physica B 328, 95 (2003).
- (17) C. Adriano, L. Mendonça-Ferreira, E. M. Bittar and P. G. Pagliuso, J. Appl. Phys., 103, 07B712 (2008).