The temperature diagnostic properties of the Mg I 457.1 nm line
Abstract
We analyze the important formation processes for the Mg I 457.1 nm line. This line is an intercombination line and the source function is close to the local thermodynamic equilibrium (LTE) value. The strong coupling to the local temperature and the relatively high population of the lower level (the ground state of Mg I) makes this line an ideal candidate for temperature diagnostics in the lower chromosphere/temperature minimum region. Linking the temperature probed to an absolute physical height is non trivial because of Non-LTE ionization. We analyze the Non-LTE effects and find that photo-ionization from the lower energy levels together with cascading collisional recombination dominate the ionization balance. Taking properly into account the line-blanketing in the UV is essential for obtaining the right photoionization rates. The identification of the main Non-LTE effects in the line allows us to construct a “quintessential” model atom, ideal for computationally demanding tasks, e.g. full 3D and/or time-dependent radiative transfer. Furthermore we analyze the diagnostic potential to temperature of this line in solar-like atmospheres, by synthesizing the line from a series of parametrized atmospheric models. These models have been constructed with fixed effective temperature, but with a variable heat term in the energy equation to obtain a chromospheric temperature rise at different heights. We conclude that the line has a significant potential in the diagnostics of the lower chromosphere temperature structure, especially for cooler atmospheres, such as sunspots.
Subject headings:
Sun: chromosphere – sunspots1. Introduction
Deriving the solar atmospheric temperature structure from the emergent spectrum is a classical problem (e.g. Gingerich et al., 1971; Vernazza et al., 1981; Maltby et al., 1986; Fontenla et al., 1993). It became clear quite early that the 1D semi-empirical models would need an increasing temperature in the chromosphere, to explain the increasing radiation temperature with increasing opacity in lines (Athay & Thomas, 1961). The existence of such a static temperature rise in the real sun has, however, been questioned (Carlsson & Stein, 1995). Hence, it is of great importance to have a good temperature diagnostic for the lower solar chromosphere.
One such candidate is the Mg I 457.1 nm line (from now on the 457.1 line). Note that we here use the common practice in astronomy to use the wavelength in air for naming lines, in vacuum the wavelength is 457.2 nm. The 457.1 line arises from the forbidden transition , hence the source function should be tightly coupled to the local temperature (e.g. Athay & House, 1962; Altrock & Canfield, 1974; Heasley & Allen, 1980; Mauas et al., 1988) due to the dominance of collisions in forbidden lines. The fact that the source function is highly coupled to the local temperature makes the 457.1 line ideal as a diagnostic of the temperature at the height of formation of the line. Early attempts to use this line as a temperature diagnostic include the work of White et al. (1972); Altrock & Cannon (1972); Altrock (1974); Rutten (1977); Heasley & Allen (1980); Mauas et al. (1988). The most important result from this work is that the 457.1 line is formed at around 500 km height in typical quiet sun 1D semi-empirical models, and hence the line will probe the temperature minimum region. Furthermore, the 457.1 line has also been used as a temperature diagnostic for cooler models such as sunspot models (Lites et al., 1987). The modelling often gives a non-observed central reversal in the line core leading to the conclusion that the chromospheric temperature rise must be at a higher position. This result has, however, been questioned (Mauas et al., 1988) due to possible uncertainties in the atomic model. More comprehensive Mg I model atoms have been published like the 66-level atom of Carlsson et al. (1992) and the 83 level atom of Zhao et al. (1998). The 457.1 line has also been used to derive the temperature structure in solar features such as magnetic elements (Briand & Solanki, 1995) and flares (e.g. Metcalf et al., 1990a, b).
In this paper we present analysis and results of the temperature diagnostic properties of the 457.1 line. In §2 we analyze the important formation processes of the 457.1 line. As a result of this work we present a minimal realistic model atom (a quintessential model atom) for the 457.1 line in §3. In §4 we parametrize the model atmospheres by solving the radiation hydrodynamics equations with a prescribed heating per unit volume. The atmospheres are allowed to relax and the resulting atmospheres are used to solve the Non-LTE problem for the 457.1 line. Finally we summarize our results in §5.

2. Formation processes for the 457.1 line
To understand the important formation processes for the 457.1 line we perform and analyse 1D radiative transfer calculations.
2.1. Atmospheric models
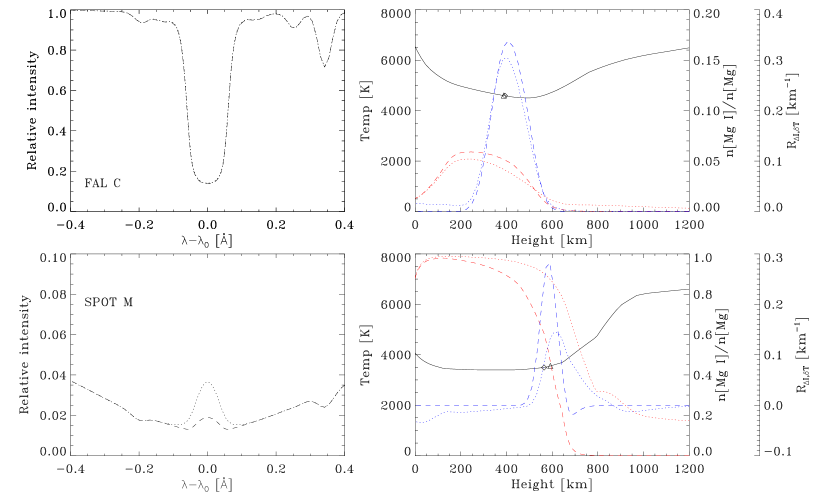
For this analysis we use two semi-empirical 1D models, the FAL C model (Fontenla et al., 1993) and the Spot M model (Maltby et al., 1986). These models represent an average quiet sun atmosphere and an average sunspot umbra atmosphere (for a sunspot with an umbral radius greater than 5″ from the middle of the sunspot activity cycle), respectively. At the formation height of the 457.1 line, magnesium is predominantly neutral in the sunspot model and mostly ionized in the FAL C model. This large difference in the ionization makes these two models ideal for testing the formation processes in different atmospheric conditions.
2.2. Model atom
The atomic model used in this analysis was published by Carlsson et al. (1992). In short, this is a 66-level atom, including 65 Mg I levels and one Mg II level.The model atom include all levels up to and also the levels for the Mg I , Mg I , and Mg I , since these levels have so big quantum defects that their energy is lower than the energy levels with high l values. Furthermore, the model atom includes 65 bound-free transitions and 315 bound-bound transitions. Only one intercombination transition is included, , which in fact is the transition giving rise to the 457.1 line (note that the data for this line is taken from Mauas et al. (1988)). Also note that there is no distinction between the singlet and the triplet systems for levels with , i.e. similar levels are considered to be internally Boltzmann populated. Finally, for some levels (most notably the upper level of the 457.1 line), the fine structure has been combined into ”terms”, with the individual levels assumed to be Boltzmann populated with respect to each other and the energy taken as the weighted mean energy with the statistical weight of each of the fine structure levels as weight factor. A termdiagram of this model atom can be seen in Fig.1.
In these calculations we adapt a Mg abundance of 7.53 on a logarithmic scale (Asplund et al., 2005). All other heavy element abundances are taken from the same source.
2.3. Formation processes in the FAL C atmosphere
Using the Mg model atom and the FAL C model atmosphere, we solve the equation of radiative transfer and statistical equilibrium using the MULTI code (Carlsson, 1986). Background opacities from nearby lines are treated with a scattering term included in the source function in a two-level approximation. The line data for these lines were retrieved from the Vienna Atomic Line Database (VALD) (Piskunov et al., 1995; Kupka et al., 1999; Ryabchikova et al., 1999). After solving the NLTE problem, we take into account the fine structure of the upper level of the 457.1 line by distributing the term population over the sublevels solving the transfer equation again for the 457.1 transition.
Since the bound–free edges of many of the important lower levels occur in the ”UV line haze”, it is necessary to account for the resulting line blocking when calculating the bound-free opacity. This is done by using an opacity sampling method which reads a precomputed table of line opacity as function of wavelength, temperature and electron density (Collet et al., 2005).
We test the NLTE effects in the line formation processes, by comparing the LTE solution with the NLTE solution. The emergent profiles in the two cases can be seen in the upper left panel of Fig.2. The difference in the two line profiles is very small. The response-function to intensity given a change in temperature (from now on denoted , see Magain, 1986; Fossum & Carlsson, 2005, for details), is seen in the upper right panel in Fig.2. There is not much difference between the LTE and the NLTE , but this small difference is actually a coincidence. Since the lower level in the 457.1 line is the ground state of Mg I, the population density of this line is set by the ionization fraction of the atom. The fraction of Mg I atoms to the total number of Mg atoms is seen in the upper right panel of Fig.2. It is clear that the relative ionization in LTE compared to NLTE deviate 20% or more, but it turns out that the under–ionization at greater atmospheric heights to some extent cancel the over–ionization at lower heights in the atmosphere. We investigate these NLTE effect by comparing the rates into the Mg II level from each Mg I level, see Fig.3. As indicated by Fig.3, the dominating effects in the ionization balance of magnesium is radiative ionization from the lower levels, (which dominate because of their relatively high population) especially the Mg I level (level number 3), which has significantly larger photo-ionization crossection compared to other similar levels. Furthermore, the high energy triplet energy levels play an important role in the ionization balance through collisional recombination (Carlsson et al., 1992; Shimanskaya et al., 2000).

2.3.1 Testing the sensitivity of the ionization fraction
To further test the dominating processes in the ionization balance of magnesium, we perform a series of test runs with different degree of realism in the radiative transfer. We test the two main NLTE effects, namely the photoionization and the collisional recombination. For the first effect we run our model atoms with and without taking into account the “UV line haze”. For the second effect, we construct a model atom which does not contain the recombination ladder, essential for the cascading recombination. This is done simply by removing all energy levels, except the Mg II level, with energy above 6.5 eV, see Fig.1 right panel for details on the resulting 11 level atom. The 11 level model atom is quite similar to the older models of the Mg I atom.

The results of these tests for the FAL C and the Spot M atmospheres are seen in Fig.4 and can be summarized as follows: The largest effect comes from neglecting line blocking with a similar, but slightly smaller, change in the results if the cascading recombination is neglected. It is clear that the NLTE effects are significant, and it is very important that they are included in a realistic manner. If the NLTE effects are included, but with a lacking realism, the deviations from LTE are generally amplified. Finally, to understand the under-ionization high in the atmosphere, and the over-ionization in the lower atmosphere we turn our attention to the radiation field. If is bigger than we have more photons absorbed than emitted and vice versa. Investigating the radiation field for the most important bound–free transition, we see that is larger than where we have over-ionization and smaller than higher in the atmosphere where we have under-ionization.
2.4. Formation processes in the Spot M atmosphere


Similar to the FAL C model we solve the equations of radiative transfer for the Spot M model. The resulting line profiles, LTE and NLTE, are seen in the lower left panel of Fig.2. The difference between the two profiles is significant, especially compared to the similar FAL C profiles. The NLTE solution shows a pronounced increase in the central reversal in the line center of the line. This is basically caused by the higher geometric position of the monochromatic optical depth in NLTE, where the temperature is higher compared to the temperature at the height of formation in LTE. The is much wider in NLTE compared to the LTE case. Furthermore, the has contributions in NLTE from high regions where the temperature has a significant increase. The reason for the increasing formation height in the Spot M model is an increase in the fraction of neutral Mg, see Fig.2 lower right panel. To understand this deviation in ionization fraction, we plot the net rates into the Mg II levels, see Fig.5. As for the FAL C model, we get big contributions from the lower levels of the atom, but also the higher excited levels contribute significantly to the ionization fraction, but with a negative contribution. This, together with the cascading collisional recombination, gives much lower ionization fraction for the Mg I atom in the Spot M model. From Fig.4 lower panel, one can see that the ionization fraction is less sensitive to the number of levels in the atom, but much more so for the treatment of line blocking. This is due to the reduced relative importance of the cascading recombination, compared to radiative transitions, see Fig.5
3. Quintessential model atom
From the above analysis in §2 we have identified the dominating processes in the formation of the 457.1 line. It is then a reasonable question if it is possible to construct a “quintessential” model atom (the smallest atom which reproduces the important physical processes) for this line. Since it is very important to get the ionization fraction correctly for this line, such a quintessential atom must contain a recombination ladder, which satisfactorily mimics the cascading recombination seen in the 66 level model atom.
Following the general procedures outlined by Bard & Carlsson (2008), we construct a quintessential 457.1 line model atom. First, we remove all singlet levels with energy levels above 6.5 eV. This is justified by the small contribution to the overall ionization fraction from these levels, as seen in Fig.3 and in Fig.5. If two levels have a difference in effective quantum number and at the same time are almost Boltzmann populated () in both in the FAL C model and in the Spot M model they are merged. The new model atom is tested in the two atmospheric models, and only accepted if the maximum relative deviation in the emergent intensity (compared to the full atom) is less than 25%. This procedure is repeated until all levels have been tested. The resulting model atom is reduced to a 27 level atom; see Fig.1, which is a reduction to less than half the size of the original atom.
Further reduction is possible, but only with more liberal acceptance conditions, which would affect the realism of the model atom. The new model atom mimic the recombination ladder in the full model atom, by super levels as seen in Fig.6 and Fig.3.
The quintessential model atom was also tested against the original atom using a series of dynamic atmospheres taken from Carlsson & Stein (1997). This test gives a deviation between the lineprofiles of less than 3% between the two models atoms, and deviations in the bisector Doppler shifts of usually less than 10 m s-1 and always less than 30 m s-1.
4. Parametrization of the temperature diagnostics
In the above analysis we have seen that the 457.1 line shows a strong central reversal in a cool sunspot atmosphere, but in a hotter quiet sun model there is no such reversal. The reason for the lack of reversal in the hotter model is the high ionization fraction in such models, which deplete the number densities of the lower level in the 457.1 line and put the formation height below the chromospheric temperature rise. From here on we focus on cool sunspot models, since the 457.1 line has a clear diagnostic potential for such models. We are especially interested in the possible bound the central reversal put on the position of the temperature rise in such models.
To investigate the diagnostic properties of the line further, we construct a series of 1D self consistent radiative hydrodynamics model atmospheres. We use the radyn code (Carlsson & Stein, 1992, 1995, 1997, 2002), to construct these model atmospheres. In short this code solves the mass, momentum, and energy conservation equations together with the detailed equations of radiative transfer for three of the important elements in the energy balance (H, Ca, and He) on an adaptive grid (Dorfi & Drury, 1987). The boundary condition in the deep photospheric part (colum mass 15 g cm-2) of the atmosphere is taken from a 4000 K effective temperature model without convection generated by the MARCS code (Gustafsson et al., 2008). The temperature structure in these deep parts of the atmosphere is fixed by adding a new term to energy equation in this region.
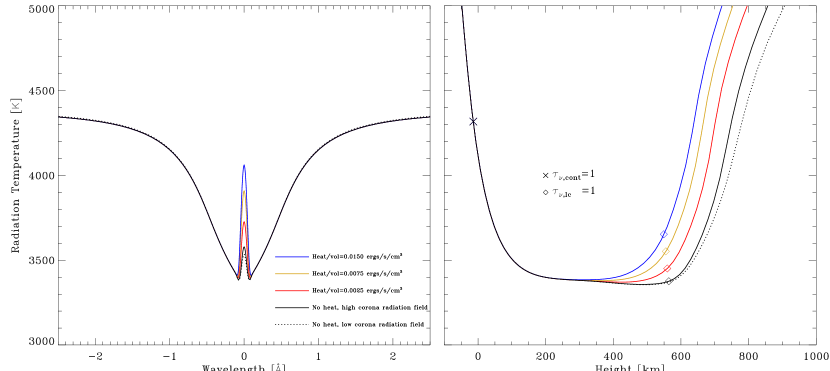
The incoming UV radiation field from the corona has to be specified at the upper boundary. To facilitate such a boundary condition we use the data of Tobiska (1991) and follow the method used by Wahlstrom & Carlsson (1994). Since the model used by Wahlstrom & Carlsson (1994) was based on a quiet sun corona, we expect that this model underestimate the coronal radiation field. We have performed tests (a more thorough analysis of this effect will be given in an upcoming paper) with different scaling of the incoming radiation field, and found that the radiation field has profound effects on the chromospheric temperature structure. From these tests we conclude that the incoming radiation field should be scaled up by at least a factor 5. With the above described boundary conditions, we allow the atmospheres to converge to an equilibrium state, and the pressure at the top of the simulations is changed until there are no more outflowing material. The resulting temperature structures for an active and a quite corona are seen in Fig.7 right panel. The difference in the chromospheric temperature structure due to scaling of the coronal radiation field is quite big, however the effect on the 457.1 line is rather small due to the low formation height, see Fig.7 left panel. For the construction of the atmospheres used in this analysis we adopt a scaling factor of 5 for the coronal radiation field.
We parametrize the position of the chromospheric temperature increase in the theoretical model atmosphere by adding a constant heat term in the energy equation. To avoid unrealistic temperature structures in the lower part of the atmosphere, the heat term has to be defined per volume and not per mass. The latter will lead to an increase in temperature at very low atmospheric heights (Bard & Carlsson, 2004). Since the heating term per volume will lead to a very high energy input in the corona, we allow a smooth transition to heat per mass above the transition region in the original atmosphere. The exact position of this smooth transition is changing the temperature structure in the corona, and to some extent the upper chromosphere, but it has no effect on the emergent 457.1 line profile. Furthermore, the heat term leads to an expanding corona but flows due to this expansion at the formation height of the 457.1 line are very small, typically less than 10 m s-1 and hence negligible.
We construct different atmospheres by adding different heat terms per volume to the energy equation as described above. In this way we construct a grid of self consistent atmospheres with different position of the chromospheric temperature rise. Note that we use this parametrization of the temperature because it is only dependent on one parameter (the magnitude of the constant heat term added to the energy equation). Furthermore, these models should be considered a parametrization of the position of the chromospheric temperature increase, and not a parametrization to evaluate the energy balance in the chromosphere.
Some of the resulting temperature structures are seen in Fig.7 right panel. As seen in the left panel of Fig.7 the emergent 457.1 line profile shows a significant increase in the central reversal with decreasing height of the chromospheric temperature rise. Note that these line profiles have been calculated using the quintessential modelatom and without including the nearby lines (to avoid confusion). The size of the reversal is increased by the increasing temperature at the monochromatic optical depth of the line center of the 457.1 line. Note that the position of the monochromatic optical depth is only slightly changed with the changes in the position of the chromospheric temperature rise. The reason for this rather constant formation height is the high number densities of the Mg I ground state. If the temperature is increased, the relative change in the ionization fraction is changed only slightly due to the high density of Mg I atoms.
Note the inconsistency between the emergent profile and the Eddington-Barbier approximation applied on the temperature structures in Fig.7. The reason for the lacking correspondence is the deviation of the source function/temperature from a linear function in . Since the Eddington-Barbier approximation is not very good, it is not very instructive to invert the temperature profile from such assumptions. However, the reversals are strong enough to discriminate between different models. We recommend a forward modeling approach to the temperature diagnostics, similar to the work by Lites et al. (1987). From these theoretical models the 457.1 line can be used to set lower bounds on the position of the chromospheric temperature increase. The sensitivity of such a discrimination will of course depend on the sensitivity of the observations used for the comparison.
5. Conclusion
We have analysed the dominant NLTE effects of the 457.1 line in two solar models (FAL C and Spot M), and concluded that the ionization from the lower levels, especially the Mg I , is the main contribution to the ionization. Furthermore, cascading collisional recombination in the triplet system plays an important role in the NLTE formation processes in the 457.1 line. With the understanding of the formation processes for the 457.1 line, it is possible to construct a “quintessential” model atom. We have presented a 27 level quintessential model atom (an atom with the minimum number of levels, that maintain the important physical processes).
We have found that increasing the realism in the model atom does not remove the non-observed central reversal in the Spot M model, as claimed by Mauas et al. (1988).
Finally we have presented a series of sunspot models where the height of the chromospheric temperature rise has been varied. These models show that the height of formation of the 457.1 line is not very sensitive to the height of the chromospheric temperature rise but the central reversal is. The amount of emission in the line core is thus a sensitive diagnostic of the lower chromosphere temperature structure and a lack of central reversal puts a strong constraint on the lowest possible position of the chromospheric temperature increase.
Acknowledgments. This research was supported by the Research Council of Norway through grant 170935/V30 and a grant of computing time from the Program for Supercomputing. This research has made use of NASA’s Astrophysics Data System.
References
- Altrock (1974) Altrock, R. C. 1974, Sol. Phys., 34, 37
- Altrock & Canfield (1974) Altrock, R. C., & Canfield, R. C. 1974, ApJ, 194, 733
- Altrock & Cannon (1972) Altrock, R. C., & Cannon, C. J. 1972, Sol. Phys., 26, 21
- Asplund et al. (2005) Asplund, M., Grevesse, N., & Sauval, A. J. 2005, in Astronomical Society of the Pacific Conference Series, Vol. 336, Cosmic Abundances as Records of Stellar Evolution and Nucleosynthesis, ed. T. G. Barnes, III & F. N. Bash, 25–+
- Athay & House (1962) Athay, R. G., & House, L. L. 1962, ApJ, 135, 500
- Athay & Thomas (1961) Athay, R. G., & Thomas, R. N. 1961, Physics of the solar chromosphere (Interscience Monographs and Texts in Physics and Astronomy, New York: Interscience Publication, 1961)
- Bard & Carlsson (2004) Bard, S., & Carlsson, M. 2004, in IAU Symposium, Vol. 223, Multi-Wavelength Investigations of Solar Activity, ed. A. V. Stepanov, E. E. Benevolenskaya, & A. G. Kosovichev, 445–446
- Bard & Carlsson (2008) Bard, S., & Carlsson, M. 2008, ApJ, 682, 1376
- Briand & Solanki (1995) Briand, C., & Solanki, S. K. 1995, A&A, 299, 596
- Carlsson (1986) Carlsson, M. 1986, A Computer Program for Solving Multi-Level Non-LTE Radiative Transfer Problems in Moving or Static Atmospheres (Uppsala Astronomical Observatory: Report No. 33)
- Carlsson et al. (1992) Carlsson, M., Rutten, R. J., & Shchukina, N. G. 1992, A&A, 253, 567
- Carlsson & Stein (1992) Carlsson, M., & Stein, R. F. 1992, ApJ, 397, L59
- Carlsson & Stein (1995) —. 1995, ApJ, 440, L29
- Carlsson & Stein (1997) —. 1997, ApJ, 481, 500
- Carlsson & Stein (2002) —. 2002, ApJ, 572, 626
- Collet et al. (2005) Collet, R., Asplund, M., & Thévenin, F. 2005, A&A, 442, 643
- Dorfi & Drury (1987) Dorfi, E. A., & Drury, L. O. 1987, Journal of Computational Physics, 69, 175
- Fontenla et al. (1993) Fontenla, J. M., Avrett, E. H., & Loeser, R. 1993, ApJ, 406, 319
- Fossum & Carlsson (2005) Fossum, A., & Carlsson, M. 2005, ApJ, 625, 556
- Gingerich et al. (1971) Gingerich, O., Noyes, R. W., Kalkofen, W., & Cuny, Y. 1971, Sol. Phys., 18, 347
- Gustafsson et al. (2008) Gustafsson, B., Edvardsson, B., Eriksson, K., Jørgensen, U. G., Nordlund, Å., & Plez, B. 2008, A&A, 486, 951
- Heasley & Allen (1980) Heasley, J. N., & Allen, M. S. 1980, ApJ, 237, 255
- Kupka et al. (1999) Kupka, F., Piskunov, N., Ryabchikova, T. A., Stempels, H. C., & Weiss, W. W. 1999, A&AS, 138, 119
- Lites et al. (1987) Lites, B. W., Skumanich, A., Rees, D. E., Murphy, G. A., & Carlsson, M. 1987, ApJ, 318, 930
- Magain (1986) Magain, P. 1986, A&A, 163, 135
- Maltby et al. (1986) Maltby, P., Avrett, E. H., Carlsson, M., Kjeldseth-Moe, O., Kurucz, R. L., & Loeser, R. 1986, ApJ, 306, 284
- Mauas et al. (1988) Mauas, P. J., Avrett, E. H., & Loeser, R. 1988, ApJ, 330, 1008
- Metcalf et al. (1990a) Metcalf, T. R., Canfield, R. C., Avrett, E. H., & Metcalf, F. T. 1990a, ApJ, 350, 463
- Metcalf et al. (1990b) Metcalf, T. R., Canfield, R. C., & Saba, J. L. R. 1990b, ApJ, 365, 391
- Piskunov et al. (1995) Piskunov, N. E., Kupka, F., Ryabchikova, T. A., Weiss, W. W., & Jeffery, C. S. 1995, A&AS, 112, 525
- Rutten (1977) Rutten, R. J. 1977, Sol. Phys., 51, 3
- Ryabchikova et al. (1999) Ryabchikova, T., Piskunov, N., Stempels, H., Kupka, F., & Weiss, W. 1999, Physica Scripta, T83, 162
- Shimanskaya et al. (2000) Shimanskaya, N. N., Mashonkina, L. I., & Sakhibullin, N. A. 2000, Astronomy Reports, 44, 530
- Tobiska (1991) Tobiska, W. K. 1991, Journal of Atmospheric and Terrestrial Physics, 53, 1005
- Vernazza et al. (1981) Vernazza, J. E., Avrett, E. H., & Loeser, R. 1981, ApJS, 45, 635
- Wahlstrom & Carlsson (1994) Wahlstrom, C., & Carlsson, M. 1994, ApJ, 433, 417
- White et al. (1972) White, O. R., Altrock, R. C., Brault, J. W., & Slaughter, C. D. 1972, Sol. Phys., 23, 18
- Zhao et al. (1998) Zhao, G., Butler, K., & Gehren, T. 1998, A&A, 333, 219