New power law signature of media exposure in human response waiting time distributions
Abstract
We study the humanitarian response to the destruction brought by the tsunami generated by the Sumatra earthquake of December 26, 2004, as measured by donations, and find that it decays in time as a power law with . This behavior is suggested to be the rare outcome of a priority queuing process in which individuals execute tasks at a rate slightly faster than the rate at which new tasks arise. We believe this to be the first empirical evidence documenting this recently predicted [Grinstein, G. and R. Linsker, (2008) Phys. Rev. E 77, 012101] regime, and provide additional independent evidence that suggests this “highly attentive regime” arises as a result of the intense focus placed on this donation “task” by the media.
pacs:
89.75.-k, 87.23.Ge, 89.20.-aI Introduction
Who has not wondered about why things take so long to be done or to come to fruition? Why are we not answering correspondence, emails or returning phone calls immediately? When we have an idea, or develop an intention to create something new, such as a career change, a new relationship, or a healthier lifestyle, why does it take so long to take action and/or see results?
Recent studies of social systems suggest a simple answer: the distribution of waiting times between cause and action performed by humans is found to be a power law with an exponent less than , so that the mathematical expectation of the waiting time () between consecutive events is infinite. This power law behavior applies to the waiting time until an email message is answered Eck , to the time intervals between consecutive e-mails sent by a single user and time delays for e-mail replies Barabasi_Nature05 , to the waiting time between receipt and response in the correspondence of Darwin and of Einstein Oliveira_Bara , and to the waiting times associated with other human activity patterns which extend to web browsing, library visits and stock trading Vasquez_et_al_06 .
These observations can be rationalized by priority queuing models that describe how the flow of tasks falling on (and/or self-created by) humans are executed using priority ranking Barabasi_Nature05 ; Oliveira_Bara ; Vasquez_et_al_06 . Let denote the average rate of task arrivals and the average rate for executing them. We can then distinguish between two different regimes: (i) , i.e. an ‘overburdened’ regime where tasks arrive faster than can be executed, and (ii) , i.e. tasks receive attention because they arrive with a rate below the execution rate, which we call the ‘highly attentive regime’ here. Using a standard stochastic queuing model wherein tasks are selected for execution on the basis of random continuous priority values, Grinstein and Linsker Grinstein1 derived the exact overall probability per unit time, , that a given task sits in the queue for a time before being executed for each of these regimes:
| (1) | |||||
| (2) |
The first regime with a value of the exponent is compatible with previously reported numerical simulations Barabasi_Nature05 ; Oliveira_Bara ; Vasquez_et_al_06 and with most of the empirical data. The second regime, however, is characterized by an exponent , i.e. it results in much shorter tails of as compared to the first one and does not seem to have been documented empirically.
Hence, in this paper we provide what we believe to be the first empirical evidence documenting the second regime by analysing a dataset of donations described together with the methodology in Section II. In Section III, we conjecture that the second regime may not have been previously documented because of the effect of intense media focus on modifying the rate of execution of this “donation task”. In section IV, we scrutinize the assumptions underlying our conclusions and form an hypothesis for the “highly attentive regime”, that is tested in section V. Specifically, we ask whether or not data exhibiting an exponent of can be used as a signature to identify tasks receiving significant media attention. For this, we investigate a massive, unique dataset containing the timeseries of the daily view counts for nearly five million videos on YouTube. We find that this approach, while performed ex post, provides compelling results that support our media focus conjecture. Finally, in section VI, we discuss these results and propose a set of experiments to place these results on a more firm methodological footing.
II Methodology
In this paper, we study the dynamics of the daily donation amount in response to the devastating tsunami generated by the Sumatra earthquake of December 26, 2004. This dataset was already analyzed by Schweitzer and Mach SchweitzerMach and it was shown that the total fraction of donors over time, , can be perfectly described by an epidemic model, , provided that one takes into account a slowing down of the inverse time scale . The latter has a clear relation to mass media communication: people simply lost their interest in the topic because of an overuse in the media (a kind of ’mental’ saturation). The second parameter gives the time when the donations are peaked. As reported in Ref. SchweitzerMach , this value varies for different donor organizations (8 days after the tsunami for the largest donor organization (DH) versus 36 days for the smallest one (AH)). These differences arise because of the relative size and scale and target demographics of these organizations — DH is a national alliance whereas AH is more local. Additionally, DH possess the infrastructure for advertising and processing large volumes of donations and, importantly, maintained a mass media presence throughout this crisis. In the following, we only concentrate on the largest data set (DH) because of the statistical significance.
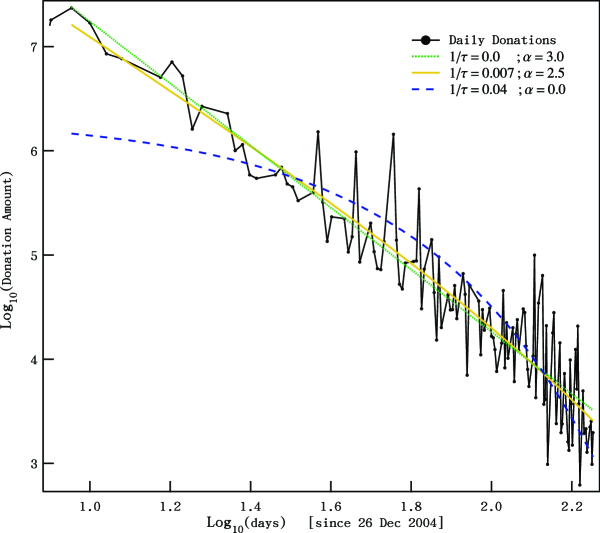
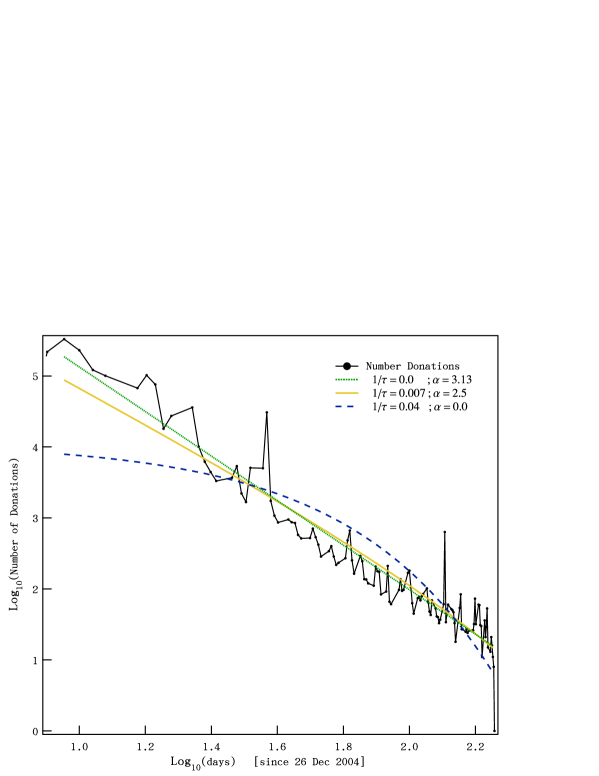
Different from SchweitzerMach , we do not focus on but on the growth rate which gives the daily number, , or daily amount, , of donations (see also Figs. 1, 2), which behave very similar as already noticed in SchweitzerMach . As a second difference to the previous investigations, we only focus on the long-term behavior of , i.e. for sufficiently large (see also Section IV).
In order to analyze the data, we adopt an ergodic approach which assumes that sampling the collective responses of many individuals in time is equivalent to sampling many realizations of the same stochastic process. Therefore, in order to measure the static distribution of waiting times describing a single individual, we instead measure the ensemble response of a large number of “independent, identically distributed” individuals, each of whom is presented with the same task simultaneously. This approach amounts to mapping the static distribution of waiting times describing individuals into the time domain. This type of mapping is only possible because of the “singular” nature of the tsunami which provides a shock that allows all possible donors to become aware of the donation “task” at the same distinct time.
In order to see how the distribution of rates of such responses can be mapped to the overall probability per unit time that a given task sits in the queue for a time before being executed, consider the tsunami that occurred on December 26, 2004. A donation associated with this event can be considered as a task that was triggered (but not necessarily executed) on that day simultaneously for a large population of potential donors. This task competes with many others associated with the job, private life and other activities of each individual in the entire population. The specificity of the social experiment provided by the tsunami is that the same “singular task” is presented at approximately the same time to all potential donors, but the priority value of this singular task can be expected to be widely distributed among different individuals. Grinstein and Linsker Grinstein2 showed that the distribution (2) is independent of the specific shape of the distribution of priority values among individuals. Since the singular task has been initiated at nearly the same time for all individuals, the donations at a time after this initiation time is then simply equal to , where is the number of individuals who will eventually donate in the population and is the previously defined overall probability per unit time that a given task sits in the queue for a time before being executed. This suggests that the tsunami donation data provides a direct test for the prediction of the priority queuing model solved exactly by Grinstein and Linsker Grinstein1 , and this methodology forms the basis for the analysis we perform.
III Empirical Results for Donations
Here we study both the daily number of donations, (Fig. 1), and the daily amount of donations, (Fig. 2), as a function of time, where is counted in days after the tsunami. Both curves are characterized by a large burst of donation activity in the days after the tsunami on December 26, 2004, followed by a slow decay. The curves peak around January 4th, a 9 day delay likely caused by the timing of the event around the holidays when many people were away, and charities were not open. Schweitzer and Mach SchweitzerMach demonstrated that the decay in the rate of donations is slower-than-exponential, with an instantaneous decay rate growing proportional to the time elapsed since the occurrence of the tsunami. This observation is typical of scale-free dynamics and thus suggests a power law decay of the type
| (3) |
The green line in Figure 1 is the power law (3) with adjustable exponent where the parameter is determined by maximum likelihood (ML). The black dashed line in Figure 1 corresponds to a pure exponential relaxation and is clearly an inferior fit (-value). The yellow line in Figure 1 is a fit using
| (4) |
which has the same explanatory power as the pure power law model (3) (-value). Allowing both and to be freely fitted in (4) (two-parameter model) is undistinguishable from the one-parameter model (4) with fixed (-value).
Figure 2 shows the total amount of individual donations for each day, corresponding to the data of Figure 1. The calibration of models (3) and (4) give practically the same values for and in all cases. This is expected from the fact that, while the amount of a donation can vary in size, the statistical distribution of donation sizes for this particular data has been shown to be constant both before and after the tsunami SchweitzerMach .
Thus, from Figs. 1 and 2, we conclude that total the donation value per day or daily number of donations give practically the same tapered power law decay (4), which holds for sufficiently large . One possible explanation for these results is based on the priority queuing model in the regime (rate of performing tasks faster than rate of task arrival), which predicts the exponent . Interpreted in the context of the queuing model, the donation rates following the tsunami is influenced by the extreme media attention, which lead the potential donors to address this task more diligently than they would otherwise. Quantitatively, a comparison of (2) and (4) provides an estimation of days-1, leading to days and with . Taking for instance a rate of tasks arriving per day, the average rate of executing them is then estimated as tasks per day. The closeness of to signals the proximity to the bifurcation from the law (2) to the much slower decay occurring for Grinstein1 . We note again that all previously mentioned examples SornetteJohansenOriginalInternaut ; SornetteAmazonPRL ; Deschatres ; cranesoryoutube ; Dezso_et_al_06 ; Leskovec_et_al_07 report an exponent , in agreement with the queuing regime where the execution rate is smaller that the task arrival rate, whereas this example clearly fits into the regime . Our present model seems quite parsimonious with just one exponent of the power law which is predicted without adjustment to be equal to , plus a weak exponential taper.
IV Discussion of Long Term Behavior
In this section, we want to take a closer look into the underlying assumptions of our conclusions. Many other studies have documented a power law decay in time of the rate of responses to shocks in human societies which, according to the above reasoning, can be rationalized as revealing the distribution of individual waiting time distributions. This is precisely correct when there is no significant “epidemic” process in which individuals’ actions may be triggered indirectly by the initial shock via the influence of previously active individuals. On the other hand, Schweitzer and Mach SchweitzerMach have indeed reported about the epidemics in donation behavior. In order to verify that there is no contradiction involved, one has to consider the time scales explicitely. As shown in SchweitzerMach , the epidemic dynamics is effective mostly for early times, i.e. close to the maximum of daily donations () and disappeared already at about (January 20). The current analysis, on the other hand, holds only for the long term dynamics and provides a reasonable fit only for times , where epidemic influences are indeed negligible, in agreement with the derivation of (4).
The precise mapping between the power law decay of the rate of activity to the power law distribution of waiting times is thus valid only in the sub-critical regime characterized by a branching ratio less than HSbasic02 ; SorHelm2003 ; cranesoryoutube . In the critical regime where cascades of triggering occur, the power law decay in time of the rate of activity is renormalized by the social epidemic process HSbasic02 . The precise mapping or its renormalized version apply, for instance, in the relaxation of the rate of downloads after the publication of an interview SornetteJohansenOriginalInternaut , in the relaxation dynamics of book sales on Amazon.com and video views on YouTubeTM SornetteAmazonPRL ; Deschatres ; cranesoryoutube , in the dynamics of visitations of a major news portal Dezso_et_al_06 , and in the decay of popularity of internet blogs posts Leskovec_et_al_07 , as well as in the relaxation of financial volatility after a peak VolMRW .
As a second point, we’d like to give an interpretation of the behavior observed after January 20, i.e. in the tail of the relaxation of the donation rate after the main peak of activity. In accordance with the theoretical prediction Grinstein1 , we observed a “highly attentive regime” characterized by , i.e. the effective rate of performing tasks is larger than the rate of arriving tasks. Different from the early times (at about the maximum of donations per day) where herding played the dominant role, people donating at later times were really in the regime to act on purpose (“attention”), rather than being “forced” to donate.
We argue that the “highly attentive regime” is caused by an effective increase in , rather than by an effective decrease in , and that the increase in is the result of an extensive media coverage after the tsunami desaster. By being continuously exposed to the devastating effects of the tsunami, individuals which have not donated so far have seen their execution donation rate renormalized upwards into what could be called the “highly attentive” regime , from what appears to be the more ubiquitous “overburdened” regime .
Rather than increasing the effective rate of performing tasks, one could argue that a large part of the donations were not triggered by the tsunami itself, but by the intense media coverage that extended continuously over the period covered by our data. This would then predict a broad distribution of “task arrival times” spanning the whole time interval over which the media was highly active. But, together with the usual “overburdened” regime leading to a slower relaxation of the donation rate with exponent , this would create an even slower decay of the relaxation rate, given roughly by the convolution of the broad distribution of media-triggered task arrival times with the slow response to each of them. We conclude that this cannot be the explanation for the much faster decay (4). The impact of the media attention is most likely to result in the creation of a “highly attentive regime,” leading to an increased focus placed on this donation “task”, quantified by . The next step is to validate our hypothesis on a different data set, which we proceed to perform in the next section.
V Preliminary validation using YouTube data
To our knowledge, the tsunami donation data provides the first empirical example of the second predicted regime 111After this paper was made available online, we were informed by the authors of a paper on bloggers behavior that they also found an exponent larger than 2 in their data. M Mitrovic, B. Tadic: Bloggers Behavior and Emergent Communities in Blog Space, European Physical Journal B (2010). Compared with the exponents of the power law rate of responses to shocks in human societies discussed above which are all of the order of or smaller than , the tsunami donation experiment is arguably the only one with such exceptional media coverage, both in intensity and duration. We conjecture that the intense pressure by the combined media led to an effective increase of the rate of execution of this donation “task.” Our conjecture can be formulated more generally as follows.
Conjecture 1
-
1.
If a social activity following a singular task presented at approximately the same time to a population enjoys continuous media exposure or is subjected to other persistent attention grasping processes, we should expect it to decay according to (4) (as predicted by (2)) if social interactions can be neglected (corresponding to the exogenous sub-critical regime, in the classification of Ref. cranesoryoutube ).
-
2.
Reciprocally, if an activity following some shock is observed to decay according to (4), one should expect to find evidence for continuous media exposure or for other mechanisms promoting the “highly attentive” regime.
In the following, we discuss a preliminary verification of the second element of conjecture 1. By analyzing the relaxation response of the daily view counts for nearly 5 million videos on the popular video sharing website YouTube, we performed an ex post investigation to determine whether data with the characteristic relaxation signature of could be clearly linked to events which received significant media focus. Briefly, each video is described by a timeseries of its daily view count, collected each day over a period of up to 1.5 years. We extract the relaxation exponents using a least-squares fit on the logarithm of the data. A full description of this data and the methodology used for analysis has been previously reported in cranesoryoutube . Selecting timeseries whose daily view count experiences a burst followed by a relaxation best fit given by
| (5) |
where is the daily view count and , returns matching videos.
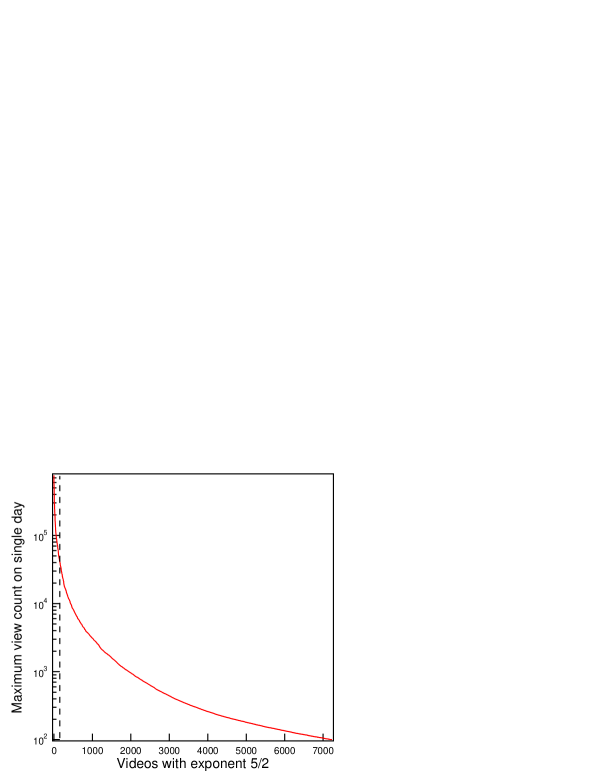
Figure 3 shows the videos which are ranked according to the maximum view count received on a single day. As a condition for the application of the conjecture, we should only consider the videos which experienced a large, sudden “burst” of activity, since this ensures that social interactions can be neglected and the relaxation dynamics falls into the exogenous sub-critical regime according to the classification of Ref. cranesoryoutube . We thus focus our attention on the top 124 videos that each received more than views on a single day, as delineated with the dashed verticle line in Figure 3.
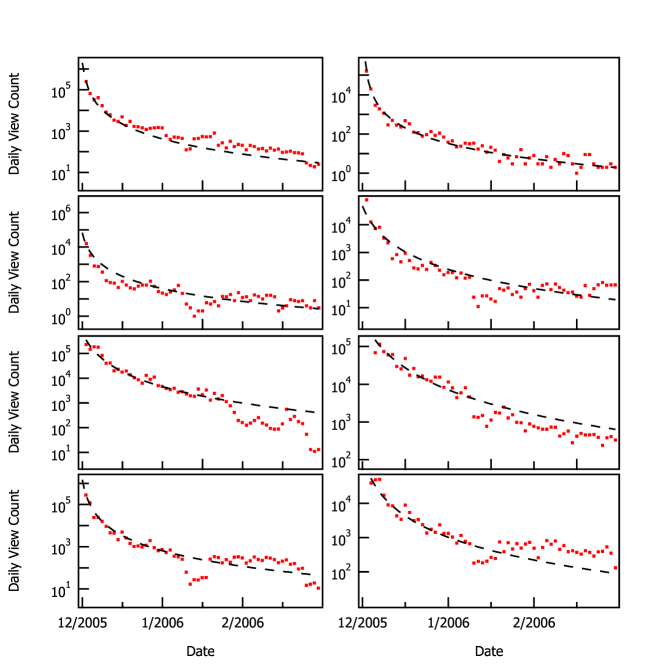
While it is not possible to detail the context and content of each of the 124 videos, some very clear trends emerge. Examining these videos carefully, we find that 37 () refer to items for which we could find news articles or press releases. Of these, 24 () refer directly to news events (political figures, celebrities, etc), 5 () are related to movie releases, and the most interesting result is that 8 () are on the topic of Saddam Hussein’s execution. The dynamics for these last eight videos are shown in figure 4, and we see they are very similar indeed to the donation data.
While these results certainly do not prove our conjecture that media focus can modulate our innate task execution rate , they support our interpretation and provide plausible evidence that such a mechanism could be responsible for the observed exponent value of in the empirical data. This conclusion is further supported by the fact that an exhaustive analysis of our entire YouTube database reveals that the typical decays of views are characterized by exponents clustering around three values , and , which have been understood as respectively associated with endogenous critical, exogenous critical and exogenous subcritical regimes cranesoryoutube . The value found here is thus very atypical and its observation associated with particular “highly attentive” regimes is particularly revealing.
VI Conclusion and Outlook
The contributions of the present work are (i) the empirical support for the newly proposed regime describing individual waiting time distributions and (ii) the further support provided to the interpretation that this regime results from a media enhanced task execution rate that modifies the distribution with exponent to a thinner tailed distribution with larger exponent . These results open a number of possibilities to quantitative studies on the manipulation of execution rates of ensembles of individuals. A more rigorous test of this approach would search for “singular events” which propose some “task” to be completed, and determine whether one can obtain some quantitative measure of attention grasping mechanisms in the form of search queries, video views, purchases, downloads, or some other suitably well-defined quantity. While we believe we have found strong evidence supporting our claim to have observed a new regime governing individual dynamics, designing an experiment to test the conjecture a priori would provide direct evidence.
Finally, this work emphasizes the important contributions that can be made to understanding individual waiting time distributions by investigating the dynamical collective response to “shocks” or other events with a clearly identifiable footprint in time. While other studies have implicitly used this approach to rationalize their data, we do not believe this point has been stressed, or that this approach has been fully exploited in the literature. It may not be per se surprising that media focus can enhance our implicit rate for taking action. However, it is quite remarkable that this can produce clearly identifiable signatures in the dynamics of collective action. Hence, these findings may open a new frontier for the quantitative study of individual and social activity.
Further work would involve combination of similar data for other comparable activities, such as for the Haiti earthquake in January 12, 2010, but combined with social studies, such as questionnaires, interviews and other tools probing the real motivation and media exposure of donors. The Haiti disaster could also be a good testing case, as much of the media coverage consisted of descriptions of mishandling the international help, and such coverage could, according to our reasoning, significantly decrease the donations.
References
- (1) Eckmann, J.-P., E. Moses and D. Sergi, Proc. Nat. Acad. Sci. USA, 101(40), 14333-14337 (2004).
- (2) A.-L. Barabási, Nature 435, 207 (2005).
- (3) Oliveira, J.G. and A.-L. Barabási, Nature 437, 1251 (2005).
- (4) Vazquez, A., J. G. Oliveira, Z. Dezso, K. I. Goh, I. Kondor, and A. L. Barabasi, Physical Review E 73, 036127 (2006).
- (5) Grinstein, G. and R. Linsker, Phys. Rev. E 77, 012101 (2008).
- (6) Schweitzer, F. and R. Mach, PLoS ONE 3(1): e1458. doi:10.1371/journal.pone.0001458 (2008).
- (7) Grinstein, G. and R. Linsker, Phys. Rev. Lett. 97, 130201 (2006).
- (8) Crane, R. and D. Sornette, Proc. Nat. Acad. Sci. USA 105 (41), 15649-15653 (2008).
- (9) Johansen, A. and D. Sornette, Physica A, 276, (1-2), 338-345, (2000).
- (10) Sornette, D., F. Deschatres, T. Gilbert, and Y. Ageon, Phys. Rev. Lett. 93, 228701 (2004).
- (11) Deschatres, F. and D. Sornette, Phys. Rev. E 72, 016112 (2005).
- (12) Dezso, Z., E. Almaas, A. Lukacs, B. Racz, I. Szakadat, A.-L. Barabasi, Phys. Rev. E 73, 066132 (2006).
- (13) Leskovec, J., M. McGlohon, C. Faloutsos, N. Glance and M. Hurst, preprint http://arxiv.org/abs/0704.2803
- (14) Helmstetter, A. and D. Sornette, J. Geophys. Res. 107, NO. B10, 2237, doi:10.1029/2001JB001580 (2002).
- (15) Sornette, D. and A. Helmstetter, Physica A 318 (3-4), 577-591 (2003).
- (16) Sornette, D., Y. Malevergne and J.-F. Muzy, Risk 16 (2), 67-71 (2003) [http://arXiv.org/abs/cond-mat/0204626].