On a Second Critical Point in the First Order Metal - Insulator Transitions
Abstract
For the first order Metal Insulator Transitions we show that together with the d.c conductance zero there is a second critical point, where the dielectric constant becomes zero and further turns negative. At this point the metallic reflectivity sharply increases. The two points can be separated by a Phase Separation State in a 3D disordered system, but may tend to merge in 2D. For illustration we evaluate the dielectric function in a simple effective medium approximation and show that at the second point it turns negative. We reproduce the experimental data on a typical Mott insulator like MnO, demonstrating the presence of the two points clearly. We discuss other experiments for studies of the phase separation state and a similar phase separation in superconductors with insulating inclusions.
pacs:
71.30.+h,71.55.Jv,74.25.Dw, 78.20.CiThe charge transport and Metal Insulator Transitions (MIT) in disordered systems have been discussed in many papers PWA ; gangof4 ; Finkelstein , reviewsLee ; review-mit and booksMott ; Altshuler ; Stauffer ; Bergman . The initial discussion resulted in agreement that at the transition is completely described by the dc conduction as a function of the Fermi level at . This is true for second order MIT, where simultaneously with the vanishing of the conductance vanishes also the real part of the dielectric function. It is negative in the metallic state, positive in the dielectric one and there is no phase separation in this case. Here we show that in a first order MIT in composites the dc conduction is not enough and the dc dielectric constant has to be considered in order to make the description complete. We will show that in a first order MIT in the composites, in disordered thermodynamically metastable 3-D systems, there can be an intermediate two phase region separating the metallic state from the dielectric one, both at and at finite temperatures. We will consider such a metal - dielectric composite with a metallic volume fraction , but our results are relevant for other first order MIT in homogeneous systems, due to the nucleation of metallic inclusions in the dielectric matrix under pressure for example. In a composite, grains of the both components are always present for any metallic volume fraction and and the resistance drop occurs at a volume fraction different from the dielectric function sign change and in different samples made with different metallic volume fractions. Under pressure due to different compressibility a composite irreversibly can undergo both transitions. To illustrate this we show a non-composite example of the phase separation in the Mott insulator MnO kondo-x-ray , patterson , MnO . It demonstrates both the resistance drop near 90 Gpa and subsequent reflectance sharp increase, which becomes pressure independent at 127GPareflectance-MnO . The data fromMnO are given in Fig.1and a detailed discussion of MIT in MnO is given in kunes-nature .
I Specific Phase Separation State
A metallic 3D sample is screening any static electric fields as well as the electron-electron interaction. Let be the metallic volume fraction threshold for the first non zero conductance to appear. From the percolation theory is known that often the values of for 3-D systems are smaller than 0.5 and are different for various models Stauffer We will prove now for 3-D composites that in a first order MIT in the range of values the sample can be conducting but not screening the external static electric fields. Just above the sample is in a larger part made of dielectric grains, which form an infinite cluster of a larger volume than the volume of the metallic infinite cluster, provided that . The two coexisting infinite clusters represent a specific type of phase separation state. Due to the topological structure of the infinite clusters in a disordered system such phase separation is clearly different from a layered one for example. When placed in the external static electric field of a capacitor, such a sample, being in a large part dielectric, becomes polarized with non-zero volume polarization. This volume polarization requires energy for creating the positive energy density in the polarized infinite dielectric cluster, which is equal to , where is the real part of the static (zero frequency) dielectric constant of the sample. The real part of is certainly positive due to the work done for polarizing the sample and not negative as it is in a metal. Thus, we have demonstrated that the phase with both, conductance and volume polarization is not a metal, nor a dielectric and represents a specific phase separation state. The data presented in Fig.1 show a separation state as a result of a first order MIT in a different system - MnO, which is not a composite and the metallic phase appears gradually due to nucleation.The resistance drop is near 94 GPa (phases dB1+B8 in Fig.1, B1 for rocksalt, dB1 for a rhombohedral distortion of B1, and B8 for NiAs)). The further increase of the metallic volume fraction breaks the last links between the large dielectric clusters and all dielectric inclusions become eventually disconnected near 127 GPa. Near this point the sample becomes a metallic bulk with isolated dielectric inclusions. The bulk metal has negative dielectric constant and at this point (the disappearance of the infinite dielectric cluster) the static dielectric constant turns from positive to negative. The reflectance is pressure independent above 127 GPa in the bulk metal region. Due to the tunnelling of the electrons(holes) and the hybridization of the wave functions of the large dielectric clusters the real critical point is at values different from the geometric dielectric percolation threshold. To illustrate this second critical point we applied here a simple version of the Effective Medium Approximation (EMA) to evaluate the dielectric function. Let us mention that EMA is limited in precision and is one among many similar ones differing in the detailsBergman ; EMA .
II Experimental characterization
Experimentally one can expect in a first order MIT the metallic reflectance to decrease sharply below this second critical point , which is different from the sharp resistance drop point . This is also the case with the observed metallic luster in the successive measurements of the same material MnOkondo-x-ray ; patterson ; MnO . Therefore below the critical point the reflectivity decreases sharply due to the transmission of the infinite dielectric cluster and specific plasmons passing through the connected system of tunnels in the metal. The d.c. polarization should appear below the point in static electric field in a capacitor and experiments on its critical behavior are of considerable interest as well as experiments on the behavior of the ac currents dissipation in the region, where infinite clusters emerge or disappear. The small dielectric inclusions in the metal will reduce eddy currents dissipation at small frequencies, like in external time dependent magnetic field. When the metal concentration decreases and becomes , this eddy currents dissipation would have a feature due to the change in the topology of the dielectric inclusions and the appearance of the infinite dielectric cluster, which also marks the bulk metallic volume reduction. Thus the eddy currents signal of a coil will show a variation near the second critical point. Another experiment can be carried out in the phase separation state, where one may encounter different sound velocities related to the two infinite clusters with different type of bondingHg . In general, we have shown that the dielectric function have a second critical point at , where the real part of the static becomes negative entering the metallic state region. When this critical point does not coincide with the vanishing dc conduction there will be an intermediate two phase region. In a quasi 2D system made out of parallel infinite metallic cylinders such phase separation does not exist at all. In a first order MIT the phase separation region was observed in various Mott insulators like in the MnO room temperature MIT transition shown here.
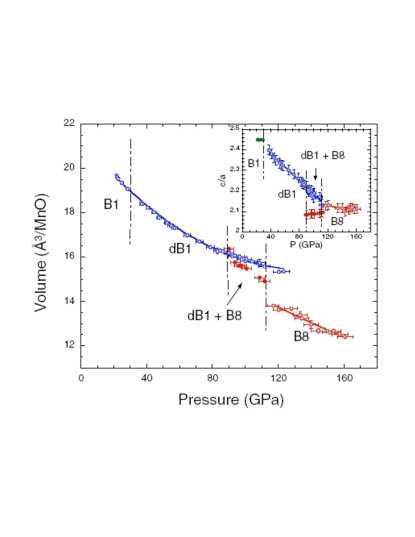
The experimental data of referenceMnO reproduced in the Fig.1 present a volume range in the pressure - volume diagram separating the metallic and the insulating phases of MnO and showing % volume difference. It corresponds to the difference in the metallic volume fraction between the two critical points mentioned above for the case of the composites.
III Two types of extended states
What describes the phase separation state in the range of concentrations? The metallic phase is well defined in the metallic side and the insulating phase is as well defined (see further) in the small metallic fraction region . In the intermediate range one have coexistence of the two phases in the form of two infinite clusters. Remarkably in this region there is also coexistence of two different types of extended states-metallic ones threading the infinite metallic cluster and dielectric ones based on the infinite dielectric cluster. In the dielectric type of extended states between the top and bottom mobility edges, an electron (hole), when injected in the dielectric cluster can cross the sample as well as it can in the metallic one. For in the metallic phase only metallic type of extended states exists and the sample conductivity is metallic. For in the dielectric phase only dielectric type of extended states is present and due to the gap, the sample is an insulator at . In the vicinity of at metallic component states go from localized to delocalized following scaling laws as described by the Localization TheoryPWA ; gangof4 ; review-mit . In the Table.1, the static order parameters values are displayed for all states. The symbol is the isotropic d.c. polarization value.
| Insulator | Phase separation state | Metal |
|---|---|---|
IV The Second Critical Point
In this section we show how the second critical point appears. The two infinite clusters and the electronic states based on metallic or dielectric grains and clusters of grains are determined quantum mechanically and not just geometrically. The description also involves the polarization properties of both, the metal and the insulator -. Eventually the exact form of the metal fraction dependence of the conductance and the dielectric function and the values of the critical points can vary depending on the models for the calculation. We will use Drude type form of , which is appropriate for illustration purposes. The EMA describes both critical points for the conductance and for the dielectric function and this is enough to demonstrate how the two critical points appear. A simple version of (EMA) (e.g. not accounting for various shapes or coatings of the grains) for the conductivity of the composite has the form Bergman equation:
| (1) |
When the first component is a metal and the second component is an insulator this equation gives us the first critical point , which is usually assumed to be the point where the metal insulator transition happens. Next we find the static dielectric constant Stroud for the same system using the same equation as above, but with instead of and for the metal, the dielectric being marked . We neglect here all spectral behavior of the dielectric (and the metal) by assuming a constant . For an ideal metal the static dielectric constant is infinite and negative. The above equation gives us of an ideal metal in a dielectric in the form:
| (2) |
Thus, the ideal metal in a composite with any insulator has a static dielectric constant, which has a pole at the first critical point . For a real metal in a composite with a dielectric the pole is shifted up in the complex frequency plane and turns into a maximum and eventually becomes negative. We take the real metal dielectric function in the Drude form:
| (3) |
Here the plasma frequency is defined by the electronic concentration of the metal, which is proportional to the metal content . The relaxation rate is typically one order of magnitude less than the plasma frequency. It may depend, however, strongly on the temperature or the pressure. Using the EMA equation above for the effective dielectric function of the composite we find
| (4) |
Here the function has the form:
| (5) |
This formula is illustrated in Fig.2, which shows the real part of the dielectric function and the critical line, where it becomes negative is clearly visible.
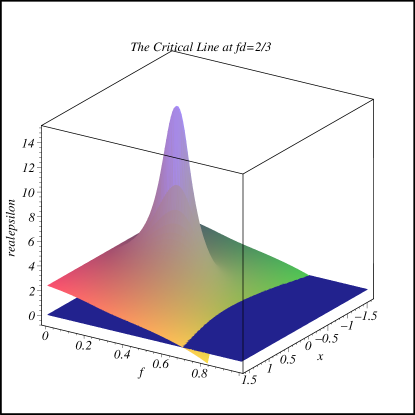
The maximum in the region around clearly is related to the pole (see Eq.2) in the static effective dielectric constant of a composite made out of an ideal metal and a dielectric. For a real metal it turns into a finite maximum as expected.
V The Superconductor Dielectric Composites
The treatment we applied for the intermediate state region is not limited to the metal - insulator composites and MIT. It is easily seen that the non-magnetic dielectric and superconductor composites show similar behavior. Starting with a small volume fraction of the superconductor f we see that the first superconductive paths appear at the concentration . The magnetic susceptibility will sense the presence of the superconductor component, but the complete screening of the external magnetic field will occur only at , when there is no longer an infinite dielectric cluster present. In the intermediate range of concentrations the obtained phase is a superconductor and at the same time has a nonzero static polarization as a dielectric in the range of temperatures . This picture is summarized in Table.2, where we assume a diamagnetic dielectric. The interphase energy at the two critical points is due to the expulsion of the electric field penetrating the dielectric but in addition to it now there is present the magnetic field energy density due to the magnetic field screening, which may be partial near and complete at .
| Dielectric | Phase Separation State | Superconductor |
|---|---|---|
The penetration depth is proportional to the
superfluid density and when it is zero the depth is
infinite. At low levels of doping the insulating phase of the
cuprates plays the role of the dielectric component. At K in
the still superconductive samples the magnetic field penetration
depth increases infinitely in the region of small doping
concentrations p less then , the critical concentration
being close to it. Eventually the samples are
superconductive with low magnetic field penetration depth equal to
infinity. This absence of complete screening of the magnetic field
is marked in Table.2 as negative susceptibility,
but not vanishing .
Concluding, we
have shown that in the first order MIT there can be a second
critical point, where . Between the two
critical points there is a phase separation state, where two types
of extended states are present. In the same way in the
Superconductor Dielectric composites the dielectric phase and the
superconductive one can be also separated by an intermediate
phase. The second critical point where the infinite dielectric
cluster appears in the metallic phase is observable by means of
static polarization studies, by magnetic susceptibility and by
eddy currents loss experiments, not to mention different sound
velocities and the features in the reflection and/or transmission
of electromagnetic waves.
We would like to thank Prof. V.L. Pokrovsky for stimulating
discussions and mentioning the recent work of the late A. M.
Dykhne Dykhne . We also thank Dr A. McMahan and the authors
of MnO for kindly giving us permission to reproduce their
results in Fig.1.
References
- (1) P. W. Anderson, Phys. Rev. 109, 1492 (1958).
- (2) E. Abrahams, P.W. Anderson, D.C. Licciardello, and T.V. Ramakrishnan, Phys. Rev. Lett. 42, 673 (1979).
- (3) Alexander Punnoose, Alexander M. Finkel’stein, Science 310, 289 (2005). Phys. Rev. Lett. 97, 117004 (2006).
- (4) P.A. Lee, and T.V. Ramakrishnan, Rev. Mod. Phys. 57, 287 (1985).
- (5) M. Imada, A. Fujimori and Y. Tokura, Rev. Mod. Phys. 70, 1039 (1998).
- (6) N.F. Mott, Metal-Insulator Transitions (Taylor and Francis, London),p 17,p 156,p 192 (1990).
- (7) B. L. Altshuler and A. G. Aronov, Modern Problems in Condensed Matter Physics (Elsevier, North Holland, 1985), chap. Electron-Electron Interactions in Disordered Systems, pp. 1 - 151.
- (8) D. Stauffer and A. Aharony, Introduction to Percolation Theory, second edition (Taylor and Francis, London)p.13 (1992).
- (9) D.J. Bergman, and D. Stroud, ”Physical properties of macroscopically inhomogeneous media,” in Solid State Physics, Vol. 46, edited by H. Ehrenreich and D. Turnbull (Academic, Boston), p.147, (1992).
- (10) T. Kondo, T. Yagi, Y. Syono, Y. Noguchi, T. Atou, T. Kikegawa, and O. Shimomura, J. Appl. Phys. 87, 4153 (2000).
- (11) J. R. Patterson, C. M. Aracne, D. D. Jackson, V. Malba, and S.T. Weir, P. A. Baker and Y. K. Vohra, Phys. Rev. B69,220101(R) (2004).
- (12) C. S. Yoo, B. Maddox, J.-H. P. Klepeis, V. Iota, W. Evans, and A.McMahan, M.Y. Hu, P. Chow, M. Somayazulu, and D.Ha usermann,R.T.Scalettar and W. E. Pickett, Phys. Rev. Lett. 94,115502 (2005).
- (13) Yoshimi Mita, Daisuke Izaki, Michihiro Kobayashi and Shoichi Endo, Phys. Rev. B71, 100101(R) (2005d).
- (14) Jan Kunes, Alexey V. Lukoyanov, Vladimir I. Anisimov, Richard T. Scalettar, and Warren E. Pickett, Nature Materials 7, 198 (2008).
- (15) F. G. Shin, W. L. Tsui and Y. Y. Yeung, J. Mater. Sci. Lett.8, 1383 (1989).
- (16) D. Ishikawa, M. Inui, K. Matsuda, K. Tamura, S. Tsutsui, and A.Q. R. Baron, Phys. Rev. Lett. 93, 097801 (2004).
- (17) D. Stroud, Phys. Rev. B 19, 1783 (1979)
- (18) A. M. Dykhne and A. A. Snarskii J.Exp. Theor. Phys..