Identifications of Five INTEGRAL Sources via Optical Spectroscopy
Abstract
The International Gamma-Ray Astrophysics Laboratory (INTEGRAL) is discovering hundreds of new hard X-ray sources, many of which remain unidentified. We report on optical spectroscopy of five such sources for which X-ray observations at lower energies (0.5–10 keV) and higher angular resolutions than INTEGRAL have allowed for unique optical counterparts to be located. We find that IGR J16426+6536 and IGR J22292+6647 are Type 1 Seyfert active galactic nuclei (with IGR J16426+6536 further classified as a Seyfert 1.5) which have redshifts of and , respectively. IGR J18308–1232 is identified as a cataclysmic variable (CV), and we confirm a previous identification of IGR J19267+1325 as a magnetic CV. IGR J18214–1318 is identified as an obscured high mass X-ray binary (HMXB), which are systems thought to have a compact object embedded in the stellar wind of a massive star. We combine Chandra fluxes with distances based on the optical observations to calculate X-ray luminosities of the HMXB and CVs, finding for IGR J18214–1318, for IGR J18308–1232, and for IGR J19267+1325.
Subject headings:
galaxies: Seyfert — novae, cataclysmic variables — techniques: spectroscopic — X-rays: binaries — X-rays: individual (IGR J16426+6536, IGR J18214–1318, IGR J18308–1232, IGR J19267+1325, IGR J22292+6647)1. Introduction
Since its launch on October 17, 2002, the International Gamma-Ray Astrophysics Laboratory (INTEGRAL) has discovered hundreds of new hard X-ray sources. According to the most recent census, of the 500 sources detected in hard X-rays at energies greater than 20 keV, 214 had not been well-studied (or even detected in most cases) before (Bodaghee et al., 2007). These new sources are called “IGR” sources, for INTEGRAL Gamma-Ray sources. Of these IGR sources, 50 had been identified as active galactic nuclei (AGN), 32 as high-mass X-ray binaries (HMXBs), 6 as low-mass X-ray binaries (LMXBs), and 15 as sources such as cataclysmic variables (CVs), supernova remnants, and anomalous X-ray pulsars, leaving 111 unclassified. Since this last census, much work has been done to identify the 50% of unclassified IGR sources (corresponding to 25% of all sources detected by INTEGRAL). Many have been identified as AGN, LMXBs and HMXBs, as well as relatively rare systems such as heavily absorbed (i.e., “obscured”) supergiant HMXBs, supergiant fast X-ray transients, and Intermediate Polar (IP) CVs (e.g., Masetti et al., 2009; Chaty et al., 2008).
INTEGRAL is particularly well suited for finding such systems. Part of INTEGRAL’s Core Program involved scans of the Galactic plane (Winkler et al., 2003). One expects to find HMXBs here, as they consist of a neutron star or black hole accreting from a short-lived massive star, which would not be expected to move far from its birthplace in star forming regions of the Galactic plane. Other instruments observing at lower energies could not easily find these because of the obscuring dust and gas in the plane. Furthermore, objects such as obscured HMXBs, which consist of a compact object embedded in the stellar wind of a supergiant star, suffer obscuration not only from the intervening medium, but also from local absorption (e.g., Rodriguez et al., 2003; Walter et al., 2006). In addition, INTEGRAL has found disproportionately many IP CVs according to the previously known population statistics, since they emit at these high energies more than non-magnetic CVs or polar CVs (Barlow et al., 2006). Currently, less than 10% of known CVs are magnetic. The majority of these are polars, so called since they show polarization of optical flux. These are systems in which the white dwarf has a magnetic field strong enough to synchronize the orbital period of the binary with the spin of the white dwarf. Intermediate polars have a weaker magnetic field that is not strong enough to cause synchronization, but they do display variability associated with the rotation of the white dwarf. Of the at least 15 CVs detected by INTEGRAL, the vast majority are these relatively rare magnetic systems, with most of those being IPs.
Identification of these unclassified sources requires observations of the source in the optical and/or infrared. The IBIS imager on INTEGRAL is unique among hard X-ray/soft -ray detectors in that it is able to locate point sources with an accuracy on the order of arcminutes (Gros et al., 2003). To identify a unique optical or infrared counterpart, however, the error circle must be reduced to the level of (sub-)arcseconds. Thus, from the INTEGRAL position, soft X-ray telescopes, such as the Chandra X-ray Observatory, XMM-Newton, and Swift observe the region. This typically allows identification of the optical counterpart, which can then be studied to yield an identification (e.g., Tomsick et al., 2006).
| IGR Name | Optical Counterpart | RA (J2000) | Dec (J2000) | Start Time (UT) | Exposure Time (s) |
|---|---|---|---|---|---|
| J16426+6536 | USNO-B1.0 1555–0172189 | 2008 June 29, 4.0 h | 3600 | ||
| J18214–1318 | USNO-B1.0 0766–0475700 | 2008 June 28, 9.3 h | 3600 | ||
| J18308–1232 | USNO-B1.0 0774–0551687 | 2008 June 30, 8.8 h | 1800 | ||
| J19267+1325 | USNO-B1.0 1033–0440651 | 2008 June 28, 10.6 h | 3 600 | ||
| J22292+6647 | USNO-B1.0 1567–0242133 | 2008 June 30, 11.2 h | 827 |
2. Observations and Analysis
We targeted INTEGRAL sources that had also been observed in soft X-rays, which allowed the position to be narrowed down from the INTEGRAL error circle (on the order of arcminutes) to less than . IGR J18214–1318, IGR J19267+1325, and IGR J18308–1232 were observed by the Chandra X-Ray Observatory, providing positions with 90% confidence uncertainties of (Tomsick et al. 2008 a, b and in preparation). IGR J22292+6647 was observed by Swift (Landi et al., 2007), which reduced the position uncertainty to . IGR J16426+6536 has one XMM-Newton source with a uncertainty of (Ibarra et al., 2008a) and two ROSAT sources within the INTEGRAL error circle. Optical/infrared counterparts for IGR J18214–1318 and IGR J19267+1325 were reported with the X-ray observations. We searched the USNO-B1.0 and 2MASS catalogs for optical and infrared counterparts to the other sources. IGR J18308–1232 and IGR J22292+6647 both have one optical/infrared counterpart. The X-ray sources associated with IGR J16426+6536 have three possible optical/infrared counterparts, and we observed the brightest optical source in the XMM-Newton error circle.
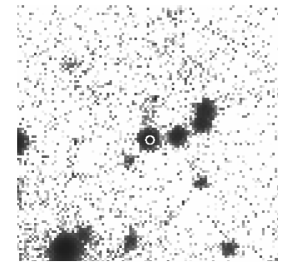
Images from the Digitized Sky Survey (DSS) showed a clear counterpart for all sources except for IGR J18214–1318. A clear image of this source is seen in Figure 1, from the medium resolution spectrometer TFOSC ( Faint Object Spectrometer and Camera) which is mounted on the Russian-Turkish 1.5 m telescope (RTT150) located at Turkish National Observatory (TUG), Antalya, Turkey. The camera is equipped with a , m pixel ( pixel-1) Fairchild 447BI CCD chip. We took three 300s observations of the field in B, V, R and I filters on 2008 August 22, and only detected the source in the I band. After the standard bias and flat correction, we obtained the instrumental I magnitude of the counterpart using DAOPHOT in MIDAS. We carried out point spread function photometry for the corrected image to obtain the instrumental magnitude, and calibrated it by comparing to the magnitudes of the reference stars, which were obtained from the USNO-B1.0 catalog.
Between 2008 June 28 and June 30 we carried out spectroscopy of these targets with the RC Spectrograph on the 4-meter Mayall Telescope at Kitt Peak National Observatory. We provide an observing log in Table 1. We used a slit width of , and rotated the slit to the parallactic angle. The wavelength range covered from to , with a dispersion of and a resolution of .
After applying the flat field correction, subtracting the bias and dark current, and removing cosmic rays, we extracted the spectra with standard procedures in IRAF (Image Reduction and Analysis Facility). We observed arc lamps for wavelength calibration immediately preceding and following each source. Checking against background sky lines, we find agreement to within . We also observed spectrophotometric standard stars Feige 110 and BD for flux calibration. Conditions were variable throughout each night, making the flux calibration somewhat uncertain. We report fluxes using a single observation of Feige 110 for calibration because it falls roughly halfway between the other observations in flux, presumably providing a good indication of the average conditions. Note that using the other observations can change the flux measurements by up to 15%. All lines and their parameters are reported in Table 2.
| Line | Quantity111EW is the equivalent width in and line flux is measured in units of . Errors are at the 68% confidence level and upper limits are at the 90% confidence level. Note that the line flux is also subject to the 15% systematic uncertainty in overall flux level, which is not included here. The wavelength from the Gaussian fit is , and the error is dominated by the uncertainty in wavelength calibration. | J16426+6536 | J18214–1318222The fitted wavelengths of the Paschen and He I absorption lines are , , , , , , , , . | J18308–1232 | J19267+1325 | J22292+6647 |
| (AGN) | (HMXB) | (CV) | (CV) | (AGN) | ||
| EW | ||||||
| Flux | 333 is blended with lines. | |||||
| … | ||||||
| EW | … | … | ||||
| Flux | … | … | ||||
| … | … | |||||
| EW | … | … | … | … | ||
| Flux | … | … | … | … | ||
| … | … | … | … | |||
| EW | … | … | … | … | ||
| Flux | … | … | … | … | ||
| … | … | … | … | |||
| EW | … | … | … | … | ||
| Flux | … | … | … | … | ||
| … | … | … | … | |||
| EW | … | … | … | … | ||
| Flux | … | … | … | … | ||
| … | … | … | … | |||
| EW | … | … | … | … | ||
| Flux | … | … | … | … | ||
| … | … | … | … | |||
| EW | … | … | … | … | ||
| Flux | … | … | … | … | ||
| … | … | … | … | |||
| EW | … | … | … | |||
| Flux | … | … | … | |||
| … | … | … | ||||
| EW | … | … | … | |||
| Flux | … | … | … | |||
| … | … | … | ||||
| EW | … | … | … | |||
| Flux | … | … | … | |||
| … | … | … | ||||
| EW | … | … | … | … | ||
| Flux | … | … | … | … | ||
| … | … | … | … |
3. Results
3.1. IGR J16426+6536
IGR J16426+6536 has one XMM-Newton slew source at , (Ibarra et al., 2008a) and two ROSAT sources within the INTEGRAL error circle. There is one USNO-B1.0 source within one of the ROSAT error circles and none in the other. The XMM-Newton source has two USNO-B1.0 sources within its () error circle. We observed the brighter of the two sources (USNO-B1.0 1555–0172189) in the XMM-Newton error circle.
This spectrum has redshifted emission lines, including broad Balmer lines and narrow forbidden lines (Figure 2a), indicating that this source is a Seyfert 1 AGN. This is congruous with its position out of the Galactic plane, with Galactic coordinates . To further classify the source, we use the scheme described in Winkler (1992), namely, the ratio of the flux in to that in [OIII], where these are the laboratory wavelengths. After dereddening the spectral lines using the Galactic absorption from Schlegel et al. (1998) along with the extinction law from Cardelli et al. (1989), we find , which makes this a Seyfert 1.5 galaxy. Calculating the redshift from both and [OIII] and averaging, we find . Though we did not observe all possible sources within the INTEGRAL error circle, the identification of the one we did observe as an AGN allows us to conclude that this is very likely the counterpart of the INTEGRAL source. We note that Masetti et al. (2009) came to similar conclusions from their spectroscopic analysis. Although we identify it as a Seyfert 1.5, while they find that it is a Seyfert 1, there were several months between the observations, and this level of variability is not unheard-of (e.g., Tran et al., 1992).
With a redshift of , this source is at a luminosity distance of , using , , and . We calculate the mass of the supermassive black hole using the relations described in Wu et al. (2004) and Kaspi et al. (2000). To use the relations, we recalculate the luminosity distance with the cosmological parameters used in those papers, , , and . This gives , from which we find the luminosity in (dereddened as described above), . Combining this with the rest-frame FWHM velocity of the broad line region (from ), , gives a black hole mass of .
![[Uncaptioned image]](/html/0903.1302/assets/x2.png)
![[Uncaptioned image]](/html/0903.1302/assets/x3.png)
![[Uncaptioned image]](/html/0903.1302/assets/x4.png)


3.2. IGR J18214–1318
IGR J18214–1318 was observed by Chandra, which found one source at , , coinciding with USNO-B1.0 0766–0475700. The X-ray spectrum yields a column density of and . With a Galactic hydrogen column density of , this implies a local absorption of , which was suggested to be from the wind of a high-mass star (Tomsick et al., 2008a). This source was also observed by Swift, which found a position and photon index consistent with that obtained by Chandra, but a lower hydrogen column density of , indicating that is variable in this source (Rodriguez et al., 2009).
We find that the optical spectrum has a very reddened continuum (Figure 2b). From this, we infer that the source is relatively distant, since significant reddening would be expected for a distant source in the Galactic plane (). Convolving the spectrum with the filters from Bessell (1990), we find , , , where the errors are from the 15% systematic uncertainty in flux. We note that the I band magnitude from the photometric observation made at TUG, , agrees within the errors. We first consider the possibility that the source is a CV. Combining the apparent magnitudes with typical absolute magnitudes for CVs ( and (Masetti et al., 2009)) and a range of extinctions from results in distances that range from . This distance range is far too close to account for the observed amount of extinction (assuming the optical extinction is interstellar). Furthermore, the spectrum lacks emission lines, while a CV would be expected to have strong emission lines. These arguments allow us to rule out the possibility that the source is a CV. Applying the same procedure to check for the possibility of an LMXB, we combined the apparent magnitude, the typical absolute magnitude for an LMXB ( and (van Paradijs & McClintock, 1995)), and the same range of extinctions. In this case, the distances range from , which are not inconsistent with the amount of extinction, but the source has a hard X-ray spectrum which would be very unusual for an LMXB (Muno et al., 2004).


These considerations allow us to conclude that it must be either an HMXB or a symbiotic star system. In Figure 3, spectral shapes typical of both are interpolated from the colors in Ducati et al. (2001) and plotted with extinctions of , using the extinction relations from Cardelli et al. (1989). The infrared magnitudes from DENIS and 2MASS (reported in Tomsick et al. 2008a) along with the optical spectrum for the source are overlayed. These show that the data are consistent with a B0V star or an O9I star with extinction of . The model K2III star spectra provide a worse fit to the data. The J-band magnitude requires an extinction of , while the optical data are consistent with . Further evidence supporting an HMXB is shown in Figure 4, which is a close up of the near-infrared region of the spectrum. Several Paschen absorption lines and one neutral Helium line are observed (although P14 is not observed). These lines are indicative of an O or B star (e.g., Carroll & Ostlie, 2006; Munari & Tomasella, 1999). As a check, we indicate the positions of the Ca II triplet with the dot-dashed lines, and confirm that the absorption is more consistent with Paschen lines. In addition, other Paschen lines (P12, P11, P10, P9) are clearly detected. We also note that the upper limit on the equivalent width of is consistent with equivalent widths of OB stars (Leitherer, 1988). Thus, we firmly identify the optical source as a high mass star.
The Galactic hydrogen column density combined with the relationship between visual extinction and hydrogen column density detailed in Predehl & Schmitt (1995) () gives a visual extinction of , which is consistent with the extinction inferred from colors for stars of type B0V and O9I. Considering a range of spectral types and using absolute magnitudes from Cox (2000) with , we find distances that range from for B0V to O5V stars and for A0I to O9I stars, giving an overall distance range of . However, using the general relation of (Tielens, 2005), the lower limit of visual extinction () implies a distance of at least 6 kpc, suggesting that the most likely distance range is . In addition, the observed variation in hydrogen column density argues in favor of a supergiant (and, therefore, a distance near the upper end of the range), since HMXBs with supergiant companions are known to show variations in column density (Prat et al., 2008).
3.3. IGR J18308–1232
IGR J18308–1232 was observed by Chandra, which found one source at , , coinciding with USNO-B1.0 0774–0551687. The X-ray spectrum gives a hydrogen column density of and , where the errors are at the 90% confidence level (Tomsick et al. in prep.). Note that this source is referred to as IGR J18307–1232 in Ibarra et al. (2008b), where they report an XMM-Newton slew-survey counterpart at , with a uncertainty of , consistent with the Chandra position.
The optical spectrum shows Balmer, Paschen, and HeI lines in emission (Figure 2c), all consistent with . These lines are typical of both CVs (Warner, 1995) and LMXBs (van Paradijs & McClintock, 1995), but the hard X-ray spectrum is typical for a CV, and, as noted above, is not expected for an LMXB. Using the hydrogen column density and the aforementioned relation between column density and visual extinction, we find . Convolving the spectrum as described in the previous section gives , , and . Combining the magnitude and visual extinction with the typical values for CV absolute magnitudes listed above, we find . Masetti et al. (2009) also identify this as a CV. They find a larger distance, although it agrees within the uncertainties, of as a result of using USNO-A2.0 magnitudes (which are fainter for this source) and a different method of calculating extinction (which resulted in lower extinction).
3.4. IGR J19267+1325
IGR J19267+1325 was observed by Chandra, which found one source at , , coinciding with USNO-B1.0 1033–044065. Although the source for IGR J19267+1325 falls just outside of the confidence INTEGRAL error circle, it was the only bright X-ray source Chandra found in the area. Fitting the X-ray spectrum gives and (Tomsick et al., 2008b).
The optical spectrum shows Balmer, Paschen, HeI and HeII emission lines at (Figure 2d). These lines, along with the hard X-ray spectrum, suggest a CV nature (e.g., Masetti et al., 2009). Furthermore, the HeII line and large equivalent width of () suggest a magnetic CV (Silber, 1992)444See http://asd.gsfc.nasa.gov/Koji.Mukai/iphome/issues/heii.html. Steeghs et al. (2008) and Masetti et al. (2009) also identify this source as a probable magnetic CV. The equivalent widths reported by Masetti et al. (2009) match our findings (), while Steeghs et al. (2008) find an equivalent width of equal to . Based on two measurements from the INT Photometric H-Alpha Survey (IPHAS), they find moderate short term variability in of 0.1 mag, which is not large enough to explain the difference in equivalent widths found, though there could be a larger maximum variability. Based on the detection of a periodicity in Swift-XRT data, Evans et al. (2008) confirm that it is a magnetic CV, identifying it as an intermediate polar CV. Using the hydrogen column density and the relation between visual extinction and hydrogen column density mentioned previously, we find . Convolving the spectrum as described above, we find magnitudes of , , and . We combine the magnitude and visual extinction with the typical values of CVs above to find . This distance is lower than that found by Masetti et al. (2009), , for the same reasons as for IGR J18308–1232.
3.5. IGR J22292+6647
IGR J22292+6647 was observed by Swift, which found a source at , , coinciding with USNO-B1.0 1567–0242133. There is a radio source at this location (87GB 222741.2+663124), described as an asymmetric double (Gregory & Condon, 1991), which suggests this may be an AGN (Landi et al., 2007, 2009). This is congruous with its position out of the Galactic plane, with Galactic coordinates
The optical spectrum has a flat continuum dominated by one strong and broad emission line (Figure 2e). If we assume that the strong feature is , we find a redshift of . The broad hydrogen line indicates this is a Seyfert 1 AGN.
4. Discussion and Conclusions
We have firm identifications of five IGR sources. IGR J18308–1232 and IGR J19267+1325 are CVs. They have distances on the order of a couple hundred parsecs, which is typical of other CVs detected by INTEGRAL (e.g., Barlow et al., 2006; Masetti et al., 2006). The column densities from X-ray observations imply extinctions that are rather large given the distances we find. For example, IGR J19267+1325 is found to have 1.4 magnitudes of extinction at a distance of 250 pc, while typical average extinction is (Tielens, 2005). However, more reasonable distances and extinctions are feasible within the uncertainties. This could also mean that some of the X-ray absorption is intrinsic to the source. The identification of IGR J19267+1325 as a magnetic CV is not surprising, and, in fact, IGR J18308–1232 was also identified as a magnetic CV by Masetti et al. (2009). As a result of the hard X-rays emitted by magnetic systems, the majority of CVs detected by INTEGRAL have been magnetic (Barlow et al., 2006) even though such systems only comprise of the CV population as a whole. INTEGRAL observations of CVs, therefore, unambiguously show that the magnetic field plays an important role in the hard X-ray emission of these systems.
We conclude that IGR J18214–1318 is an obscured HMXB. It has an extremely reddened continuum, indicating much absorption along the line of sight, which implies a fairly large distance. It has absorption lines that are typical of a high mass star, and the observed colors and flux are consistent with an extincted high mass main sequence or supergiant star (and the variable hydrogen column density may argue for the latter). In addition, the X-ray spectrum shows significant local absorption, which could come from a wind from a high mass star. An infrared spectrum may be one way to further classify the companion star. The infrared suffers less extinction than the optical, and more features would be observable. A higher resolution spectrum would also be valuable in identifying the luminosity and exact spectral class.
It is instructive to compare the X-ray luminosities for the above sources to typical HMXBs and CVs. In the Chandra band (0.3–10 keV), IGR J18214–1318 has an unabsorbed 0.3–10 keV flux of (Tomsick et al., 2008a). Taking a distance of , this results in a luminosity of . This is consistent with the average properties of neutron star HMXBs given in van Paradijs & McClintock (1995). While the hard X-ray spectrum and luminosity argue for a neutron star, detection of X-ray pulsations would be necessary to rule out a black hole. IGR J18308–1232 has (Tomsick et al. in prep.), which implies a luminosity of with our calculated distance (220 pc). The INTEGRAL flux from of and (Bird et al., 2007) implies a luminosity of . We compare this luminosity to known intermediate polar CVs in Suleimanov et al. (2005) over the energy range , assuming the flux from the range where we lack data is of the same order as that from the Chandra range (a reasonable assumption, given the spectral shapes in the above paper). Our luminosity falls in the range of known IP CVs, although it is on the low end. IGR J19267+1325 is a similar case. Its flux in the Chandra band is (Tomsick et al., 2008b), which implies a luminosity of with our calculated distance (250 pc). The INTEGRAL flux of and (Bird et al., 2007) implies a luminosity of . Again, this results in a total luminosity on the low end of the range of known CV luminosities. These low values could be an indication that the distances lie at the high end of our error range.
IGR J16426+6536 and IGR J22292+6647 are Seyfert 1 AGN, and IGR J16426+6536 is further classified as a Seyfert 1.5 AGN. The 127 INTEGRAL-detected Seyferts (which have an average redshift ) and the 34 IGR Seyferts (with average redshift ) are plotted in Figure 5. With redshifts of and , respectively, IGR J16426+6536 and IGR J22292+6647 are considerably more distant than average. In fact, IGR J16426+6536 is an interesting case since it is the highest redshift IGR Seyfert, though there is one INTEGRAL-detected Seyfert, PKS 0637–752, with a higher redshift of .

References
- Barlow et al. (2006) Barlow, E. J., Knigge, C., Bird, A. J., Dean, A. J., Clark, D. J., Hill, A. B., Molina, M., & Sguera, V., 2006, MNRAS, 372, 224
- Bessell (1990) Bessell, M. S., 1990, PASP, 102, 1181
- Bird et al. (2007) Bird, A. J., et al., 2007, ApJSS, 170, 175
- Bodaghee et al. (2007) Bodaghee, A., et al., 2007, A&A, 467, 585
- Cardelli et al. (1989) Cardelli, J. A., Clayton, G. C., & Mathis, J. S., 1989, ApJ, 345, 245
- Carroll & Ostlie (2006) Carroll, B. W. & Ostlie, D. A., 2006, An Introduction to Modern Astrophysics (2nd Edition) (San Francisco: Addison-Wesley)
- Chaty et al. (2008) Chaty, S., Rahoui, F., Foellmi, C., Tomsick, J. A., Rodriguez, J., & Walter, R., 2008, A&A, 484, 783
- Cox (2000) Cox, A. N., 2000, Allen’s Astrophysical Quantities (4th ed.; New York: Springer)
- Ducati et al. (2001) Ducati, J. R., Bevilacqua, C. M., Rembold, S. B., & Ribeiro, D., 2001, ApJ, 558, 309
- Evans et al. (2008) Evans, P. A., Beardmore, A. P., & Osborne, J .P., 2008, The Astronomer’s Telegram, 1669
- Gregory & Condon (1991) Gregory, P. C., & Condon, J. J., 1991, ApJS, 75, 1011
- Gros et al. (2003) Gros, A., Goldwurm, A., Cadolle-Bel, M., Goldoni, P., Rodriguez, J., Foschini, L., Del Santo, M., & Blay, P., 2003, A&A, 411, L179
- Ibarra et al. (2008a) Ibarra, A., Kuulkers, E., & Saxton, R., 2008a, The Astronomer’s Telegram, 1397
- Ibarra et al. (2008b) Ibarra, A., Kuulkers, E., & Saxton, R., 2008b, The Astronomer’s Telegram, 1527
- Kaspi et al. (2000) Kaspi, S., Smith, P. S., Netzer, H., Maoz, D., Jannuzi, B. T., & Giveon, U., 2000, ApJ, 533, 631
- Landi et al. (2007) Landi, R., et al., 2007, The Astronomer’s Telegram, 1288
- Landi et al. (2009) Landi, R., et al., 2009, A&A, 493, 893L
- Leitherer (1988) Leitherer, C., 1988, ApJ, 326, 356
- Masetti et al. (2006) Masetti, N., et al., 2006, A&A, 459, 21
- Masetti et al. (2009) Masetti, N., et al., 2009, arXiv:0811.4085
- Munari & Tomasella (1999) Munari, U., & Tomasella, L., 1999, A&AS, 137, 521
- Muno et al. (2004) Muno, M. P., et al., 2004, ApJ, 613, 1179
- Prat et al. (2008) Prat, L., Rodriguez, J., Hannikainen, D. C., & Shaw, S. E., 2008, MNRAS, 389, 301
- Predehl & Schmitt (1995) Predehl, P. & Schmitt, J.H.M.M., 1995, A&A, 293, 889
- Rodriguez et al. (2003) Rodriguez, J., Tomsick, J. A., Foschini, L., Walter, R., Goldwurm, A., Corbel, S., & Kaaret, P., 2003, A&A, 407, L41
- Rodriguez et al. (2009) Rodriguez, J., Tomsick, J. A., & Chaty, S., 2009, A&A, 494, 417R
- Schlegel et al. (1998) Schlegel, D. J., Finkbeiner, D. P., & Davis, M., 1998, ApJ, 500, 525
- Silber (1992) Silber, A. D., 1992, Ph. D. Thesis, MIT.
- Steeghs et al. (2008) Steeghs, D., Knigge, C., Drew, J., Unruh, Y., Greimel, R., & the IPHAS Consortium., 2008, The Astronomer’s Telegram, 1653
- Suleimanov et al. (2005) Suleimanov, V., Revnivtsev, M., & Ritter, H., 2005, A&A, 435, 191
- Tielens (2005) Tielens, A. G. G. M., 2005, The Physics and Chemistry of the Interstellar Medium (Cambridge: Cambridge University Press)
- Tomsick et al. (2006) Tomsick, J. A., Chaty, S., Rodriguez, J., Foschini, L., Walter, R., & Kaaret, P., 2006, ApJ, 647, 1309
- Tomsick et al. (2008a) Tomsick, J. A., Chaty, S., Rodriguez, J.,Walter, R., & Kaaret, P., 2008a, ApJ, 685, 1143
- Tomsick et al. (2008b) Tomsick, J. A., Rodriguez, J., Chaty, S., Walter, R., & Kaaret, P., 2008b, The Astronomer’s Telegram, 1649
- Tran et al. (1992) Tran, H. D., Osterbrock, D. E., & Martel, A., 1992, AJ, 104, 6
- van Paradijs & McClintock (1995) van Paradijs, J. & McClintock, J. E., 1995, Optical and ultraviolet observations of X-ray binaries, in: X-ray Binaries, ed. W. H. G. Lewin, J. van Paradijs, & E. P. J. van den Heuvel (Cambridge: Cambridge University Press), 58
- Walter et al. (2006) Walter, R., et al., 2006, A&A, 453, 133
- Warner (1995) Warner, B. 1995, Cataclysmic Variable Stars (Cambridge: Cambridge University Press)
- Winkler et al. (2003) Winkler, C., et al., 2003, A&A, 411, L1
- Wu et al. (2004) Wu, X.-B., Wang, R., Kong, M. Z., Liu, F. K., & Han, J. L., 2004, A&A, 424, 793