The Properties of the Heterogeneous Shakhbazyan Groups of Galaxies in the SDSS
Abstract
We present a systematic study of the sub-sample of Shakhbazyan groups (SHKs) covered by the Sloan Digital Sky Survey Data Release–5 (SDSS-5). SHKs probe an environment with characteristics which are intermediate between those of loose and very compact groups. Surprisingly, we found that several groups identifying algorithms (e.g. Berlind et al., 2006, Tago et al., 2008) miss this type of structures. Using the SDSS-5 spectroscopic data and the photometric redshifts derived in D’Abrusco et al. (2007), we identified possible group members in photometric redshift space and derived, for each group, several individual properties (richness, size, mean photometric redshift, fraction of red galaxies etc.). We also combined pointed and stacked Rosat All Sky Survey (RASS) data to investigate the X-ray luminosities of these systems. Our study confirms that the majority of groups are physical entities with richness in the range 3–13 galaxies, and properties ranging between those of loose and compact groups. We confirm that SHK groups are richer in early-type galaxies than the surrounding environment and the field, as expected from the morphology-density relation and from the selection of groups of red galaxies. Furthermore, our work supports the existence of two sub-classes of structures, the first one being formed by compact and isolated groups and the second formed by extended structures. We suggest that while the first class of objects dwells in less dense regions like the outer parts of clusters or the field, possibly sharing the properties of Hickson Compact Groups, the more extended structures represent a mixture of [core+halo] configurations and cores of rich clusters. X-ray luminosities for SHKs are generally consistent with these results and with the expectations for the relation, but also suggest the velocity dispersions reported in literature are underestimated for some of the richest systems.
keywords:
cosmology: Large scale structure – galaxies: clusters: individual (Shakhbazyan groups) – galaxies: evolution – galaxies: photometry.1 INTRODUCTION
In spite of the fact that small groups of galaxies are the most common extragalactic environment (Tully & Fisher, 1987), their physical properties, origin and evolution are still poorly understood. This is particularly true in the low mass density regime, id est in that environmental range which bridges the field with the richest (clusters) or most compact (e.g. Hickson Compact groups, hereafter HCGs) structures, mainly due to observational selection effects which render the poor and less compact structures much more difficult to detect and study, especially at intermediate and high redshift.
The lack of statistically complete and well measured samples of groups at different redshifts is very unfortunate since they are needed to constrain all models for the formation and evolution of cosmic structures. For instance, in the hierarchical models it would be crucial to measure the epoch of groups formation and to discriminate whether it does or doesn’t exist a down-sizing effect for which high-mass groups at high z form before lower-mass ones at lower z. Other crucial issues are related to the dynamical status of groups, to their relaxation time and to how the evolution of the structure affects that of their galaxy members.
Groups of galaxies are very numerous and show spatial densities of about (Bahcall, 1999). Their gravitational potential wells are about as deep as that of individual galaxies, whose random velocities in such systems are a few hundreds of . Under these conditions, galaxies strongly interact both among themselves and with the global potential of the group. Therefore, groups of galaxies are collisional systems evolving toward virial equilibrium through collisions and collisionless interactions among their member galaxies.
Groups of galaxies seem to evolve assuming different configurations: loose, [core+halo] and compact. Compact
configurations form in the last phases of the evolving process and their final byproduct is a giant galaxy
surrounded by a hot X-ray emitting gas halo, with properties similar to those of a giant elliptical galaxy, known
as Fossil Group (Vikhlinin
et al., 1999; Jones et al., 2003; Mendes de
Oliveira, 2006; Mendes de
Oliveira & Carrasco, 2007).
Numerical simulations have extensively shown that structures of high spatial densities undergo
fast dynamical evolution and merging (Barnes, 1985, 1989; Mamon, 1987; Bode
et al., 1993; Diaferio et al., 1993; Diaferio
et al., 1994; Governato et al., 1996). The expected number of groups inferred through theoretical
estimates of crossing times is in contrast with the observed one. The Secondary Infall Scenario suggested by (Gunn &
Gott, 1972)
and then reconsidered by (Mamon, 1996, 2000, 2007), allows a secondary collapse of
galaxies surrounding the formed structures. This secondary aggregation provides the structures a way to increase
their lifetimes, according with the observed number of groups of galaxies (Diaferio
et al., 1994).
In this paper we adopt a homogeneous and systematic approach to the study of Shakhbazyan groups of galaxies (hereafter SHK), using the unique SDSS data-set, in order to analyse their properties and compare them to those of the environment and of the well studied HCGs.
Shakhbazyan groups of galaxies were originally defined as compact groups of mainly red compact galaxies and selected by visually inspecting the printed version of the First Palomar Sky Survey (POSS) using rather empirical and ill defined selection criteria:
- They must contain 5-15 member galaxies.
- Each galaxy’s apparent magnitude in the POSS red band must be comprised between .
- They are compact, id est the relative distances of the member galaxies are typically only times the characteristic diameter of a member galaxy.
- Almost all galaxies must be extremely red; there must not be more than blue galaxies.
- Galaxies are compact (high surface brightness and border not diffuse).
- The group must be isolated.
The search lead to a long series of papers (Shakhbazyan, 1973; Shakhbazyan & Petrosyan, 1974; Baier et al., 1974; Petrosian, 1974; Baier & Tiersch, 1975, 1976; Bayer & Tiersch, 1976; Baier & Tiersch, 1978, 1979; Petrosyan, 1978) identifying a total of 377 groups which, due to the poor resolution of the POSS and to the compactness requirement, appeared initially to be strongly contaminated by stars mistaken for galaxies and, furthermore, resulted affected by many systematics (Thompson, 1976; Kirshner & Malumuth, 1980; Kodaira et al., 1988; del Olmo et al., 1995). In addition, among the selection criteria, there is no explicit criterion on the magnitude range of the member galaxies, which hence depends on the magnitude of the group’s brightest galaxy. This suggests that SHK groups may be a heterogeneous collection of loose nearby groups and denser distant ones. For these reasons, until a few years ago, the SHK sample has not received as much attention as other more homogeneous and better defined samples such as, for instance, the Hickson’s compact groups one.
Detailed photometry by Thompson (1976); Kodaira et al. (1988, 1991); del Olmo
et al. (1995) showed that in most cases, those which were
believed compact and very red galaxies (e.g. Robinson &
Wampler, 1973; Mirzoyan et al., 1975; Tiersch, 1976), were rather normal elliptical and S0 galaxies with slightly redder
colours () than field ones.
Furthermore, even though some contamination by stars is indeed present, many of the objects initially suspected
to be stars were found to be galaxies.
The extensive and detailed studies by Tiersch,
(Tiersch, 1976; Tiersch et al., 1993, 1994; Tiersch
et al., 1995; Tiersch et al., 1996a; Tiersch
et al., 1996b; Tiersch et al., 1999a; Tiersch
et al., 1999b, 2002),
Tovmassian (Tovmassian et al., 1998, 1999a, 1999b; Tovmassian &
Tiersch, 2001; Tovmassian
et al., 2003a; Tovmassian et al., 2003b; Tovmassian
et al., 2004, 2005a, 2005b, 2005c, 2006; Tovmassian et al., 2007)
and collaborators of a sub-set of 44
groups, have shown that SHKs form a rather intriguing class of physically bound and moderately compact structures. The
spatial densities of SHKs found in these works, span a wide range: from slightly higher than those of loose groups
() up to values comparable to the cores of rich clusters or HCGs
() for .
Therefore the observed spatial densities of SHKs imply that they may be at different stages of dynamical and morphological
evolution and can be used both to probe the effects of environment on galaxy evolution and to constrain the formation
mechanisms of low richness structures.
The paper is structured as it follows. In Sect. 2 we describe the data.
In Sect. 3 and 4 we describe in some detail the method used to derive the
observable quantities, while in Sect. 5 we summarize the main properties of each group in our
sample individually. Sect. 6 is dedicated to the discussion of the global properties of the sample,
while in Sect. 7 we draw our conclusions.
Throughout this paper we assume a standard cosmology with , and .
2 THE DATA
For our analysis we made use of the Sloan Digital Sky Survey - Data release 5 (hereafter SDSS-DR5) public archive. The SDSS covers 8,000 sq. deg. of the celestial sphere in 5 bands (with effective wavelengths, u=3540 Å, g=4760 Å, r=6280 Å, i=7690 Å, z=9250 Å) and is complemented by an extensive spectroscopic survey providing spectroscopic redshifts for galaxies111A detailed description of the survey can be found at http://www.sdss.org/dr5..
The spectroscopic survey is almost complete for galaxies with , while
at fainter light levels it includes mainly Luminous Red Galaxies (LRG) (Eisenstein
et al., 2001).
214 SHKs lie in the sky area covered by the SDSS-DR5.
Among these 214 groups, we selected those for which a first order estimate of the distance was possible, averaging
either spectroscopic redshifts from literature, or spectroscopic redshifts available in the SDSS-DR5, for
all galaxies contained in the catalogue by (Stoll et al., 1993a, b, 1994a, 1994b; Stoll
et al., 1996a, b, c, 1997a, 1997b, 1997c)222Since the submission of the paper SDSS-DR7 was released. Nevertheless we note that DR7 has a different footprint from DR5 and thus would not increase the number of available redshifts per group. However it may be used in future works to extend the sample size.. The same process has been used to derive the
centroids of the groups using the coordinates of the single galaxies in the catalogue by Stoll et al.
This selection resulted in a spectroscopic sub-sample of 58 SHK groups on which this paper is focused. Groups’
positions and mean spectroscopic redshift estimates are listed in Table 1.
| SHK | RA | DEC | n | References | |||
|---|---|---|---|---|---|---|---|
| 1 | 10:55:05.70 | +40:27:30.0 | 0.117 | 7 | 0.10 | 0.01 | Kirshner, R. P. & Malumuth, E. M., 1980, ApJ, 236, 366 |
| 5 | 11:17:06.75 | +54:55:10.3 | 0.139 | 5 | 0.14 | 0.01 | Stoll, D., et al., 1993-1999, AN |
| 6 | 11:18:49.10 | +51:44:37.2 | 0.079 | 3 | 0.09 | 0.02 | SDSS DR5 |
| 8 | 16:03:41.02 | +52:21:13.7 | 0.110 | 6 | 0.12 | 0.02 | Tovmassian, M., et al., 2005, A&A, 439, 973 |
| 10 | 14:10:48.93 | +46:15:54.2 | 0.130 | 5 | 0.13 | 0.01 | SDSS DR5 |
| 11 | 14:11:06.15 | +44:43:05.8 | 0.095 | 4 | 0.10 | 0.01 | SDSS DR5 |
| 14 | 14:25:19.75 | +47:15:09.5 | 0.073 | 7 | 0.08 | 0.01 | Tovmassian, M., et al., 2005, A&A, 439, 973 |
| 19 | 13:28:30.20 | +15:50:25.6 | 0.069 | 4 | 0.02 | 0.02 | Tovmassian, M., et al., 2005, A&A, 439, 973 |
| 22 | 15:45:43.74 | +55:06:58.8 | 0.082 | 4 | 0.06 | 0.02 | Tovmassian, M., et al., 2005, A&A, 439, 973 |
| 29 | 16:08:42.16 | +52:26:19.0 | 0.035 | 1 | 0.17 | 0.02 | Tovmassian, H. M., et al., 1999, ApJ, 523, 87 |
| 31 | 00:58:17.99 | +13:54:38.7 | 0.187 | 5 | 0.18 | 0.02 | Tovmassian, H. M., et al., 2003, RMxAA, 39, 275 |
| 54 | 10:40:32.96 | +40:14:38.3 | 0.086 | 6 | 0.06 | 0.01 | SDSS DR5 |
| 55 | 10:43:34.89 | +48:22:30.4 | 0.143 | 1 | 0.13 | 0.01 | SDSS DR5 |
| 57 | 10:45:26.74 | +49:31:37.9 | 0.174 | 4 | 0.17 | 0.02 | SDSS DR5 |
| 60 | 11:24:35.75 | +40:25:43.0 | 0.108 | 4 | 0.16 | 0.01 | SDSS DR5 |
| 63 | 11:29:34.18 | +42:26:15.8 | 0.181 | 1 | 0.21 | 0.01 | SDSS DR5 |
| 65 | 11:30:48.45 | +35:02:49.4 | 0.185 | 2 | 0.14 | 0.02 | SDSS DR5 |
| 70 | 12:01:18.93 | +41:14:19.0 | 0.109 | 2 | 0.20 | 0.01 | SDSS DR5 |
| 74 | 14:21:06.05 | +43:03:46.7 | 0.104 | 8 | 0.12 | 0.02 | Tovmassian, H. M., et al., 2005, RMxAA, 39, 275 |
| 95 | 08:28:36.12 | +50:17:53.2 | 0.079 | 2 | 0.07 | 0.01 | SDSS DR5 |
| 96 | 08:37:54.46 | +52:37:23.6 | 0.097 | 1 | 0.11 | 0.01 | SDSS DR5 |
| 104 | 09:27:13.60 | +52:58:40.5 | 0.167 | 5 | 0.11 | 0.01 | Tovmassian, H. M., et al., 2007, RMxAA, 43, 45 |
| 120 | 11:04:28.47 | +35:52:50.6 | 0.070 | 7 | 0.13 | 0.02 | Tovmassian, H. M., et al., 2007, RMxAA, 43, 45 |
| 123 | 11:44:48.31 | +57:31:52.5 | 0.117 | 5 | 0.09 | 0.02 | SDSS DR5 |
| 128 | 13:19:55.36 | +55:45:21.7 | 0.145 | 2 | 0.14 | 0.02 | SDSS DR5 |
| 152 | 09:39:05.97 | +01:56:46.4 | 0.134 | 2 | 0.48 | – | SDSS DR5 |
| 154 | 11:22:53.28 | +01:06:46.3 | 0.073 | 6 | 0.08 | 0.02 | Tiersch, H. et al., 2002, A&A, 392, 33 |
| 181 | 08:28:01.06 | +28:15:56.3 | 0.093 | 8 | 0.10 | 0.02 | Tovmassian, H. M., et al., 2004, A&A, 415, 803 |
| 184 | 09:08:07.50 | +30:36:33.4 | 0.154 | 2 | 0.05 | – | SDSS DR5 |
| 186 | 09:22:52.08 | +28:55:25.2 | 0.077 | 3 | 0.08 | 0.02 | SDSS DR5 |
| 188 | 09:56:59.23 | +26:10:27.3 | 0.080 | 7 | 0.08 | 0.02 | Tovmassian, H. M., et al., 2005, RMxAA, 39, 275 |
| 191 | 10:48:09.20 | +31:28:51.7 | 0.118 | 12 | 0.13 | 0.01 | Tovmassian, H. M., et al., 2005, AN, 326, 362 |
| 202 | 12:19:47.53 | +28:24:13.5 | 0.028 | 9 | 0.02 | 0.01 | Stoll, D., et al., 1993-1999, AN |
| 205 | 12:35:23.55 | +27:34:45.7 | 0.096 | 7 | 0.12 | 0.02 | Stoll, D., et al., 1993-1999, AN |
| 213 | 13:45:12.24 | +26:53:44.0 | 0.058 | 1 | 0.10 | 0.02 | Stoll, D., et al., 1993-1999, AN |
| 218 | 14:33:39.13 | +26:41:02.6 | 0.095 | 1 | 0.09 | 0.02 | Tovmassian, H. M., et al., 1999, ApJ, 523, 87 |
| 223 | 15:49:42.86 | +29:09:37.5 | 0.083 | 10 | 0.09 | 0.02 | Tovmassian, H. M., et al., 2007, RMxAA, 43, 45 |
| 229 | 09:00:43.69 | +33:45:01.4 | 0.124 | 1 | 0.03 | 0.01 | SDSS DR5 |
| 231 | 10:01:41.81 | +38:18:44.1 | 0.146 | 1 | 0.14 | 0.01 | SDSS DR5 |
| 237 | 11:05:29.36 | +38:00:48.6 | 0.030 | 1 | 0.08 | 0.02 | Stoll, D., et al., 1993-1999, AN |
| 245 | 12:24:45.80 | +31:57:17.3 | 0.063 | 5 | 0.05 | 0.02 | Kodaira, K., et al., 1991, PASJ, 43, 169 |
| 248 | 13:12:16.40 | +36:11:17.4 | 0.271 | 1 | 0.18 | 0.01 | Tovmassian, H. M., et al., 1999, ApJ, 523, 87 |
| 251 | 13:36:54.80 | +36:49:37.7 | 0.061 | 6 | 0.05 | 0.02 | Tovmassian, H. M., et al., 2005, RMxAA, 39, 275 |
| 253 | 13:52:23.70 | +37:30:59.7 | 0.073 | 1 | 0.08 | 0.02 | Stoll, D., et al., 1993-1999, AN |
| 254 | 13:56:24.79 | +35:11:10.4 | 0.170 | 3 | 0.16 | 0.01 | SDSS DR5 |
| 258 | 15:23:39.93 | +32:24:12.8 | 0.032 | 1 | 0.17 | 0.02 | SDSS DR5 |
| 344 | 08:47:32.54 | +03:42:01.0 | 0.077 | 5 | 0.07 | 0.01 | Tovmassian, H. M., et al., 2004, A&A, 415, 803 |
| 346 | 09:15:10.16 | +05:14:21.4 | 0.135 | 1 | 0.13 | 0.02 | Tovmassian, H. M., et al., 1999, ApJ, 523, 87 |
| 348 | 09:26:35.17 | +03:26:39.7 | 0.088 | 8 | 0.09 | 0.02 | Tovmassian, H. M., et al., 2005, RMxAA, 39, 275 |
| 351 | 11:10:19.20 | +04:47:31.8 | 0.030 | 4 | 0.04 | 0.02 | SDSS DR5 |
| 352 | 11:21:37.95 | +02:53:20.2 | 0.049 | 1 | 0.05 | 0.02 | Tovmassian, H. M., et al., 1999, ApJ, 523, 87 |
| 355 | 13:12:11.33 | +07:18:28.8 | 0.093 | 4 | 0.10 | 0.01 | Stoll, D., et al., 1993-1999, AN |
| 357 | 13:42:10.29 | +02:13:42.5 | 0.077 | 21 | 0.08 | 0.02 | SDSS DR5 |
| 358 | 14:23:46.29 | +06:35:05.4 | 0.050 | 3 | 0.06 | 0.02 | SDSS DR5 |
| 359 | 14:29:56.51 | +18:50:20.0 | 0.033 | 1 | 0.10 | 0.02 | Tovmassian, H. M., et al., 1999, ApJ, 523, 87 |
| 360 | 15:41:26.72 | +04:44:09.7 | 0.108 | 8 | 0.12 | 0.01 | Tiersch, H. et al., 2002, A&A, 392, 33 |
| 371 | 11:43:33.32 | +21:53:57.0 | 0.130 | 1 | 0.13 | 0.02 | Tovmassian, H. M., et al., 1999, ApJ, 523, 87 |
| 376 | 13:56:34.42 | +23:21:48.5 | 0.067 | 10 | 0.02 | 0.02 | Tovmassian, H. M., et al., 2003, A&A, 401, 463 |
For each of these groups we extracted from DR5 all objects within a projected distance of 3 Mpc from the centroid of the group, in order to be able to study the prospective over-density in relation with the environment in which it dwells. This approach is different from the one often used to study compact groups such as HCGs, whose selection criteria (Hickson, 1982) completely isolates them from their environment, causing a loss of information about possible extended structures in which they are embedded (Palumbo et al., 1995; de Carvalho, 2000).
Due to the compactness selection criterion used, the original member lists of the Shakhbazyan groups were contaminated by stars mistaken for compact galaxies. The better resolution of the SDSS with respect to the older POSS data should itself ensure that many misclassified objects are removed from our lists. As an additional check we compared the reliability of the Star/Galaxy classification provided by the SDSS classification algorithm (PHOTO) (Lupton et al., 2001) with a second indicator introduced by Yasuda et al. (2001), relying on a series of SDSS photometric parameters and flags. The comparison lead to a rate of misclassification per cent which does not affect our results. Objects with conflicting classifications were excluded from our final catalogue.
Photometric redshifts for all galaxies within 3 Mpc were then extracted from the catalogue by D’Abrusco et al. (2007), which contains photometric estimates for objects in the SDSS brighter than , with , and with an accuracy of 333The photometric redshifts catalogues are publicly available at: http://people.na.infn.it/astroneural/catalogues.html.. We refer to the original paper for further details on how these redshifts were evaluated and for a thorough discussion of their accuracy. The decision of using photometric redshifts from D’Abrusco et al. (2007) has been driven by three main reasons: 1) their accuracy () is comparable or better than the SDSS estimates Photoz (Csabai et al. (2003), ) and Photoz2 (Oyaizu et al. (2008), ); 2) the low redshift range of our sample of SHK groups is accurately covered by the D’Abrusco et al. (2007) redshifts. PhotoZ and PhotoZ2 are instead less complete at low redshifts, due to the strict selection criteria of their samples. 3) the uncertainties in the D’Abrusco photo-z’s show a nearly gaussian distribution, with very few catastrophic outliers. This makes the choice of the latter sample preferable for our application.
3 THE METHOD
In order to address and investigate the properties of our sample of groups, we first checked each group
individually to verify the galaxy membership and compare it with the results presented in the literature.
We then derived a number of diagnostic tools (projected number density maps, radial profiles,
redshift distributions, colour–magnitude diagrams) as described in more detail in the following sections.
We labelled a group as a real structure if it satisfied the following two criteria:
- presence of an excess of galaxies in the projected distribution and radial profile plots;
- presence of a peak in the spectroscopic/photometric redshift distribution;
Since early-type galaxies in clusters and often in groups sit on well defined sequences (hereafter Red Sequence,
RS) in colour–magnitude diagrams (cf. Tanaka
et al., 2005; Bernardi
et al., 2003, and references therein), as an additional
check we verified the presence of a well-defined colour–magnitude relation (hereafter CMR). This check is
intended only to provide additional support to the presence of a group, as this relation is not necessarily well
defined in groups of galaxies but depends on their early-type galaxy content and on their evolutionary status.
It must be stressed that the presence of a peak in projected spatial or redshift distribution doesn’t
prove its physical reality, since, as showed by Mamon (1986); Walke &
Mamon (1989); McConnachie et al. (2008a) and
Díaz-Giménez et al. (2008), they might be chance alignments of galaxies along the line of sight within looser groups.
With “real groups” we hence indicate those structures which are not obvious superpositions
of background and foreground galaxies.
To investigate the global properties of the sample, we further estimated for each group, their richness, early-type fraction and angular size. Results for all groups are summarised in Table 2 444Diagnostic diagrams for all studied SHK groups can be found at: http//www.astro.ljmu.ac.uk/dc/Groups/SHK_Groups.. All the properties, unless explicitly stated, are estimated considering only the galaxies satisfying the following conditions:
-
1)
Radial distance selection: galaxies within a fixed radial distance (either or ) in the group rest-frame;
-
2)
Magnitude selection criterion: galaxies such that where is the magnitude of the brightest galaxy within ;
-
3)
Photometric redshift criterion: galaxies whose photometric redshift satisfy the condition ;
Since , last condition amounts to an uncertainty of , i.e. . Therefore we expect significant contamination by interlopers, which are later removed through a statistical approach. Notwithstanding this, the latter condition is very effective in increasing the S/N ratio, removing a large fraction of foreground and background galaxies.
Finally, to compare SHKs with the well studied HCGs, in an homogeneous way, we derived all the quantities
discussed below also for a sub-sample of 15 HCGs (HCG 17, 35, 43, 45, 47, 49, 50, 52, 57, 60, 66, 70, 71, 72,
73, 74, 75, 76, 81, 82) with falling within the SDSS area.
The lower limit for the redshift is applied in order to have overlapping redshift ranges with our SHK sample,
and to limit the area under investigation which, if too large, would reduce too much the S/N ratio.
Based on the analysis of the radial distributions, we defined three regions around each group’s centroid:
i) an inner one, within a projected radius of ;
ii) an annular, intermediate region, within a radius ;
iii) an annular outer region comprised between and which
defines what we shall call the “local background”.
We point out that a proper characterization of the sample properties should be performed using a physical aperture such as the virial radius (for its derivation see e.g appendix A of Mauduit & Mamon, 2007). Unfortunately at the moment the spectroscopic data available for SHK groups are very sparse and not sufficient to derive these apertures.555We are currently conducting a spectroscopic campaign to collect a proper sample of spectroscopic redshift and refine our analysis.
3.1 2-D Observables
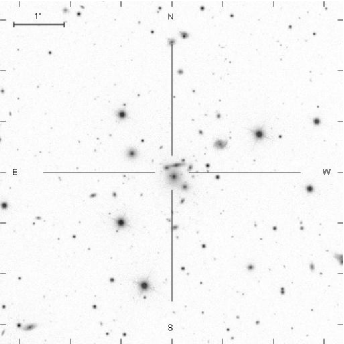
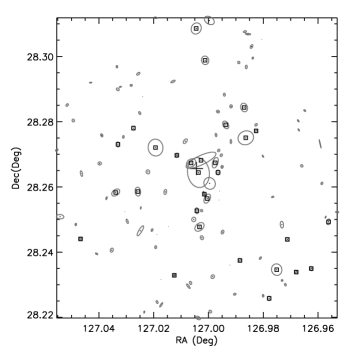
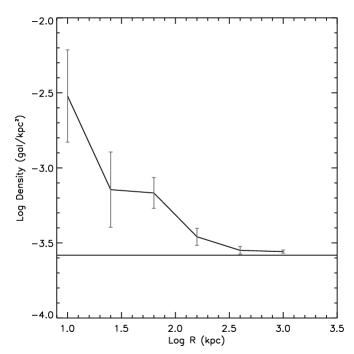
In order to test the presence of peaks in the galaxy distributions, we study their spatial distribution within the central 300 kpc. Candidate member objects are classified according to their photometric redshifts, in order to highlight the three-dimensional distribution of the candidate group members. We identify as candidate members all galaxies within from the mean spectroscopic redshift. In the upper panels of Fig.(1) an example for SHK 181 (right panel), together with the corresponding SDSS image (left panel), are shown. For each group we also derived a surface density map of all galaxies within a region of radius, with a resolution of in the group rest-frame. Density maps allow to validate the position of the nominal centroid of the group and to check for the presence of possible sub-clumps or more extended structures. A further tool, to verify the presence of a galaxy over-density is the number density radial profile. We measured radial profiles, for all SHK groups out to (Fig. 2), in order to sample the local background even in the presence of extended haloes.
We stress that even when the observables are projected quantities, we made use of the photometric redshift information, to remove foreground/background contaminants, thus effectively increasing the S/N ratio of our observables.
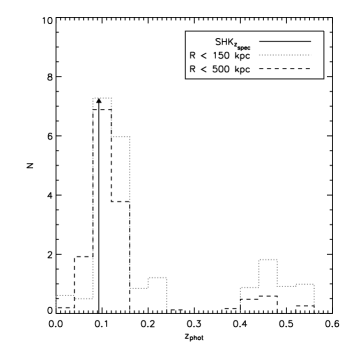
3.2 Observables in Photometric Redshift Space
Projected data are not sufficient to identify structures of low multiplicity, due to the contamination introduced by foreground/background galaxies. Unfortunately, because of fiber crowding, SDSS spectroscopic redshifts are too sparsely distributed to cover a significant number of objects in each group. Photometric redshifts, therefore, provide a unique tool to investigate the group redshift distributions. Fig. (3, left panel) shows an example of the excess in the photometric redshift distribution, revealing the presence of a 3D structure at the group position. We then estimated the mean photometric redshift of each group as the average of all galaxies within from the main peak of the distribution, within a projected distance of 150 kpc. A comparison between the mean spectroscopic and photometric redshift estimates for the SHKs and HCGs is shown in Fig. 4. It needs to be stressed that for all those groups which have not been subjected to targeted observations, the mean spectroscopic redshift is often based just on a few, or worse on only one galaxy, which may not be group member. This partly explains the discrepancies between the mean spectroscopic and photometric redshifts listed in Table 1 and discussed in more detail in §(5). Note that our photometric redshift selection criterion tends to sample larger volumes at higher redshifts, thus over-weighting background galaxies and skewing the overall distribution (including groups with compatible redshifts) toward slightly higher values. This effect, that depends on the redshift value and uncertainty, results in an average correction of which is already included in Figure 4.
In the end per cent of the groups have consistent spectroscopic and photometric redshifts. However per cent of them have discordant values, either due to the small number of spectroscopic data or to the presence of different structures superimposed along the line of sight. Since an incorrect estimate of the group mean redshift affects the areas of each considered region and all the measured quantities we excluded from our analysis those groups whose spectroscopic and photometric redshift’s estimates differ more than 666The number of discordant redshift represents an upper limit to the number of unconfirmed groups which is affected by the low spectroscopic completeness of SHKGs. While a few more groups may be recovered including galaxies with accordant spectroscopic redshifts (from SDSS or literature) not in the original Stoll et al. compilation, the small number ( per cent) will not significantly affect our results while introducing structures which do not necessarily agree with the original sample..
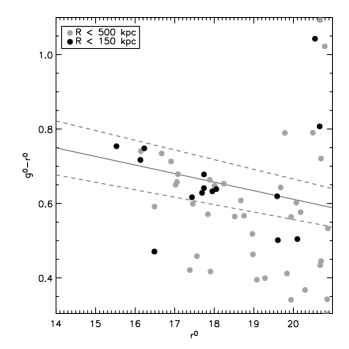
Finally we used Sloan dereddened model magnitudes k-corrected using Fukugita et al. (1995) models, to produce for each group colour–magnitude diagrams for galaxies within and for which . We stress that even when the number of available spectroscopic redshifts per group is low, the confirmation of the redshift of a group obtained through the use of photometric redshifts (necessary to calibrate the Red Sequence), assures an accuracy greater than the CMR intrinsic scatter. In Fig. (3, right panel) we show the colour–magnitude diagram of the group SHK 181.
4 GROUP PROPERTIES
4.1 Richness
We derived, for all SHK groups, richness estimates within and kpc.
Member galaxies have been selected as those matching simultaneously all three
criteria defined in §3, in order to allow a homogeneous comparison among the groups, sampling,
for all of them, approximately the same magnitude range. 777Note that the limit, adopted for
the estimate, is always within the completeness limit of the SDSS data for our redshift range.
The richness estimates, corrected for the local background, are reported in Table 2.
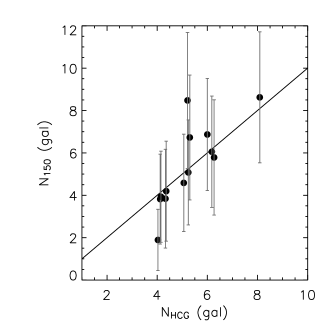
In Fig. (5) we present the comparison between the richness measurements performed for Hickson
groups by Hickson (1982); Hickson
et al. (1989); Hickson et al. (1992) and by us. We observe an overall agreement between the two
richness estimates, consistent within the uncertainties.


4.2 Surface Brightness Profile
As further information we extracted the surface brightness profile of each group, selecting galaxies matching the criteria defined in §3. Starting from the group centroid, we binned the data in annuli containing three galaxies and we calculated the average surface brightness in each one. The background level () was evaluated by averaging all the objects between and . The size of a group was arbitrarily defined as the radius where the surface brightness profile reaches . Resulting values are listed in Table 2. A modified estimate of the group size was also calculated changing the redshift constrain to , i.e. using as the reference redshift, which is more appropriate in cases where no spectroscopic redshift is available or our analysis shows that they are unreliable. Hereafter we’ll refer to this last size estimate as photometric, in contrast with the first one, which will be labelled as spectroscopic.
In Fig. 6 we compare our estimates of the physical properties of both SHKs (left panel) and HCGs (right panel), to those available in literature. Our size estimates are consistent with the HCGs sizes for per cent of the sample (). For the SHK sample, where sizes calculated according to photometric criteria are not available in literature, we compare with the virial radii of the groups measured by Tovmassian et al. (1999–2007) and Tiersch et al. (1994–2002). According to Tovmassian et al. (2005c) the virial radii generally don’t exceed , while the mean mass-weighted radial velocity dispersion is (Tovmassian et al., 2007), ranging from up to , thus implying dynamical crossing times varying from to (Tovmassian et al., 2005c; Tovmassian et al., 2007), on average shorter than what found for the HCGs (Hickson et al., 1992). While, for SHKs, we find a mild but significant correlation (correlation coefficient with per cent), with our sizes () measuring per cent of the virial radius, there is a large scatter due both to our purely photometric criteria as well as the heterogeneous accuracy of peculiar velocities available in literature, from which are calculated. It is worth noting that Tovmassian et al. call virial radius the deprojected harmonic mean galaxy separation (much smaller than the 100 over-density radius, usually defined as virial radius).


4.3 Galaxy Morphology
We have used as morphological indicator the distance from the g-i vs r red–sequence.
We utilised the models by T.Kodama (see Kodama &
Arimoto, 1997 for the original paper) in the SDSS bands for
several galaxy formation redshifts, whose slopes were in accordance with our CMR points. We considered as
early-type galaxies those within 0.15 mag from the best–fitting model in our colour–magnitude diagrams
(hereafter Red Sequence galaxies - RS galaxies).
Among the photometric SDSS parameters calculated by the photometric pipeline PHOTO (Lupton et al., 2001), concentration
index and profile likelihood are sensitive to galaxies morphology (Shimasaku
et al., 2001; Strateva
et al., 2001). As it
is an indicator of recent star formation, the u-r colour is an alternative parameter correlated
with galaxies morphology, as suggested in the work by Strateva
et al. (2001). This study indicates that galaxies
have a bimodal u-r colour distribution corresponding to early (E, SO and Sa) and late (Sb, Sc, and Irr)
morphological types, which can be clearly separated by a u-r colour cut of 2.22 independent on magnitude.
For these reasons, we decided to use u-r colour, instead of concentration
index or profile likelihood, to perform an alternative morphological classification.
For each group we finally derived the early-type fraction within the inner region (,
), the intermediate annular region (, ) and the local background
(, ), applying both methods described above to galaxies obeying to criteria
2 and 3 defined in §3. Results are listed in Table 2. We derived the same observables
for HCGs and compared our early-type fractions estimates with those obtained by Hickson
et al. (1989). This comparison
is showed in (Fig. 7). We can see that our estimates, are systematically higher that the ones reported
by Hickson, which is not surprising since we use a photometric approach while the Hickson one is based on a purely
visual classification.

5 Individual properties
In this section we briefly discuss the individual properties of the groups in
our sample.
SHK 1. A considerable and compact over-density is detected, confirmed by the presence of a well defined Red Sequence. The physical reality of this group is supported by a marked excess in photometric redshift distribution in correspondence of the spectroscopic redshift value found in literature. This is the richest group within our sample together with SHK 253.
SHK 5. This group corresponds to HCG 50. The 2D galaxy over-density is confirmed by both a peak in the photometric redshift distribution and by the presence of an evident RS. This structure appears elongated in the sky plane.
SHK 6. Clear over-density in both 2D and 3D diagnostics, with a well defined RS. The photometric redshift distribution reveals the presence of a rich background structure, at the group position, at .
SHK 8. According to Tovmassian et al. (2005c) this group is contaminated by a foreground galaxy and by a star The central galaxies, all with consistent redshifts, appear to be interacting All our diagnostics fail to identify a galaxy structure; we hence reject this group from further discussion.
SHK 10. Clear-cut rich group with elongated structure revealed in all diagnostics.
SHK 11. All the diagnostics indicate the presence of a small structure. Well defined Red Sequence but visible only for the few most luminous galaxies.
SHK 14. Clearly defined small group with the central 6 objects all with accordant redshifts (Tovmassian et al., 2005c). All our diagnostics reveal the presence of this group. Well defined Red Sequence.
SHK 19. Accordingly to Tovmassian et al. (2005c), the group is composed by 4 accordant redshift objects within a radius of 15 kpc. In our data we find 5 galaxies in a radius of and a background structure at .
SHK 22. Poor and dispersed structure visible in 2D diagnostics and in photometric redshift distribution. No signs of Red Sequence.
| SHK | ||||||||||
|---|---|---|---|---|---|---|---|---|---|---|
| 1 | 2 | 3 | 4 | 5 | 6 | 7 | 8 | 9 | 10 | 11 |
| 1 | 0.86 | 0.44 | 0.42 | 246 | 134 | 358 | 63 | 123 | 63 | 123 |
| 5 | 1.00 | 0.40 | 0.38 | 6 3 | 5 2 | 8 6 | 145 | 4 2 | 145 | 4 2 |
| 6 | 1.00 | 0.64 | 0.40 | 235 | 7 3 | 337 | 30 | 3 2 | 30 | 3 2 |
| 10 | 0.71 | 0.65 | 0.46 | 255 | 7 3 | 317 | 302 | 174 | 302 | 174 |
| 11 | 1.00 | 0.29 | 0.10 | 9 4 | 4 2 | 6 5 | 269 | 7 3 | 224 | 8 3 |
| 14 | 0.50 | 0.47 | 0.47 | 104 | 8 3 | 4 5 | 41 | 5 2 | 41 | 5 2 |
| 19 | 0.80 | 0.47 | 0.46 | 175 | 5 2 | 466 | 10 | 2 1 | — | —– |
| 22 | 0.20 | 0.46 | 0.39 | 4 3 | 5 2 | 8 5 | 201 | 5 2 | 201 | 5 2 |
| 31 | 1.00 | 0.93 | 0.86 | 114 | 6 2 | 5 4 | 312 | 103 | 312 | 103 |
| 54 | 1.00 | 0.57 | 0.20 | 175 | 5 2 | 217 | 331 | 174 | 434 | 154 |
| 55 | 0.86 | 0.19 | 0.08 | 7 3 | 7 3 | 3 5 | 88 | 5 2 | 88 | 5 2 |
| 57 | 0.60 | 0.54 | 0.29 | 175 | 103 | 216 | 233 | 103 | 233 | 103 |
| 63 | 0.67 | 0.25 | 0.03 | 1 2 | 3 2 | -32 | 52 | 3 2 | 215 | 4 2 |
| 65 | 0.00 | 0.33 | 0.10 | 367 | 7 3 | 3710 | 110 | 5 2 | 93 | 2 2 |
| 74 | 0.17 | 0.49 | 0.49 | 206 | 5 2 | 4710 | 240 | 185 | 252 | 235 |
| 95 | 1.00 | 0.64 | 0.07 | 3 7 | 4 2 | -24 | 32 | 2 1 | 32 | 2 1 |
| 120 | 0.80 | 0.37 | 0.38 | 104 | 4 2 | 6 6 | 15 | 3 2 | 96 | 8 3 |
| 123 | 0.57 | 0.37 | 0.08 | 124 | 6 3 | 0 5 | 229 | 7 3 | 229 | 7 3 |
| 128 | 0.80 | 0.29 | 0.06 | 4 3 | 5 2 | 1 4 | 38 | 3 2 | 38 | 3 2 |
| 154 | 0.89 | 0.75 | 0.75 | 306 | 8 3 | 469 | 119 | 9 3 | 232 | 8 3 |
| 181 | 0.90 | 0.53 | 0.49 | 245 | 103 | 276 | 168 | 123 | 150 | 113 |
| 186 | 0.67 | 0.31 | 0.11 | 134 | 6 2 | 3 4 | 59 | 6 2 | 59 | 6 2 |
| 188 | 1.00 | 0.64 | 0.64 | 7 3 | 6 2 | -14 | 126 | 6 2 | 126 | 6 2 |
| 191 | 1.00 | 0.67 | 0.64 | 185 | 113 | 246 | 190 | 154 | 266 | 174 |
| 205 | 1.00 | 0.39 | 0.40 | 164 | 4 2 | 166 | 178 | 4 2 | 178 | 4 2 |
| 213 | 0.80 | 0.60 | 0.60 | 7 3 | 6 2 | -24 | 133 | 5 2 | 212 | 4 2 |
| 218 | 0.50 | 0.25 | 0.25 | 2 3 | 6 3 | -95 | 259 | 6 3 | 136 | 8 3 |
| 223 | 1.00 | 0.55 | 0.53 | 215 | 9 3 | 287 | 146 | 8 3 | 210 | 113 |
| 231 | 0.80 | 0.30 | 0.06 | 134 | 4 2 | 4 5 | 178 | 4 2 | 178 | 4 2 |
| 237 | 1.00 | 0.42 | 0.40 | 9 4 | 3 2 | 217 | 194 | 4 2 | 35 | 2 1 |
| 245 | 0.57 | 0.62 | 0.64 | 185 | 9 3 | 357 | 133 | 8 3 | 133 | 8 3 |
| 251 | 0.57 | 0.42 | 0.42 | 6 4 | 6 3 | -65 | 88 | 5 2 | 88 | 5 2 |
| 253 | 0.92 | 0.38 | 0.50 | 154 | 134 | 135 | 90 | 123 | 90 | 123 |
| 254 | 0.80 | 0.21 | 0.04 | 6 4 | 4 2 | -26 | 57 | 3 2 | 57 | 3 2 |
| 344 | 0.78 | 0.29 | 0.39 | 104 | 8 3 | -45 | 113 | 8 3 | 113 | 8 3 |
| 346 | 0.78 | 0.72 | 0.64 | 165 | 8 3 | -45 | 134 | 7 3 | 151 | 7 3 |
| 348 | 1.00 | 0.67 | 0.67 | 164 | 6 2 | 125 | 205 | 8 3 | 146 | 6 2 |
| 351 | 0.62 | 0.40 | 0.16 | 165 | 9 3 | 196 | 298 | 103 | 298 | 103 |
| 352 | 1.00 | 0.80 | 0.75 | 286 | 9 3 | 337 | 92 | 8 3 | 92 | 8 3 |
| 355 | 1.00 | 0.44 | 0.41 | 4 3 | 3 2 | -45 | 29 | 3 2 | 29 | 3 2 |
| 357 | 1.00 | 0.77 | 0.66 | 346 | 103 | 437 | 211 | 134 | 211 | 134 |
| 358 | 1.00 | 0.29 | 0.07 | 5 3 | 6 2 | 1 3 | 86 | 5 2 | 86 | 5 2 |
| 360 | 1.00 | 0.81 | 0.87 | 235 | 113 | 346 | 179 | 154 | 179 | 154 |
| 371 | 0.50 | 0.32 | 0.25 | 2 3 | 5 2 | -15 | 93 | 5 2 | 93 | 5 2 |
| 376 | 0.86 | 0.79 | 0.78 | 104 | 7 3 | 166 | 78 | 6 2 | 93 | 5 2 |
SHK 29. The spectroscopic redshift in literature refers to only one object, probably of foreground. No signs of over-density or of a RS are detected in correspondence of the literature spectroscopic redshift estimate. In the photometric redshift distribution a well defined structure is evident at . The group seems to belong to an high redshift structure. Since we reject this group from further discussion.
SHK 31. Loose and well defined group, visible in all diagnostics. RS is clearly visible.
SHK 54. Complex structure: two clumps, of comparable richness at the same redshift. There is a well defined RS.
SHK 55. Well defined compact and isolated group.
SHK 57. Well defined high redshift group evident in all diagnostics.
SHK 60. Poor compact group with larger and looser structure in the background. The spectroscopic and photometric redshift estimates differ by more than . We reject this group from further discussion.
SHK 63. This is an isolated triplet of galaxies at redshift consistent with the spectroscopic one found in literature, whose 2D over-density is raised by the superposition of other two foreground galaxies.
SHK 65. No evidence for structure in spectroscopic redshifts distribution. In the other diagnostics we observe a large and loose structure with a quite extended over-density in photometric redshifts and a very poor RS.
SHK 70. Very poor structure partially superposed with with a structure at . The low S/N ratio makes it hard to detect this group with our diagnostic tools. We exclude it from the final sample.
SHK 74. Tovmassian et al. (2005a) report the existence of two distinct groups at two different redshifts. We don’t find hints of the presence of two distinct structures in our photometric redshift distribution, but of only one, loose structure at .
SHK 95. Small excess of spectroscopic redshifts. Only moderate evidence of a structure in the other diagnostics. We interpreted it as a poor group at low redshift.
SHK 96. No diagnostic reveals the presence of a group. Its detection was hence most probably due to a chance galaxy superposition. We reject it from the sample.
SHK 104. Poor group, possibly isolated presenting no excess in the spectroscopic redshift distribution. Evidence of a structure in the 2D diagnostics, but only moderate in the 3D ones. No presence of a Red Sequence. Mismatch between spectroscopic and photometric redshifts greater than . We reject it from the sample.
SHK 120. Both density maps and photometric redshift distributions reveal the presence of a rich, elongated structure projected against a looser and more distant one. Slightly defined RS.
SHK 123. This low multiplicity group shows a pronounced peak in the photometric redshift distribution and a marginally defined RS. Two different groups of objects are present, maybe at similar redshifts and possibly belonging to the same structure.
SHK 128. Compact and isolated group of low multiplicity.
SHK 152. No diagnostics present hints of the presence of a structure. .Rejected from final sample.
SHK 154. The group has been studied in detail by Tiersch et al. (2002) who found 5 galaxies with accordant redshifts. They also detected signs of interactions among the members as well as an extended halo surrounding the group. In addition, they find that some galaxies which appear to be projected on the main group have discordant redshifts. We find a strong 2D over-density with well defined RS and a strong excess of photometric redshifts. The presence of a secondary peak at in the numeric surface density radial profile could indicate the presence of a second structure at higher redshift which is also confirmed by a double peak in the photometric redshift distribution.
SHK 181. Rich group, with very well defined over-density and elongated appearance. Its physical nature was proved by detailed photometric and spectroscopic studies by Fasano & Bettoni (1994) and Tovmassian et al. (2004). Tovmassian et al. (2004) measure a rather low spatial density compared the other SHKs. Our data show the presence of a well defined RS and of a pronounced excess in photometric redshift distribution (Figs. 1,2 and 3).
SHK 184. The mean spectroscopic and photometric redshifts of the group differ significantly and there is no clear evidence of the presence of a structure consistent with the spectroscopic value. Rejected
SHK 186. Compact and elongated (chain-like) structure. Visible in all diagnostics.
SHK 188. Rich group slightly off-centred with respect to position listed in Stoll’s catalogue. Well defined RS.
SHK 191. This group is the core of Abell cluster A1097 (Tovmassian et al., 2005b). The excess in the photometric redshift distribution is highly evident and the RS is clearly defined.
SHK 202. Even though optical and X-Ray band studies (Kodaira et al., 1988, 1990; Takahashi et al., 2000, 2001) confirm the physical reality of this group, because of its closeness, resulting in a too low S/N ratio, our diagnostic tools fail to detect it as a statistic excess. Rejected from further analysis.
SHK 205. Loose group of low richness settling on the expected RS. The average photometric and spectroscopic redshifts slightly disagree.
SHK 213. Loose group showing a clumpy core, a moderate over-density and a well defined RS. The photometric redshift distribution presents a well defined excess at a redshift slightly higher than the assumed one.
SHK 218. Well defined group confirmed by RS and excess of photometric redshifts. There is evidence for a second structure in the background at redshift .
SHK 223. Loose and rich group, having a well defined RS. It shows slightly off-centred substructures.
SHK 229. . Our diagnostics don’t find any hints of the presence of a structure. Maybe this is due to the fact that the spectroscopic redshift estimate found in literature referred to only one object. Rejected from further analysis.
SHK 231. Compact, elongated structure of low multiplicity. Visible in all diagnostics.
SHK 237. Nearby poor group. Moderate hints in our diagnostics of the presence of a structure.
SHK 245. Well defined over-density of elongated appearance. The RS is well defined and both the spectroscopic and photometric redshift distributions hint to the existence of a second background structure.
SHK 248. , hence rejected from further analysis. Our 2D diagnostics found hints of the over-density, but photometric redshift distribution shows that this group is closer than indicated by the spectroscopic redshift found in literature.
SHK 251. Well defined but not very strong over-density which extends well beyond the central condensation. RS detected but not conclusive. The background seems to indicate the presence of a rich structure at the edges of the field.
SHK 253. Compact, isolated structure elongated in shape. Strong excess of photometric redshifts. Well defined red sequence.
SHK 254. Moderate hints of the presence of a structure (triplet) in the inner . This structure seems to extend further out this radial distance, including other 4 galaxies.
SHK 258. No diagnostics present hints of the presence of a structure. Optical group. Rejected.
SHK 344. Tovmassian et al. (2004) performed a detailed analysis of this group, also revealing moderate signs of interaction among some of the galaxies in the core. In our data, we find a well defined over-density with a clearly visible RS and a second structure in the background.
SHK 346. Strong over-density clearly visible in all diagnostics. Evidence for a background compact substructure.
SHK 348. Loose group, clearly visible in all diagnostics.
SHK 351. Nearby, extended group. A pronounced excess in photometric redshifts and a well defined CMR are evident. A background extended structure is clearly visible.
SHK 352. Rich and well defined group of compact appearance. The RS is clearly visible and there is a well pronounced excess of both spectroscopic and photometric redshifts.
SHK 355. Small compact and very well defined group of galaxies. Its CMR is evident.
SHK 357. It is a rich and compact group clearly detected as both an excess in photometric redshift distribution and a well defined RS.
SHK 358. Nearby group. Strong excess in the photometric redshift distribution in correspondence of the mean spectroscopic redshift measure. Well defined RS.
SHK 359. Poor, nearby structure clearly overlapping with a background one. . Rejected.
SHK 360. This group is the central part of the Abell cluster 2113 and it has been studied in detail by Tiersch et al. (2002) who proved that the central galaxies have accordant redshifts and that the brightest objects are interacting. The group is almost entirely composed of early-type (E/S0) galaxies. In our data, the group is one of the the richest groups in the sample with a compact core and a very well defined RS. A significant excess is found out to . The photometric redshift excess appears to be slightly off-centred with respect to what is listed in both Stoll’s catalogue and in Tiersch et al. (2002).
SHK 371. Poor, compact and well defined group, elongated in shape.
SHK 376.
According to Tovmassian et al. (2003b) this is a peculiar SHK group, exclusively composed by spirals.
We refer to this paper for a detailed discussion of membership and interactions.
Our data confirm that the group is embedded within a larger structure extending out
to , but not the morphology of the galaxies, which, in partial contrast with
Tovmassian et al. (2003b), we found to be almost all early-type.
We excluded from further analysis the groups having and for which the diagnostics we used didn’t show hints of the presence of a physical structure. According to the above discussion we excluded the groups: SHK 8, SHK 29, SHK 60, SHK 70, SHK 96, SHK 104, SHK 152, SHK 184, SHK 202, SHK 229, SHK 248, SHK 258 and SHK 359, which leaves us with a homogeneous sample of 45 SHKs.
6 Results
The analysis performed in the previous sections shows that about per cent of SHK groups
are likely real structures, with richness ranging from 3 to 13 galaxies, characterized by the presence
of a projected spatial over-density, an excess in the photometric redshift distribution and
compatible mean spectroscopic and photometric redshifts. Furthermore, most of them present a well-defined CMR
consistent with the predictions of Bernardi
et al. (2003).
For the remaining per cent we can identify several cases:
i) the group is not real, but likely due to projection effects (SHK 96, 258);
ii) the group is either a very poor structure or located at very low redshift () and largely contaminated by background galaxies so that, due to the low S/N ratio, our approach does not allow a reliable detection (SHK 8,
104, 202);
iii) the mean spectroscopic and photometric redshifts of the group differ significantly and/or there is no clear
evidence of the presence of a structure consistent with the spectroscopic value (SHK 29, 70, 152, 184, 229, 248, 359);
iv) there is more than one excess in the photometric redshift distribution, revealing the
superposition of different structures at different distances (SHK 60).
For the last two cases the group properties could be correctly estimated, adopting
the photometric redshift estimate. This is though beyond of the purpose of this paper, in which we concentrate on
estimating all properties in a homogeneous way.
We applied the above analysis also to the sub-sample of HCGs discussed in Sec.3. We find that per cent of this sub-sample is classified as a real group of galaxies according to our criteria. For comparison with published group catalogues, we cross-correlated the whole sample of 214 Shakhbazyan’s groups contained within the SDSS DR5, to catalogues of groups of galaxies such as those of Lee et al. (2004); Berlind et al. (2006); Tago et al. (2008) and (Focardi & Kelm, 2002, UZC). Surprisingly, using a matching radius of ( kpc for our redshift range), we find a small overlap with the above catalogues. The catalogues by Tago et al. and Berlind et al. contain only and groups respectively that are consistent with Shakhbazyan groups, while no SHK group is found in the remaining catalogues. This result shows that the current generation of group finding algorithms are largely missing this class of poor structures, mainly because they are tailored to find isolated structures, but also because the spectroscopic samples they use are highly incomplete for such groups. This result has strong consequences for cosmological studies where the availability of catalogues of cosmic structures of low multiplicity is essential.
To better understand the environment inhabited by SHKs, we looked for the presence of nearby clusters cross correlating their positions with those of Abell’s and Zwicky’s galaxies clusters. Within a radius of we found 12 Abell and 9 Zwicky clusters. Within the 45 SHKs final sample, only 9 groups (SHK 6, SHK 22, SHK 54, SHK 65, SHK 120, SHK 154, SHK 181, SHK 191, SHK 357, SHK 360) could dwell inside or reside near Abell or Zwicky clusters.
6.1 Global Properties
Using the individual properties listed in Sect. 5 together with
the parameters in Table (2), we can now study the global optical properties of the groups in our
sample.
From the morphological point of view, several studies showed that SHKs, as expected from their
selection criteria, are on average rich in early-type (E/S0) galaxies ( per cent against per cent in HCGs and
per cent in the field), which are on average very red ( and
(Tovmassian et al., 2007)).
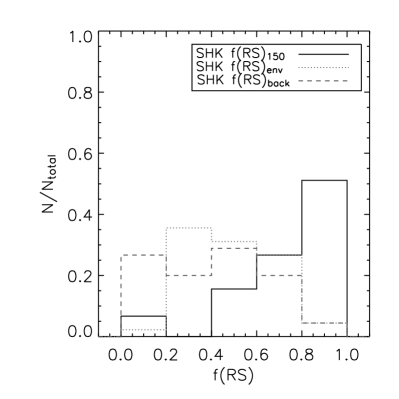
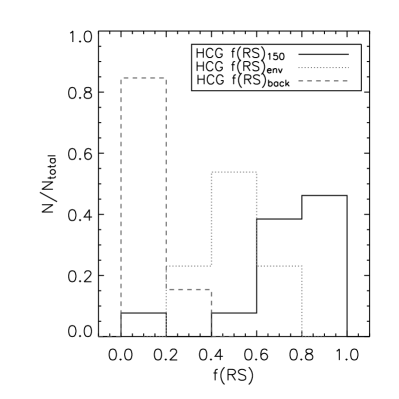
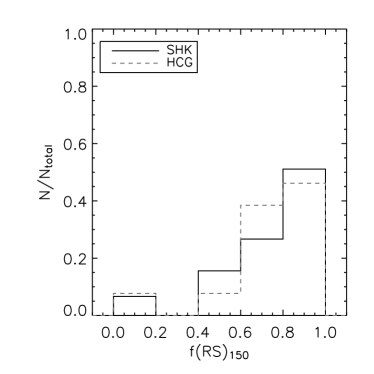
According to our photometric and CMR morphological classification, per cent and per cent of SHKs have and respectively. The overabundance of early-type galaxies is however confined to the group core since when we consider the early-type fraction in the inner, intermediate and local background regions (Fig. 8), we note that the dominant morphological type changes when moving outwards. This trend characterizes both SHKs (Fig. 8, left panel) and HCGs (Fig. 8, right panel), and reflects, to some extent, the morphology–density relation (Dressler, 1980). When compared with our sub-sample of HCGs, we find that the and distributions are skewed toward systematically higher early-type fractions (e.g., see Fig. 9). According to our classification, per cent of the SHKs we analysed have against per cent for the HCG sample, even though, given the small HCG sample size (13 HCGs with ), this difference is very not significant, (K-S probability of per cent). As discussed in §4.3, our classification methods differ from the purely morphological one adopted by Hickson (1982) and Hickson et al. (1992). According to Hickson’s criteria, the sub-sample included in the present work shows an per cent, while for the complete HCGs sample per cent, supporting the view that SHKs are richer in early-type galaxies than the average Hickson group.
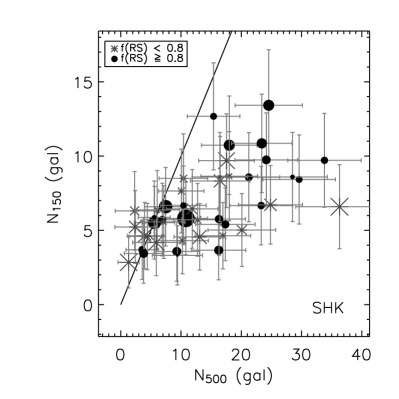
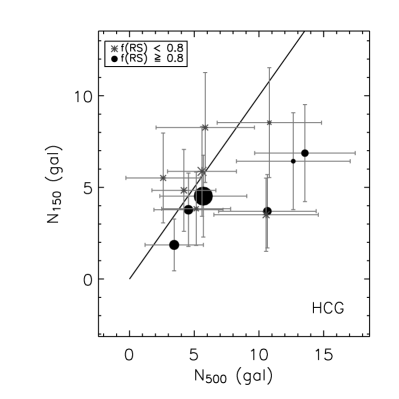
In order to investigate the degree of compactness and isolation of the SHKs, in Fig. 10 we compare the richness estimates measured within and . Despite the large uncertainties, our analysis discloses the existence of two classes of groups. The first class is populated by objects with , i.e. fairly compact and isolated groups, whose richness does not increase going from to . The second class is instead populated by more extended and dispersed structures for which ; these are on average richer structures, located in the upper right part of the left panel in Fig. 10. On the other hand, few HCGs of our sample show the presence of comparable extended structures in their surroundings (see right panel in Fig. 10). This may appear to contradict some previous studies on Hickson groups, such as Rood & Williams (1989) or Mamon (1990) who claimed that most HCGs reside within more extended structures. More recent studies however (Vennik et al., 1993; Palumbo et al., 1995; de Carvalho, 2000), relying on spectroscopic data-sets, found that only part of HCGs are embedded in loose groups. Furthermore we need to point out that our analysis method and selection criteria are different from these works, so that a direct comparison is misleading. Here we only emphasize the relative difference between our SHK and HCG samples. On the other hand our findings are consistent with Tovmassian et al. (1999a); Tovmassian & Tiersch (2001); Tovmassian et al. (2001); Tovmassian (2001) who show that SHKs appear to be embedded into large, loose structures. Their mean value of the mass-to-luminosity ratio ( (Tovmassian et al., 2007), consistent with what found in HCGs (Hickson et al., 1992)), is though sensibly lower than what usually observed in clusters (Bahcall, 1999).
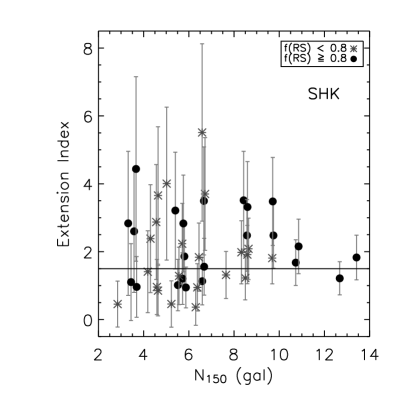
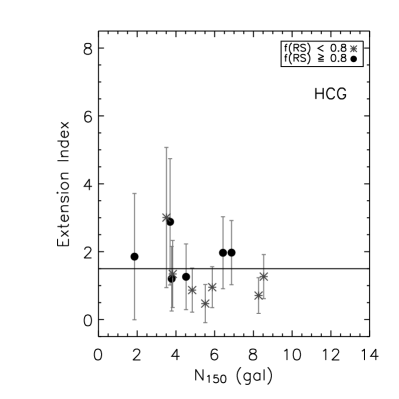
We further divided the sample in compact and extended groups, depending on their extension index defined as EI . A trend for the SHKs can be observed with increasing richness (see left panel in Fig. 11): the majority of rich groups (with ) is embedded within extended structures (), while poorer structures (with ) are a mixture of compact and extended objects (likely [core+halo] configurations). A K-S test indicates that the two distributions of EI are different with a probability of per cent. The HCG sample instead (Fig. 11, right panel) is dominated by concentrated structures, as expected from the strict isolation selection criterion used to identify them: less than per cent of the sample has a concentration index larger than 2, to be compared with per cent for SHKs.
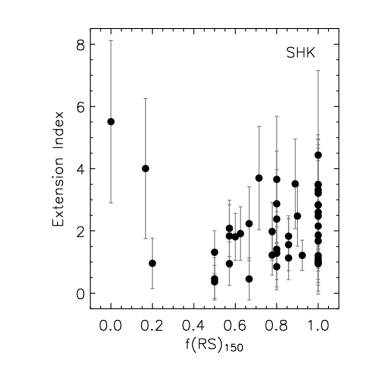
In Fig. 10 the size of the symbols is scaled accordingly to the group redshift. No trend with redshift is detected. Similarly, while we find no statistically significant difference in early-type fraction between more concentrated and extended SHK groups, Fig. 12 shows that extended structures are skewed toward higher , mainly due to the richest systems () as further discussed in 7. Anyway, we found no significant trend between Extension Index and early-type fraction (Spearman’s rank test significance value of 0.36).
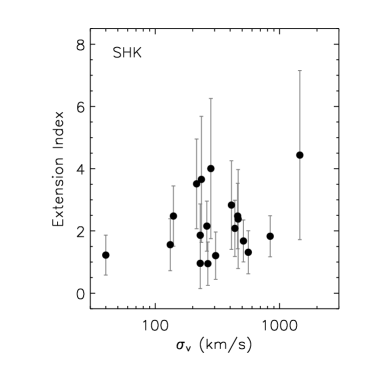
To further probe the correlation of the group extension index and of their on the mass of the system we extracted from the literature all available velocity dispersions for our sample of SHKs. Despite the poor statistics, due to the very low spectroscopic completeness for these objects, and the fact that no significant trend between EI and is found (Spearman’s rank test significance value of 0.49), there is a hint that extended groups have on average a higher velocity dispersion () (are on average more massive) than isolated groups () suggesting that our SHKs sample includes rich extended systems (Fig. 13). SHKs structure typologies are summarized in Table 3 together with some of their properties.
| SHK | EI | Structure Typology | |||||
|---|---|---|---|---|---|---|---|
| 1 | 2 | 3 | 4 | 5 | 6 | 7 | 8 |
| 1 | 0.86 | 317 | 19053 | 16.50 | 2.89 | 1.83 | cluster-core |
| 5 | 1.00 | 7 4 | 78 35 | 16.38 | 2.48 | 1.01 | isolated-compact |
| 6 | 1.00 | 307 | 94 37 | 15.85 | 2.85 | 3.50 | core+halo/loose |
| 10 | 0.71 | 327 | 95 37 | 16.31 | 2.95 | 3.70 | core+halo/loose |
| 11 | 1.00 | 125 | 51 28 | 16.67 | 0.54 | 2.60 | core+halo/loose |
| 14 | 0.50 | 135 | 10840 | 15.63 | 2.32 | 1.31 | isolated-compact∗ |
| 19 | 0.80 | 226 | 66 32 | 16.26 | 2.97 | 3.66 | core+halo/loose |
| 22 | 0.20 | 6 4 | 65 32 | 15.87 | 2.74 | 0.96 | isolated-compact |
| 31 | 1.00 | 145 | 82 35 | 16.36 | 2.24 | 1.86 | core+halo/loose |
| 54 | 1.00 | 226 | 76 35 | 15.54 | 2.66 | 3.21 | core+halo/loose |
| 55 | 0.86 | 9 4 | 93 37 | 16.89 | 2.57 | 1.13 | isolated-compact |
| 57 | 0.60 | 226 | 13745 | 16.48 | 2.68 | 1.81 | cluster-core |
| 63 | 0.67 | 2 2 | 40 24 | 17.47 | 1.10 | 0.46 | isolated-compact |
| 65 | 0.00 | 469 | 93 40 | 18.81 | 1.91 | 5.51 | core+halo/loose |
| 74 | 0.17 | 267 | 71 35 | 17.54 | 2.69 | 4.00 | core+halo/loose |
| 95 | 1.00 | 4 3 | 52 28 | 15.18 | 2.50 | 0.96 | isolated-compact |
| 120 | 0.80 | 135 | 61 32 | 16.39 | 2.95 | 2.38 | core+halo/loose |
| 123 | 0.57 | 155 | 91 37 | 16.44 | 2.91 | 1.84 | core+halo/loose |
| 128 | 0.80 | 5 4 | 66 32 | 16.79 | 1.61 | 0.85 | isolated-compact |
| 154 | 0.89 | 388 | 11942 | 15.26 | 2.80 | 3.51 | cluster-core |
| 181 | 0.90 | 317 | 13845 | 15.62 | 2.56 | 2.48 | cluster-core |
| 186 | 0.67 | 165 | 81 35 | 16.06 | 1.15 | 2.23 | core+halo/loose |
| 188 | 1.00 | 9 4 | 81 35 | 15.04 | 2.09 | 1.21 | isolated-compact |
| 191 | 1.00 | 236 | 15247 | 15.70 | 2.39 | 1.68 | cluster-core |
| 205 | 1.00 | 216 | 52 28 | 16.04 | 0.52 | 4.44 | core+halo/loose |
| 213 | 0.80 | 9 4 | 79 35 | 14.50 | 2.55 | 1.28 | isolated-compact |
| 218 | 0.50 | 3 4 | 89 37 | 16.28 | 2.73 | 0.36 | isolated-compact |
| 223 | 1.00 | 276 | 12142 | 15.44 | 2.23 | 2.48 | cluster-core |
| 231 | 0.80 | 175 | 64 32 | 16.74 | 2.64 | 2.87 | core+halo/loose |
| 237 | 1.00 | 125 | 47 28 | 14.34 | 2.84 | 2.83 | core+halo/loose |
| 245 | 0.57 | 236 | 12242 | 14.94 | 1.96 | 2.08 | cluster-core |
| 251 | 0.57 | 8 5 | 90 37 | 16.00 | 2.74 | 0.95 | isolated-compact |
| 253 | 0.92 | 206 | 17951 | 15.53 | 1.95 | 1.21 | isolated-compact∗ |
| 254 | 0.80 | 7 5 | 59 32 | 17.54 | 2.71 | 1.41 | isolated-compact |
| 344 | 0.78 | 135 | 12042 | 15.84 | 2.78 | 1.22 | isolated-compact∗ |
| 346 | 0.78 | 216 | 11842 | 16.36 | 2.64 | 1.98 | cluster-core |
| 348 | 1.00 | 216 | 81 35 | 15.33 | 2.85 | 2.83 | core+halo/loose |
| 351 | 0.62 | 216 | 12142 | 13.60 | 2.76 | 1.91 | cluster-core |
| 352 | 1.00 | 367 | 12242 | 14.11 | 2.82 | 3.32 | cluster-core |
| 355 | 1.00 | 5 4 | 49 28 | 16.49 | 1.97 | 1.10 | isolated-compact |
| 357 | 1.00 | 438 | 13745 | 14.70 | 2.86 | 3.48 | cluster-core |
| 358 | 1.00 | 7 3 | 83 35 | 13.36 | 2.93 | 0.94 | isolated-compact |
| 360 | 1.00 | 306 | 15447 | 15.48 | 2.81 | 2.15 | cluster-core |
| 371 | 0.50 | 3 4 | 74 35 | 16.69 | 2.66 | 0.46 | isolated-compact |
| 376 | 0.86 | 135 | 94 37 | 14.73 | 2.46 | 1.56 | core+halo/loose |
6.2 Shakhbazyan Groups in X-Rays
The X-ray emission due to hot ionized gas in galaxy groups or clusters is an indication of the presence of a common potential well, and thus of the physical reality of the structure. Unfortunately very few pointed observations of SHK groups in the X-ray band are available in the archives. Thus, in order to investigate the X-ray luminosity of these systems, we combined pointed and Rosat All Sky Survey (RASS) data. Excluding all groups which fall too far from the nominal aim-point of the satellite (and thus are affected by large uncertainties), we are left with 4 groups with pointed observations: SHK 37 and 154 observed by Chandra and XMM, and SHK 202 and 233 (Takahashi et al., 2000, 2001) observed with ASCA, while 8 groups (1,154,202,346,352,355,357,360) are individually detected in the RASS observations. In cases where both pointed and RASS data were available we verified the consistencies of the measured fluxes, but decided to use the latter for homogeneity.
For all remaining SHK groups without individual X-ray detection, we stacked the RASS X-ray photons, obtaining a significant detection at the level within 5’, i.e. kpc at the average redshift of 0.09. The use of a more physical extraction aperture would be preferable, but due to the problems discussed in Sec. 3 that is hardly feasible with the available data. However note that while the extraction radius was chosen primarily to allow an easy comparison with the literature (see below), the adopted aperture is close to the average virial radius for a group with velocity dispersion of 250 and our redshift range.
In order to verify the likelihood of a fake detection we further performed 100 additional stackings choosing random fields within 1 and 2 deg from the group centroids. We find that the likelihood of a chance detection is per cent. In Table 4 we report the average luminosity of the whole sample, as well as those of the sub-samples selected according to , concentration and velocity dispersion (when available).
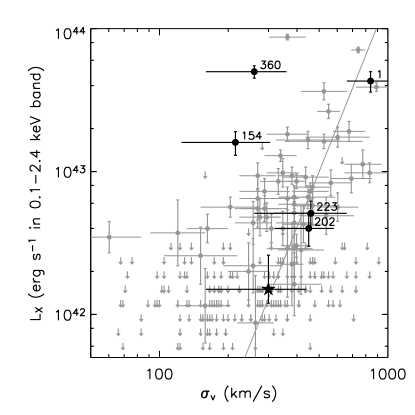
Our results are compared with the vs plot of Mahdavi et al. (2000), based on RASS data, in Figure 14. We can see that X-ray luminosities for SHK 1, 202 and 223 are consistent with the expectations for groups of comparable , even though on the faint side. SHK 154 and 360 are brighter than expected, suggesting that their velocity dispersions were underestimated since both of them are part of rich clusters. The remaining undetected groups also have an average luminosity consistent with the expectations, assuming a median , with a dependence on , concentration and in agreement with the expected trends888Note that our estimates are upper limits to the actual emission of diffuse intragroup gas, due to the impossibility of disentangling the overall emission from the one of individual galaxies and/or AGNs. However given the few () bright early-type galaxies within the extraction radius, we estimate that the contribution of individual sources is on average less than a few erg s-1. (see Table 4). While the adoption of a fixed radius for all sources may increase the scatter on the determination of the X-ray properties of SHK groups (but not in the comparison with Mahdavi and collaborators), the uncertainties due to the poor statistics, the gas temperature, the AGN contribution etc., represent the dominant source of uncertainty.
| Sub-sample | ( erg s-1) |
|---|---|
| All undetected | |
| high | |
| low | |
| EI | |
| EI | |
7 Discussion and Conclusions
Shakhbazyan groups of galaxies, in spite of having been originally selected as “compact groups of compact galaxies”, due to the less restrictive selection criteria adopted by their discoverers, have been shown to sample a large range of spatial density. In an ongoing effort to study the low density regime of cosmic structures in the local Universe we have performed a systematic study of all the SHKs covered by the Sloan Digital Sky Survey DR5. Unfortunately only a minority of SHKs have measured spectroscopic redshifts and often only for one or two galaxies in each group. However, using a series of diagnostics in 2D and in photometric redshift space, derived with neural networks tools, we found that per cent of them are confirmed structures with richness ranging from to galaxies.
This result is intriguing in light of the fact that SHKs are missing in other catalogues of galaxy groups. Only
2 of the SHK groups inside the SDSS sky coverage are in common with the Hickson sample.
Several justifications could be provided about why Hickson missed most of the compact SHK groups:
i) Hickson looked for much more compact structures than SHKs are, with galaxies’ relative distances lower than
the characteristic diameter of a member galaxy while SHKs are selected with a less restrictive criterion, hence
they may or not comprehend HCG-like structures. This also reflects on the high threshold imposed by Hickson’s
surface brightness criterion, which is often not satisfied by SHKs;
ii) The galaxies compactness selection criterion used to identify SHKs renders them easily
contaminated with stars misclassified as galaxies. The opposite can naturally also easily happen;
some SHKs could hence have been misclassified as star clusters, especially the high redshift ones;
iii) The isolation criterion used by Hickson to identify his groups is often
unsatisfied by SHKs, since, as we have found in our analysis, even the most compact structures are embedded in
looser ones. Furthermore, a recent analysis of galaxies in cosmological simulations indicates that the HCG
sample is highly incomplete (Díaz-Giménez et al., 2008).
It is worth pointing out that our definition of compactness is different
from the one used by Hickson, and they may coincide only for the most compact SHKs.
Notwithstanding the difficulty in reproducing Hickson’s selection criteria accurately (see e.g.
Iovino &
Hickson, 1997), we have applied them to our SHKs sample using the same magnitude limit that
characterized the original POSS plates. We found that they are satisfied only by 9 groups (SHK 8, 19, 95, 128,
237, 248, 355, 358, 371) out of 58, 7 of which are identified as likely real structures by our procedure. Five of
these (SHK 95, 128, 355, 358, 371) are classified as compact structures (), while the other two (SHK 19,
237) are likely [core+halo] configurations ( and )).
The overlap with other published studies of galaxy groups is also extremely poor (e.g. SDSS: Tago et al., 2008; Berlind et al., 2006; UZC: Focardi & Kelm, 2002; also see Lee et al., 2004). This is most probably due to the fact that they are not as isolated and thus are entirely missed by detection algorithms looking for isolated and compact structures. Also, so far, almost all studies of groups in the SDSS have been based on the spectroscopic data-set, which is highly incomplete for environments as dense as the Shakhbazyan groups. In fact we find that only a minority ( per cent) of candidate group members belongs to the SDSS spectroscopic sample. However, see McConnachie et al. (2008b) for a study of compact and isolated HCG-like galaxy groups based upon the SDSS photometric data-set.
Using photometric (e.g. Strateva et al., 2001) and CMR based criteria, we studied the morphological content of SHKs and found that more than per cent and per cent of SHKs have indeed early-type fractions , using the u-r or Red Sequence methods respectively. The overabundance of early-type and Red Sequence galaxies is however confined to the group core since when we consider the morphological content of the local environment () and background () we observe that red galaxies decreases outward. Following the same approach, we also estimated early-type and Red Sequence fractions for a sub-sample composed of all HCGs with , located within the SDSS. When compared with our sub-sample of HCGs, we found that SHKs have somewhat higher values of , especially considering that our HCG sub-sample is biased toward high early-type fractions. The large fraction of early-type gas-poor galaxies found in SHKs, could partly explain the fact that enhanced FIR emission was detected in only a small fraction ( per cent) of them (Tovmassian et al., 1998), in contrast to the more pronounced excess found in HCGs ( per cent) (Allam et al., 1996).
Our analysis discloses the existence of two classes of SHKs, one constituted by compact and isolated groups () and the other by dispersed and more extended structures (). A trend for SHKs can be observed for the extension index and the inner early-type fraction with increasing richness: rich SHKs (with ) are embedded within extended structures (), while poorer ones (with ) are a mixture of isolated and more extended objects. The richest groups tend to be dominated by early-type galaxies (). On the other hand, we find that the analysed HCGs are composed only of poor (), concentrated () structures: less than per cent of the sample has an extension index larger than 2, to be compared with per cent for SHKs. We point out that this trend is not expected just based on the selection criteria since the isolation constrain tends to increase the EI for groups with radius 999Half of the angular diameter of HCGs as found by Hickson’s selection criteria, measured in kpc. (), i.e. for half of the overall HCG sample and 40 per cent of ours. Furthermore the majority of SHKs satisfying the HCG criteria has (5 out of 7). This implies that HCG criteria effectively select compact and truly isolated groups which are deficient in galaxies also outside the avoidance region. Isolated SHKs () dwell in less dense regions such as the outer parts of clusters or the field, possibly sharing several properties of the Hickson sample. Dispersed SHKs () are a mixture of different classes. Those having are probably [core+halo] configurations or condensations within larger structures. Those with richness are extended structures whose central content of red galaxies is high because we are considering the central cores of galaxy clusters. In fact all SHKs which we were able to associate with known Abell or Zwicky clusters belong to the latter group (e.g., SHK 360 is the central part of Abell 2113 cluster, SHK 191 is also classified as Abell 1097). According to what we have found for SHKs and HCGs, it seems that there are almost no [core+halo] configurations among our HCGs comparable to the class of SHK groups with large EI.
Our analysis thus suggests that, contrary to what previously thought (see for instance Tiersch et al., 2002), SHKs are an extremely heterogeneous class of objects which includes both cores of rich, extended structures and compact, isolated groups. The differences with HCGs are mainly due to the contamination of the sample by cores of galaxy clusters which have no counterpart in the HCG sample. This is also likely the cause of the SHKs bias toward larger early-type fractions. This scenario is further supported by the fact that extended SHKs have in average higher velocity dispersion () than compact ones (). Furthermore, while the velocity dispersions of SHKs (where available) appear to be higher () and crossing times smaller ( Myr), than those of most compact groups, neglecting the presence of an extended halo inevitably leads to underestimate the crossing times. Our results are also in agreement with the simulations performed by McConnachie et al. (2008a), according to which compact groups, although selected to be compact and isolated, are often the cores of larger groups.
We didn’t find any correlation between the environment in which SHKs reside and their redshift. This suggests that the evolutionary state of these groups doesn’t depend on their cosmological age (on the redshift) but only on the density of the zone in which they are born. However we must consider that the redshift range covered by our sample () may not be enough to detect evolutionary trends.
In addition, notwithstanding the fact SHKs original selection criteria may potentially produce a heterogeneous collection of loose nearby groups and denser distant ones, the overall properties and in particular the compact/sparse nature of SHKs in our sample do not appear to depend on their distance. In fact, we found no significant redshift dependence of the magnitude difference between the faintest and the brightest galaxy in each group (), of the Extension Index (EI), of the surface number density or the X-ray luminosity. Neither did we find any correlation between and any of the other parameters. Note however that our selection criteria to define both the optimal SHK sample and the member galaxies, may contribute to reduce any bias present in the original SHK catalogue.
Finally, X-ray luminosities for SHKs detected in X-rays are consistent with the expectations for the relation. The remaining undetected groups also have an average luminosity consistent with the expectations, assuming a median .
SHKs have not been intensely investigated and still little is known about their properties and state of evolution. Available data for SHKs are of poor quality: the few detailed works available in literature are devoted to the rich end of the catalogue, and 3/4 of the groups with robust velocity dispersion belong to the extended sub-sample. Most of the claims (relatively high velocity dispersions, short crossing times, etc.) have hence to be revisited, since they are biased towards richer structures, which are possibly also the more massive ones, reside in peculiar environments and do not share the properties of the whole sample so that they cannot be easily compared with HCGs.
The bias introduced by Shakhbazyan in looking for dense systems made by very red galaxies with the aim to find a homogeneous class of structures, resulted in the fortuitous identification of a more complicated situation constituted of different kinds of systems, the poorest of them are probably going through different evolutionary state. The high content of early-type galaxies in these structures is due to an environmental–dynamical effect that is simply the byproduct of the Morphology–Density relation.
To properly characterize the properties of these groups and their evolutionary path, it is essential to obtain more accurate redshift determination for those objects for which no spectroscopic data exist in literature ( per cent of the complete SHKs catalogue) and uniformly sample the different sub-populations. This will allow to confirm candidate group members and hence to improve the richness and dynamical properties estimates of the groups. Group masses and M/L ratios will eventually allow to put limits on the dark matter content, dynamical time–scales and evolutionary state of these structures. Additional X-ray observations would provide an additional proof to the physical reality of SHKs and would allow to estimate the total mass and the baryonic fraction of these systems.
Acknowledgments
We thank the referee, Dr. Mamon, for his valuable comments which allowed to significantly improve the quality of
this paper. DC also expresses his gratitude to Chris A. Collins for the useful discussions and encouragements he
has provided.
This work was partly funded by the Italian Ministry of Foreign Affairs (MAI) through a bylateral Italy-USA agreement.
The authors express their strongest disagreement with the unsupportive attitude
shown over the last twenty years, by the various Italian Governments,
towards scientific research and public universities, and their concern about
the latest reforms and funding cuts which are undermining the career of young
researchers.
Funding for the Sloan Digital Sky Survey (SDSS) and SDSS-II has been provided by the Alfred P. Sloan Foundation, the Participating Institutions, the National Science Foundation, the U.S. Department of Energy, the National Aeronautics and Space Administration, the Japanese Monbukagakusho, the Max Planck Society and the Higher Education Funding Council for England. The SDSS Web site is http://www.sdss.org/.
References
- Allam et al. (1996) Allam S., Assendorp R., Longo G., Braun M., Richter G., 1996, A&AS, 117,39
- Bahcall (1999) Bahcall N. A., 1999, in Dekel A., Ostriker J. P., eds, Formation of Structure in the Universe. pp 135
- Baier & Tiersch (1976) Baier F. B., Tiersch H., 1976, Astrofizika, 12, 7
- Baier et al. (1974) Baier F. W., Petrosyan M. B., Tiersch H., Shakhbazyan R. K., 1974, Astrofizika, 10, 327
- Baier & Tiersch (1975) Baier F. W., Tiersch H., 1975, Astrofizika, 11, 221
- Baier & Tiersch (1978) Baier F. W., Tiersch H., 1978, Astrofizika, 14, 279
- Baier & Tiersch (1979) Baier F. W., Tiersch H., 1979, Astrofizika, 15, 33
- Barnes (1985) Barnes J., 1985, MNRAS, 215, 517
- Barnes (1989) Barnes J. E., 1989, Nature, 338, 123
- Bayer & Tiersch (1976) Bayer F. W., Tiersch H., 1976, Astrofizika, 12, 409
- Berlind et al. (2006) Berlind A. A., et al., 2006, ApJS, 167, 1
- Bernardi et al. (2003) Bernardi M., et al., 2003, AJ, 125, 1882
- Bode et al. (1993) Bode P. W., Cohn H. N., Lugger P. M., 1993, ApJ, 416, 17
- Csabai et al. (2003) Csabai I., Budavári T., Connolly A. J., Szalay A. S., Győry Z., Benítez N., Annis J., Brinkmann J., Eisenstein D., Fukugita M., Gunn J., Kent S., Lupton R., Nichol R. C., Stoughton C., 2003, AJ, 125, 580
- D’Abrusco et al. (2007) D’Abrusco R., Staiano A., Longo G., Brescia M., Paolillo M., De Filippis E., Tagliaferri R., 2007, ApJ, 663, 752
- de Carvalho (2000) de Carvalho R. R., 2000, in Valtonen M. J., Flynn C., eds, IAU Colloq. 174: Small Galaxy Groups Vol. 209 of Astronomical Society of the Pacific Conference Series. pp 239
- del Olmo et al. (1995) del Olmo A., Moles M., Perea J., 1995, in Richter O.-G., Borne K., eds, Groups of Galaxies Vol. 70 of Astronomical Society of the Pacific Conference Series. pp 117
- Diaferio et al. (1994) Diaferio A., Geller M. J., Ramella M., 1994, AJ, 107, 868
- Diaferio et al. (1993) Diaferio A., Ramella M., Geller M. J., Ferrari A., 1993, AJ, 105, 2035
- Díaz-Giménez et al. (2008) Díaz-Giménez E., Ragone-Figueroa C., Muriel H., Mamon G., 2008, ArXiv e-prints (astro-ph/0809.3483)
- Dressler (1980) Dressler A., 1980, ApJ, 236, 351
- Eisenstein et al. (2001) Eisenstein D. J., et al., 2001, AJ, 122, 2267
- Fasano & Bettoni (1994) Fasano G., Bettoni D., 1994, AJ, 107, 1649
- Focardi & Kelm (2002) Focardi P., Kelm B., 2002, A&A, 391, 35
- Fukugita et al. (1995) Fukugita M., Shimasaku K., Ichikawa T., 1995, PASP, 107, 945
- Governato et al. (1996) Governato F., Tozzi P., Cavaliere A., 1996, ApJ, 458, 18
- Gunn & Gott (1972) Gunn J. E., Gott J. R. I., 1972, ApJ, 176, 1
- Hickson (1982) Hickson P., 1982, ApJ, 255, 382
- Hickson et al. (1989) Hickson P., Kindl E., Auman J. R., 1989, ApJS, 70, 687
- Hickson et al. (1992) Hickson P., Mendes de Oliveira C., Huchra J. P., Palumbo G. G., 1992, ApJ, 399, 353
- Iovino & Hickson (1997) Iovino A., Hickson P., 1997, MNRAS, 287, 21
- Jones et al. (2003) Jones L. R., Ponman T. J., Horton A., Babul A., Ebeling H., Burke D. J., 2003, MNRAS, 343, 627
- Kirshner & Malumuth (1980) Kirshner R. P., Malumuth E. M., 1980, ApJ, 236, 366
- Kodaira et al. (1990) Kodaira K., Doi M., Ichikawa S.-I., Okamura S., 1990, Publications of the National Astronomical Observatory of Japan, 1, 283
- Kodaira et al. (1988) Kodaira K., Iye M., Okamura S., Stockton A., 1988, PASJ, 40, 533
- Kodaira et al. (1991) Kodaira K., Sekiguchi M., Sugai H., Doi M., 1991, PASJ, 43, 169
- Kodama & Arimoto (1997) Kodama T., Arimoto N., 1997, A&A, 320, 41
- Lee et al. (2004) Lee B. C., et al., 2004, AJ, 127, 1811
- Lupton et al. (2001) Lupton R., Gunn J. E., Ivezić Z., Knapp G. R., Kent S., 2001, in Harnden Jr. F. R., Primini F. A., Payne H. E., eds, Astronomical Data Analysis Software and Systems X Vol. 238 of Astronomical Society of the Pacific Conference Series. pp 269, astro-ph/0101420
- Mahdavi et al. (2000) Mahdavi A., Böhringer H., Geller M. J., Ramella M., 2000, ApJ, 534, 114
- Mamon (1986) Mamon G. A., 1986, ApJ, 307, 426
- Mamon (1987) Mamon G. A., 1987, ApJ, 321, 622
- Mamon (1990) Mamon G. A., 1990, in Sulentic J. W., Keel W. C., eds, IAU Coll. 124 Paired and Interacting Galaxies. pp 609, (Washington, NASA)
- Mamon (1996) Mamon G. A., 1996, in de Vega H. J., Sánchez N., eds, Third Paris Cosmology Colloquium. pp 95, astro-ph/9511101
- Mamon (2000) Mamon G. A., 2000, in Combes F., Mamon G. A., Charmandaris V., eds, Dynamics of Galaxies: from the Early Universe to the Present Vol. 197 of Astronomical Society of the Pacific Conference Series. pp 377, astro-ph/9911333
- Mamon (2007) Mamon G. A., 2007, in Saviane I., Ivanov V. D., Borissova J., eds, Groups of Galaxies in the Nearby Universe. pp 203, astro-ph/0607482
- Mauduit & Mamon (2007) Mauduit J.-C., Mamon G. A., 2007, A&A, 475, 169
- McConnachie et al. (2008a) McConnachie A. W., Ellison S. L., Patton D. R., 2008a, MNRAS, 387, 1281
- McConnachie et al. (2008b) McConnachie A. W., Patton D. R., Ellison S. L., Simard L., 2008b, ArXiv e-prints (astro-ph/0812.1580)
- Mendes de Oliveira (2006) Mendes de Oliveira C., 2006, in Revista Mexicana de Astronomia y Astrofisica Conference Series Vol. 26 of Revista Mexicana de Astronomia y Astrofisica Conference Series. pp 105–108
- Mendes de Oliveira & Carrasco (2007) Mendes de Oliveira C. L., Carrasco E. R., 2007, ApJ Let., 670, L93
- Mirzoyan et al. (1975) Mirzoyan L. V., Miller J. S., Osterbrock D. E., 1975, ApJ, 196, 687
- Oyaizu et al. (2008) Oyaizu H., Lima M., Cunha C. E., Lin H., Frieman J., Sheldon E. S., 2008, ApJ, 674, 768
- Palumbo et al. (1995) Palumbo G. G. C., Saracco P., Hickson P., Mendes de Oliveira C., 1995, AJ, 109, 1476
- Petrosian (1974) Petrosian M. B., 1974, Astrofizika, 10, 471
- Petrosyan (1978) Petrosyan M. B., 1978, Astrofizika, 14, 631
- Robinson & Wampler (1973) Robinson L. B., Wampler E. J., 1973, ApJ Let., 179, L135
- Rood & Williams (1989) Rood H. J., Williams B. A., 1989, ApJ, 339, 772
- Shakhbazyan (1973) Shakhbazyan R. K., 1973, Astrofizika, 9, 495
- Shakhbazyan & Petrosyan (1974) Shakhbazyan R. K., Petrosyan M. B., 1974, Astrofizika, 10, 13
- Shimasaku et al. (2001) Shimasaku K., et al., 2001, AJ, 122, 1238
- Stoll et al. (1996a) Stoll D., Tiersch H., Braun M., 1996a, Astronomische Nachrichten, 317, 239
- Stoll et al. (1996b) Stoll D., Tiersch H., Braun M., 1996b, Astronomische Nachrichten, 317, 315
- Stoll et al. (1996c) Stoll D., Tiersch H., Braun M., 1996c, Astronomische Nachrichten, 317, 383
- Stoll et al. (1997b) Stoll D., Tiersch H., Braun M., 1997b, Astronomische Nachrichten, 318, 89
- Stoll et al. (1997a) Stoll D., Tiersch H., Cordes L., 1997a, Astronomische Nachrichten, 318, 7
- Stoll et al. (1997c) Stoll D., Tiersch H., Cordis L., 1997c, Astronomische Nachrichten, 318, 149
- Stoll et al. (1993a) Stoll D., Tiersch H., Oleak H., Baier F., MacGillivray H. T., 1993a, Astronomische Nachrichten, 314, 225
- Stoll et al. (1993b) Stoll D., Tiersch H., Oleak H., Baier F., MacGillivray H. T., 1993b, Astronomische Nachrichten, 314, 317
- Stoll et al. (1994a) Stoll D., Tiersch H., Oleak H., MacGillivray H. T., 1994a, Astronomische Nachrichten, 315, 11
- Stoll et al. (1994b) Stoll D., Tiersch H., Oleak H., MacGillivray H. T., 1994b, Astronomische Nachrichten, 315, 97
- Strateva et al. (2001) Strateva I., et al., 2001, AJ, 122, 1861
- Tago et al. (2008) Tago E., Einasto J., Saar E., Tempel E., Einasto M., Vennik J., Müller V., 2008, A&A, 479, 927
- Takahashi et al. (2000) Takahashi I., Fukazawa Y., Kodaira K., Makishima K., Nakazawa K., Xu H., 2000, PASJ, 52, 769
- Takahashi et al. (2001) Takahashi I., Makishima K., Nakazawa K., Fukazawa Y., Kodaira K., Xu H., 2001, in Inoue H., Kunieda H., eds, New Century of X-ray Astronomy Vol. 251 of Astronomical Society of the Pacific Conference Series. pp 486
- Tanaka et al. (2005) Tanaka M., Kodama T., Arimoto N., Okamura S., Umetsu K., Shimasaku K., Tanaka I., Yamada T., 2005, MNRAS, 362, 268
- Thompson (1976) Thompson L. A., 1976, PASP, 88, 662
- Tiersch (1976) Tiersch H., 1976, Astronomische Nachrichten, 297, 301
- Tiersch et al. (1996a) Tiersch H., Oleak H., Stoll D., Amirkhanian A. S., Neizvestny S., Bohringer H., 1996a, in From Stars to Galaxies: the Impact of Stellar Physics on Galaxy Evolution. pp 523
- Tiersch et al. (1994) Tiersch H., Oleak H., Stoll D., Bohringer H., 1994, in MacGillivray H. T., ed., Astronomy from Wide-Field Imaging Vol. 161 of IAU Symposium. pp 623
- Tiersch et al. (1993) Tiersch H., Oleak H., Stoll D., Böhringer H., MacGillivray H. T., 1993, in Klare G., ed., Astronomische Gesellschaft Abstract Series Vol. 9 of Astronomische Gesellschaft Abstract Series. pp 190
- Tiersch et al. (1996b) Tiersch H., Oleak H., Stoll D., Schwope A. D., Neizvestny S., Böhringer H., Cordis L., 1996b, in New Light on Galaxy Evolution. pp 453
- Tiersch et al. (1995) Tiersch H., Oleak H., Stoll D., Schwope A. D., Neizvestny S., Cordis L., MacGillivray H. T., 1995, in Buzzoni A., Renzini A., Serrano A., eds, Fresh Views of Elliptical Galaxies Vol. 86 of Astronomical Society of the Pacific Conference Series. pp 89
- Tiersch et al. (1999a) Tiersch H., Stoll D., Neizvestny S., Amirkhanian A. S., Egikian A. G., 1999a, in Terzian Y., Khachikian E., Weedman D., eds, Activity in Galaxies and Related Phenomena Vol. 194 of IAU Symposium. pp 394
- Tiersch et al. (1999b) Tiersch H., Stoll D., Tovmassian H. M., Neizvestny S., Amirkhanian A. S., Mendes de Oliveira C., 1999b, in Giuricin G., Mezzetti M., Salucci P., eds, Observational Cosmology: The Development of Galaxy Systems Vol. 176 of Astronomical Society of the Pacific Conference Series. pp 131
- Tiersch et al. (2002) Tiersch H., Tovmassian H. M., Stoll D., Amirkhanian A. S., Neizvestny S., Böhringer H., MacGillivray H. T., 2002, A&A, 392, 33
- Tovmassian et al. (2005c) Tovmassian H., Tiersch H., Chavushyan V. H., Tovmassian G. H., Navarro S. G., Neizvestny S., Torres-Papaqui J. P., 2005c, A&A, 439, 973
- Tovmassian (2001) Tovmassian H. M., 2001, PASP, 113, 543
- Tovmassian et al. (1999b) Tovmassian H. M., Chavushyan V. H., Verkhodanov O. V., Tiersch H., 1999b, ApJ, 523, 87
- Tovmassian et al. (1999a) Tovmassian H. M., Martinez O., Tiersch H., 1999a, A&A, 348, 693
- Tovmassian et al. (1998) Tovmassian H. M., Mazzarella J. M., Tovmassian G. H., Stoll D., Tiersch H., 1998, A&AS, 130, 207
- Tovmassian & Tiersch (2001) Tovmassian H. M., Tiersch H., 2001, A&A, 378, 740
- Tovmassian et al. (2003b) Tovmassian H. M., Tiersch H., Chavushyan V. H., Tovmassian G. H., 2003b, A&A, 401, 463
- Tovmassian et al. (2006) Tovmassian H. M., Tiersch H., Chavushyan V. O., Tovmassian G. H., Neizvestnyi S. I., Torres-Papaqui J. P., Rudnitskii G. M., 2006, Astronomy Reports, 50, 861
- Tovmassian et al. (2003a) Tovmassian H. M., Tiersch H., Navarro S. G., Chavushyan V. H., Tovmassian G. H., Amirkhanian A. S., Neizvestny S., 2003a, Revista Mexicana de Astronomia y Astrofisica, 39, 275
- Tovmassian et al. (2004) Tovmassian H. M., Tiersch H., Navarro S. G., Chavushyan V. H., Tovmassian G. H., Neizvestny S., 2004, A&A, 415, 803
- Tovmassian et al. (2005a) Tovmassian H. M., Tiersch H., Tovmassian G. H., Chavushyan V. H., Navarro S. G., Neizvestny S., Torres-Papaqui J. P., 2005a, Revista Mexicana de Astronomia y Astrofisica, 41, 3
- Tovmassian et al. (2007) Tovmassian H. M., Tiersch H., Tovmassian G. H., Chavushyan V. H., Neizvestny S., Pramskij A. G., Torres-Papaqui J. P., Rozas M., 2007, Revista Mexicana de Astronomia y Astrofisica, 43, 45
- Tovmassian et al. (2005b) Tovmassian H. M., Tiersch H., Tovmassian G. H., Neizvestny S., Torres-Papaqui J. P., Pramskij A. G., 2005b, Astronomische Nachrichten, 326, 362
- Tovmassian et al. (2001) Tovmassian H. M., Yam O., Tiersch H., 2001, Revista Mexicana de Astronomia y Astrofisica, 37, 173
- Tully & Fisher (1987) Tully R. B., Fisher J. R., 1987, Atlas of Nearby Galaxies. Annales de Geophysique
- Vennik et al. (1993) Vennik J., Richter G. M., Longo G., 1993, Astronomische Nachrichten, 314, 393
- Vikhlinin et al. (1999) Vikhlinin A., McNamara B. R., Hornstrup A., Quintana H., Forman W., Jones C., Way M., 1999, ApJ Let., 520, L1
- Walke & Mamon (1989) Walke D. G., Mamon G. A., 1989, A&A, 225, 291
- Yasuda et al. (2001) Yasuda N., et al., 2001, AJ, 122, 1104