11email: totahy@utu.fi, jarkot@utu.fi, reunanen@ftml.net 22institutetext: INAF – Osservatorio Astronomico di Padova, Vicolo dell’Osservatorio 5, I-35122 Padova, Italy
22email: falomo@pd.astro.it
The stellar content of low redshift radio galaxies from near-infrared spectroscopy
Abstract
Context. We present medium spectral resolution near-infrared (NIR) -band spectra for eight low redshift () radio galaxies to study the NIR stellar properties of their host galaxies. The sample was selected from the radio galaxy sample imaged previously in the - and -band. They were found to be bluer than inactive elliptical galaxies, possibly indicating a recent star formation episode. As a homogeneous comparison sample, we used nine inactive elliptical galaxies that were observed with the same telescope and detector with similar resolution and wavelength range.
Aims. The aim of the study is, by using the advantage of NIR absorption features, to compare the NIR spectral properties of radio galaxies to those of inactive early-type galaxies and, furthermore, produce the first NIR -band spectra for low redshift radio galaxies.
Methods. For the radio galaxy and inactive elliptical samples, spectral indices of several diagnostic absorption features, namely SiI(m), CO(m) in the -band and NaI(m), CaI(m), CO(m) in the -band, were measured. The strength of absorption lines depends on the luminosity and/or temperature of stars and, therefore, spectral indices can be used to trace the stellar population of galaxies. To characterize the age of the populations, the measured EWs of the absorption features were fitted with the corresponding theoretical evolutionary curves of the EWs calculated by the stellar synthesis model.
Results. On average, EW(CO 2.29) of radio galaxies is somewhat greater than that of inactive ellipticals. Most likely, EW(CO 2.29) is not significantly affected by dilution, and thus indicating that elliptical galaxies containing AGN are in a different stage in their evolution than inactive ellipticals. This is also supported by comparing other NIR absorption line features, such as CaI and NaI, with each other. Based on the theoretical evolutionary curves of EWs absorption features are consistent with the intermediate age stellar population, suggesting that host galaxies contain both an old and intermediate age components. Intermediate age population is also consistent with previous optical spectroscopy studies, which have shown evidence on the intermediate age (2 Gyr) stellar population of radio galaxies, and also in some of the early-type galaxies.
Conclusions. Intermediate stellar population component indicates that radio galaxies have experienced a star formation epoch relatively recently. The existence of intermediate stellar population is a link between the star formation episode, possibly induced by interaction or merging event, and the triggering of the nuclear activity.
Key Words.:
galaxies: active – galaxies: elliptical and lenticular, cD – galaxies: general – galaxies: interactions – galaxies: nuclei – galaxies: stellar content1 Introduction
Recent observations have shown that most bulge-dominated galaxies contain a supermassive black hole in their center (e.g., Combes 2005). This indicates that nuclear activity phenomenon can be a transient phase in evolution history of a galaxy that can be understood in terms of the central black hole fueled by in-falling gas toward the central region. The in-falling gas might be triggered either by merging processes of the spheroid formation at high redshift or during milder interaction of the galaxies at lower redshift (Cavaliere & Vittorini 2000). Dynamic interaction of an early-type galaxy with a gas rich late-type galaxy may often induce strong star formation as indicated by spectroscopic studies of local field early-type galaxies belonging to pairs or exhibiting shells (e.g., Longhetti et al. 2000; Tantalo & Chiosi 2004) and theoretical studies of the merging process (e.g., Kojima & Noguchi 1997). Thus, the same mechanism may be responsible for both the nuclear activity and star formation. Characterizing the stellar populations in the central regions of galaxies, where supermassive black holes and recent star formation may co-exist, provides essential information for probing their origin and evolution. AGN feedback provides a mechanism to quench star formation on a short timescale (e.g., Springel et al. 2005) and to replicate the observed bimodal color distribution of galaxies (e.g., Strateva et al. 2001). The energy released by the AGN expels enough gas to quench both star formation and further black hole growth and, thus, determines the duration of starburst and AGN phase.
Most luminous AGN are hosted by large and luminous (massive) elliptical galaxies (e.g., Falomo & Kotilainen 1999; Govoni et al. 2000; Heidt et al. 2004; Kotilainen & Falomo 2004; Kotilainen et al. 2005; Hyvönen et al. 2007b). There is increasing evidence that the host galaxies of various types of AGN are bluer than inactive ellipticals (Govoni et al. 2000; Schade et al. 2000; Örndahl et al. 2003; Sanchez et al. 2004; Jahnke et al. 2004; Kotilainen & Falomo 2004; Hyvönen et al. 2007a) and they do not follow the color-magnitude relation of inactive ellipticals (Peletier et al. 1990) indicating a recent star formation episode. This scenario is also supported by optical spectroscopic studies of nearby radio galaxies (RG) (Raimann et al. 2005; Holt et al. 2007). It is worth to note that the observed blue colors are not affected by the dust content of the galaxy, because in the presence of dust reddening the intrinsic color of the galaxy would be even bluer. Inactive elliptical galaxies have experienced a relatively short star formation episode at 2 and evolved passively ever since (Carretero et al. 2007). However, the distribution of the ages of stellar population of inactive ellipticals is inhomogeneous, often showing an intermediate age population (3 Gyr), in addition to the energetically dominant, very old (15 Gyr) populations (Yamada et al. 2006; Silva et al. 2008). It is important to note that there is a downsizing effect, in the sense that the intermediate age populations are mostly found in early-type galaxies with low velocity dispersion, i.e. low mass, while the most massive galaxies are all very old. However, there are also indications that galaxies in denser enviroments (clusters) are slightly older than field galaxies (Trager et al. 2000; Kuntschner et al. 2002). It is likely that the old stellar population is also dominating the stellar content of AGN hosts which has undergone a single recent star formation burst with only a small fraction of mass involved in the episode. The broad distribution of the colors most probably indicates an object-to-object difference in the age since the last star formation episode. The existence and the age of the young stellar population is a link between the interaction and/or merging event and the star formation episode and the triggering of the nuclear activity. Unfortunately, age estimates are not straightforward because of the metallicity effect. Strength of CO absorption lines of old and metal-rich stellar populations is similar to young starbursts with lower metallicity. Also, the cooler the younger -relation does not always hold because temperature depends on metallicity.
Luminosity of the majority of AGN is dominated by bright nuclear source contaminating the luminosity of the underlying host galaxy. Thus, spectroscopic observations of the stellar content of the host is difficult. Such studies (e.g., Boroson et al. 1985; Oliva et al. 1995; Origlia et al. 1997; Oliva et al. 1999; Mobasher & James 2000) have usually been limited by small heterogeneous samples, arrays and wavelength range. These studies have only recently been followed by systematic studies by e.g. Nolan et al. (2001), Jahnke (2002), Raimann et al. (2005) and Silva et al. (2008). According to the unified model of radio-loud AGN, RGs are seen edge-on so that the bright central region is obscured making spectroscopy of the inner part of the host galaxy much easier. UV/optical spectroscopy of the inner region of RGs suggests that a large number of RGs contain a significant contribution from a young stellar population (e.g., Aretxaga et al. 2001; Tadhunter et al. 2002; Wills et al. 2004; Raimann et al. 2005; Holt et al. 2007), probably related to star formation episode in the near past. Optical Lick spectral indices have usually been used in stellar population studies (Worthey & Ottaviani 1997), but they have problems due to blended features and various population of galaxies. Furthermore, in the optical wavelengths, spectral features from the young stellar population are difficult to observe due to possible presence of other emission components, such as nebular continuum, and direct and scattered AGN emission. NIR spectroscopy has advantages compared to optical, because RGB stars dominate at m and the wavelength region contains many diagnostic stellar absorption lines (e.g., SiI m, CO(6-3) m, NaI m, CaI m and CO(2-0) bandhead m) which can be used as indicators of stellar population in terms of their temperature and/or luminosity.
NIR spectroscopy has mostly been used to study high redshift RGs and there are only few studies for individual sources at low redshift (Bellamy et al. 2003; Tadhunter et al. 2003). We present NIR spectroscopy for eight nearby () RGs (one of them, PKS 0521-36 is also classified as BL Lac object) with reasonable spatial resolution (kpc) and medium spectral resolution () to study the NIR properties and ages of their stellar populations compared with the sample of nine inactive ellipticals. Except for individual sources (e.g., Tadhunter et al. 2002) these are the first NIR spectra of a sizable sample of low redshift RGs. The RG sample was previously observed in - and -band by Fasano et al. (1996), and detailed – color information are available for them. The sample was selected among the objects of Govoni et al. (2000) that are bluer than inactive elliptical galaxies and do not follow the – color-magnitude relation of inactive ellipticals. Long-slit spectra of RGs are extracted across the nucleus to detect all the important diagnostic absorption lines, and extended emission of the host galaxy can be studied to large distance from the nucleus. Our aim is to study the stellar population of RGs based on the NIR stellar absorption indices, and to compare the indices of RGs with inactive counterparts of similar morphology types. This will have important implications for understanding nuclear star formation histories and the evolution of RGs.
In Section 2, we describe the sample, observations, data reduction, and methods of analysis. In Section 3, we present the results and discussion concerning the properties of the galaxies. Summary and conclusions are given in Section 4.
2 Observations, data reduction, and analysis
The observations of the RGs were carried out in September 2005 at the ESO New Technology Telescope (NTT) using SOFI camera with pixel scale 0.288 arcsec pix-1. The medium resolution () long-slit -band spectra were taken across the nucleus with red grism and slit width 1.0 arcsec. The wavelength range of the spectra is from 1.5 to m with typical integration time of 1440 s. The spectra of each target were taken with pairs using ABBA observing cycle and moving the target in the slit.
Data reduction was performed using IRAF111IRAF is distributed by the National Optical Astronomy Observatories, which are operated by the Association of Universities for Research in Astronomy, Inc., under cooperative agreement with the National Science Foundation.. Pairs were subtracted from each other to eliminate background sky emission and then divided by the flat-field image. Bad pixels and cosmic rays were masked out. Wavelength calibration was done using Xe-arc lamp calibration frames. Galaxy spectra were flux calibrated and divided by spectrophotometric standard star and then averaged. The nuclear (1.5 arcsec corresponding to 1.2 kpc in physical scale) and off-nuclear extended emission spectra were extracted for each target. In order to achieve sufficient S/N-ratio, the off-nuclear spectra were added together from both sides of the nucleus (1.5 arcsec/1.2 kpc at each side). The -band spectra were normalized by fitting the continuum level to both sides of the absorption features. In the -band the continuum was fitted only to the shortward wavelengths from the CO bandhead. The journal of the RG sample is presented in Table 1.
To have a reliable comparison between RGs and inactive ellipticals it is important that both samples have similar spectral resolution and aperture. As an inactive comparison sample we used the sample obtained and kindly provided for us by V. Ivanov (see also Cesetti et al. (2008)). The comparison sample consists of 7 targets that were also observed by NTT/SOFI in March/April 2006 with an identical instrument configurations. These galaxies are classified as giant ellipticals with morphology type but, in order to have morphology type galaxies also in the comparison sample, we included two galaxies from the inactive early-type galaxy survey observed previously by us with NTT/SOFI using the same set of parameters and the reduction process as for the RG sample (Reunanen et al., in prep.). This data altogether gives us optimal spectral resolution matched sample for stellar population comparison. The journal of the inactive elliptical galaxy sample is presented in Table 2.
The equivalent widths (EW) of the spectral lines were derived by integrating over the lines of the normalized spectra. The integration limits for the particular line were the same for all targets. The accuracy of the EWs is limited by the difficulty of determination of the continuum level in the vicinity of the particular line. Especially this holds for the -band which is rich in spectral features, and for the CO(2-0) bandhead in the -band because the continuum level has to be extrapolated longward of m. Furthermore, it is worth to keep in mind, that the stellar features are blended due to atomic and molecular features (Wallace & Hinkle 1996). There is no velocity dispersion data available for the RG sample, and we have assumed that they are roughly in agreement with those of inactive ellipticals used in this work. However, it is worth to note that the measured EWs of the indices are evidently upper limits due to spreading caused by the velocity dispersion. The possible dependence of the EWs on velocity dispersion and resolution was checked by degrading the medium resolution stellar spectra from Wallace & Hinkle (1997) to the lower resolution applicable for the RG sample, and measuring the indices of all the five diagnostic features for both resolutions. This comparison showed that the indices do not significantly depend on the degradation, in the sense that all the measured indices agree within the errors. In the normalized spectrum, a straight line was fit to the continuum points around the spectral feature. Central wavelength ranges for each feature were 1.585-1.593m for SiI, 1.616-1.627m for CO(6-3) and 2.2924-m for CO(2-0). For a direct comparison, the same wavelength ranges were adopted as those in Origlia et al. (1993) and Silva et al. (2008). The errors of the EWs are dominated by the uncertainties in fitting the continuum level and are typically in -band and -band metallic lines, and for the -band CO(2-0) feature.
| Target | T | Date | ||||
| mag | min | |||||
| (1) | (2) | (3) | (4) | (5) | (6) | (7) |
| PKS 0023-33 | 0.0498 | -5 | 1.47 | 11.3 | 32 | 27/09/2005 |
| 3C 29 | 0.0450 | - | 1.57 | 11.0 | 24 | 26/09/2005 |
| NGC 612 | 0.0298 | -1.2 | 1.59 | 10.1 | 24 | 25/09/2005 |
| ESO 552-G14 | 0.0317 | -2.7 | 1.56 | 10.6 | 24 | 27/09/2005 |
| PKS 0521-36 | 0.0553 | - | 1.48 | 11.0 | 32 | 25/09/2005 |
| ESO 528-G36 | 0.0408 | -5 | 1.48 | 10.8 | 24 | 27/09/2005 |
| NGC 6998 | 0.0397 | -5 | 1.84 | 10.8 | 32 | 26/09/2005 |
| PKS 2158-380 | 0.0333 | - | 1.13 | 11.4 | 32 | 27/09/2005 |
-
a
Column (1) gives the name of the target; (2) redshift; (3) morphology type; (4) the colour (Fasano et al. 1996); (5) -band magnitude from 2MASS in 5 arcsec radius aperture; (6) integration time, and (7) the date of the observation.
| Target | T | Date | ||
|---|---|---|---|---|
| s | ||||
| (1) | (2) | (3) | (4) | (5) |
| NGC 2640 | 0.00350 | -3 | 32 | 09/03/2006 |
| NGC 4478 | 0.00469 | -5 | 40 | 17/04/2006 |
| NGC 4472 | 0.00333 | -5 | 33 | 17/04/2006 |
| NGC 4546 | 0.00350 | -3 | 32 | 11/03/2006 |
| NGC 4564 | 0.00377 | -5 | 30 | 17/04/2006 |
| NGC 4621 | 0.00143 | -5 | 20 | 18/04/2006 |
| NGC 4649 | 0.00365 | -5 | 33 | 17/04/2006 |
| NGC 4697 | 0.00415 | -5 | 23 | 17/04/2006 |
| NGC 5576 | 0.00505 | -5 | 25 | 17/04/2006 |
-
a
Column (1) gives the name of the target; (2) redshift; (3) morphology type; (4) integration time, and (5) the date of the observation.
3 Results
The -band off-nuclear and nuclear spectra for RG sample are presented in Fig. 1. In all off-nuclear and nuclear spectra of RGs, -band spectral absorption features from stellar population (SiI, CO(6-3)) are clearly visible as are in the most cases the features NaI, CaI, CO(2-0) in the -band. The EWs of all diagnostic spectral features can be measured for all inactive elliptical galaxies, except SiI in two cases (NGC 4472, NGC 4564). The EWs of the absorption lines for RGs and inactive ellipticals are presented in Table 3.
By combining each individual redshift corrected spectra together, we also created a representative average spectrum for RGs and inactive ellipticals (PKS 0521-36 was not included in the composite spectrum of RGs) which are shown in Fig. 2. These spectra can find applications as template spectra for the underlying galaxy which can be subtracted from the spectra of composite stellar systems (i.e. galaxies hosting an AGN).


| Target | T | SiI | CO(6-3) | NaI | CaI | CO(2-0) |
|---|---|---|---|---|---|---|
| [m] | 1.589 | 1.619 | 2.207 | 2.263 | ||
| RGs: off-nuclear | ||||||
| PKS 0023-33 | -5 | 5.3 | 5.5 | - | 3.7 | 17.1 |
| 3C 29 | - | 4.5 | 4.6 | 4.2 | 3.5 | 20.5 |
| NGC 612 | -1.2 | 2.6 | 4.5 | 3.4 | 3.0 | 18.8 |
| ESO 552-G14 | -2.7 | 3.4 | 4.5 | 4.4 | 2.9 | 15.1 |
| PKS 0521-36 | - | 1.2 | 2.5 | 1.1 | 2.5 | 5.4 |
| ESO 528-G36 | -5 | 2.3 | 3.3 | 4.4 | 3.1 | 20.7 |
| NGC 6998 | -5 | 2.8 | 4.2 | 3.9 | 3.8 | 29.0 |
| PKS 2158-380 | - | 4.8 | 3.5 | 4.9 | 3.3 | 20.6 |
| RGs: nuclear | ||||||
| PKS 0023-33 | -5 | 3.1 | 6.0 | 4.5 | 2.9 | 17.5 |
| 3C 29 | - | 2.5 | 3.8 | - | - | - |
| NGC 612 | -1.2 | 2.6 | 3.8 | 3.9 | 3.4 | 20.1 |
| ESO 552-G14 | -2.7 | 2.3 | 5.1 | 2.5 | 2.3 | 14.9 |
| PKS 0521-36 | 0.8 | 3.1 | - | - | - | |
| ESO 528-G36 | -5 | 1.8 | 5.8 | 3.7 | 7.7 | 13.3 |
| NGC 6998 | -5 | 2.3 | 3.3 | 5.3 | 5.8 | 16.5 |
| PKS 2158-380 | - | 3.8 | 5.1 | 3.9 | 3.4 | 14.6 |
| Ellipticals: | ||||||
| NGC 2640 | -3 | 5.1 | 3.1 | 5.1 | 3.1 | 20.7 |
| NGC 4478 | -5 | 1.7 | 5.0 | 3.5 | 3.7 | 12.5 |
| NGC 4472 | -5 | - | 4.5 | 5.5 | 2.7 | 17.4 |
| NGC 4546 | -3 | 4.8 | 4.5 | 4.5 | 2.5 | 17.3 |
| NGC 4564 | -5 | - | 4.0 | 5.5 | 2.8 | 17.4 |
| NGC 4621 | -5 | 2.5 | 6.5 | 5.2 | 5.6 | 16.6 |
| NGC 4649 | -5 | 2.1 | 5.1 | 4.9 | 2.7 | 17.2 |
| NGC 4697 | -5 | 2.1 | 5.5 | 4.1 | 3.5 | 16.3 |
| NGC 5576 | -5 | 2.2 | 5.9 | 4.0 | 2.4 | 14.2 |
3.1 Near-infrared line indices as a stellar population indicators
NIR spectra can be used as a tool for studying stellar population in galaxies and star clusters, because the spectral domain contains many strong stellar absorption features. Especially, the -band has been widely studied (e.g., Merrill & Ridgway 1979; Kleinmann & Hall 1986; Wallace & Hinkle 1997), and it is a natural choice for studying reddened (dusty) galaxies at low redshift (e.g., Mobasher & James 2000; Mannucci et al. 2001). However, -band is even more suitable for population studies because in this band non-stellar emission, mostly caused by dust, has smaller effect than in the -band but -band domain has been studied systematically only relatively recently (e.g., Origlia et al. 1993; Oliva et al. 1995; Fremaux et al. 2007).
The most evident absorption features in the -band are the molecular CO(2-0) bandhead (m), atomic Br- (m), NaI (m), and CaI (m) lines. Br- is the strongest absorption feature within stars earlier than K5, but becomes undetectable in stars later than K5 (Kleinmann & Hall 1986), while NaI is the strongest atomic feature when effective temperature is (Ali et al. 1995). -band has a very complex absorption line pattern due to a number of metallic and molecular lines, especially in cool stars. The most studied -band features are atomic SiI (m) and molecular CO(6-3) (m) (e.g., Origlia et al. 1993). It is well known, that the NaI, CaI and CO features in K and M giant stars become stronger with redder – color (Ramirez et al. 1997; Förster Schreiber 2000; Frogel et al. 2001). At a given –, giants in more metal rich clusters have stronger NaI and CaI features (Frogel et al. 2001). In the NIR, the integrated light is dominated by stars that are very different from those that contribute significantly at visible wavelengths. The first overtone 12CO bandheads are the most prominent features in the NIR spectra of old and intermediate age populations, and so are potentially prime diagnostics of stellar content. The depth of these features are predicted to be sensitive to population parameters (e.g., Vázquez et al. 2003). NaI and CaI indices sample transitions from more than one element, complicating the sensitivity of these lines to chemical abundance. Such contamination is also common among optical line indices (e.g., Worthey et al. 1994). Whereas the integrated light at visible wavelengths comes from a mix of stellar types, the -band light from all but the youngest stellar systems is dominated by evolved giants and AGB (Asymptotic Giant Branch) stars, whose photometric and spectroscopic properties are sensitive to age and metallicity (Frogel et al. 1978; Maraston 2005). The relative strengths of the NIR features can be used to compare the stellar contents of the central regions of galaxies, and to provide insights into their history.
Currently there are no self-consistent theoretical spectral synthesis models for the interpretation of NIR spectra of galaxies. Thus, one has to rely on e.g. their comparison with high-resolution NIR stellar spectral atlases (e.g., Wallace & Hinkle 1996). The usefulness of stellar absorption lines as tools for tracing the stellar population of galaxies is based on the fact that particular lines are sensitive to the spectral type (temperature) and/or luminosity (gravity) of the star (Kleinmann & Hall 1986; Ali et al. 1995; Ramirez et al. 1997). CO lines decrease with increasing temperature due to variation of the CO/C abundance ratio, being detectable at temperatures lower than K and increasing with luminosity. Thus, -band CO bandhead is very strong in young giant and supergiant stars (10 Myr-100 Myr) and strong in cool asymptotic giant branch (AGB) stars (100 Myr-1 Gyr; Oliva et al. (1995)), while it is weaker in older population. This makes CO bandhead suitable to trace recent star formation in galaxies (Mayya 1997). However, some line ratios, such as EW(CO 1.62)/EW(SiI 1.59) and EW(CO 1.62)/EW(CO 2.29), are even better temperature indicators than single lines (Origlia et al. 1993). Especially, the former ratio is useful because the two lines have very similar wavelengths and therefore the ratio is not sensitive to dilution of the emission of the hot gas.
3.2 Near-infrared line indices of radio galaxies
Non-stellar thermal, such as dust surrounding young star forming regions, and/or non-thermal dilution reduce the intrinsic values of EWs originating from the stellar population. However, the dust observed in NIR is close to its sublimation temperature, and in such cases HII emission line series are expected to be observed. The comparison of absorption indices in different filters depends on the level of dilution by the non-stellar component that can be different in - and -band. The dilution fraction of the continuum emission at m can be estimated from the plot of EW(CO 1.62) vs. EW(CO 1.62)/EW(Si 1.59) which is shown in Fig. 3. Objects with diluted stellar features lie below the locus occupied by stars, because they have a shallower CO(1.62) index, while EW(CO 1.62)/EW(Si 1.59) is not significantly affected by dilution since two the features lie close in wavelength. The fraction of non-stellar continuum is simply given by vertical displacement of the point in the diagram. The dilution at m can be determined in a similar way from the plot of EW(CO 1.62) vs. EW(CO 1.62)/EW(CO 2.29) shown in Fig. 4. In that case, objects with significant non-stellar continua lie on the right hand side from the enclosed region. Note, that one first needs to correct EW(CO 1.62) for dilution before determining the non-stellar fraction from the horizontal displacement in the diagram. In the - and -band, all off-nuclear RGs have either no or only slight dilution, while the BL Lac object (PKS 0521-36) has significant dilution in both bands reducing the measured EWs. Its large non-thermal dilution is expected in terms of powerful jet emission from the BL Lac object. None of the inactive elliptical galaxies show any dilution in the -band indicating that the EWs of RGs and ellipticals are not significantly affected by non-stellar dilution. Another estimate of dilution can be obtained from comparison of nuclear and off-nuclear continuum shapes, in which case redder spectrum is expected in nucleus. The comparison was done between off-nuclear and nuclear spectra of RGs, but there was no difference between the spectra. This indicates that no significant amount of dust is present in the nuclear region of RGs and, as a consequence, HII emission lines are not seen in the RG spectra.
Table 4 gives the average values of off-nuclear and nuclear EWs of SiI, CO(1.62), NaI, CaI and CO(2.29) absorption lines for RGs and the corresponding values for inactive ellipticals. While the off-nuclear EWs of RGs are generally in agreement with the nuclear EWs of RGs and those of ellipticals, the off-nuclear EW(CO 2.29) of RGs is larger than that in the nuclear region of RGs and in elliptical galaxies. As was previously mentioned, it is unlikely that this difference is caused by non-stellar dilution. The EW(CO 2.29) is sensitive to the luminosity class of stars being smaller in dwarfs than in giant stars. The difference of EW(CO 2.29) between RGs and inactive ellipticals may indicate a different stellar populations.
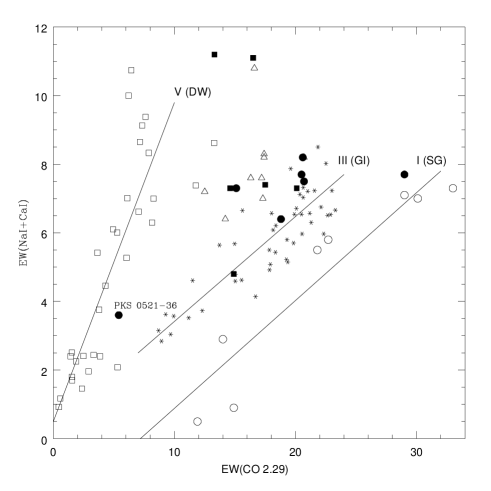
Figure 5 shows the EW(NaI+CaI) as a function of EW(CO 2.29) for off-nuclear and nuclear RGs, and inactive elliptical galaxies together with stars of different spectral type. Caution should be exercised when comparing stellar and galactic data, as galaxies are composite stellar systems and their spectra show the integrated contributions from stars spanning a range of properties. Still, given that the NIR spectral region is dominated by evolved (RGB) stars, this issue is not as critical as at visible wavelengths, where stars contribute over a much larger range of evolutionary states (both RGB and main sequence stars e.g. Maraston (2005)). All three luminosity classes of stars have a relatively tight linear correlation between EW(NaI+CaI) and EW(CO 2.29). Most of the off-nuclear RGs are in good agreement with the relation of giant (III) stars, while inactive ellipticals deviate more strongly from that relation. On the other hand, the plot of EW(CO 2.29) vs. EW(CO 1.62)/EW(Si 1.59) (Fig. 6) indicates that the stellar populations are mostly dominated by supergiants (I). However, it is possible that the CO(1.62) line is underestimated or the SiI line overestimated decreasing the line ratio of EW(SiI)/EW(CO 1.62) and thus, in both cases, shifting the real data points to the left in Fig. 6. It is reasonable that SiI line is slightly overestimated, because the absorption feature is located in the -band which has numerous absorption lines and, in medium resolution spectra, the lines are blended. In conclusion, the majority of RGs are consistent with the relation of giant stars. Only a few RGs are readily in agreement with ellipticals, while the majority are displaced toward giants and supergiants indicating the difference in their stellar populations.
Almost all RGs and inactive ellipticals have EW(CO 2.29) which is larger than the EW of K giants (from to ) or main sequence stars. In fact, the only stars with EW of CO(2.29) higher than are M giants and K and M supergiants. The stellar population of these galaxies must therefore be dominated by very cool stars, probably M giants, to match the measured EWs. Note, however, that since M stars are much brighter in the -band than K stars, this does not imply that M giants are the only significant luminosity-weighted population.
Star formation in the vicinity of nucleus can be activated by nuclear activity. Indeed, there is evidence for ongoing circumnuclear star formation in the central region of the BL Lac PKS 2005-489 (Bressan et al. 2006). Different star formation rates within a galaxy might set up a radial stellar population gradient which can be seen as a difference in line strengths between nuclear and off-nuclear spectra. However, non-stellar dilution must be taken into account that weakens the absorption lines of stellar population in the nuclear region. Only 3C 29 shows a systematic variation in the strength of the lines between off-nuclear and nuclear spectra. The variation of the line strengths of 3C 29 can be due to a stellar population gradient but, however, deeper and better spatial resolution spectra are needed to confirm the possible gradient.
EW(CaI) and EW(CO 2.29) of off-nuclear RGs and elliptical galaxies are plotted against EW(NaI) in Fig. 7. They are compared with the relation of solar metallicity cluster stars and purely old population galaxies adapted from Silva et al. (2008). In the plot of CaI vs. NaI, majority of the ellipticals occupy the locus which is consistent with the relation of purely old galaxies, whereas all RGs have larger CaI indices. Furthermore, in both EW(CaI) and EW(CO 2.29) plots, majority of the RGs and ellipticals also have larger NaI indices than those of solar metallicity cluster stars, being consistent with the results obtained by Silva et al. (2008) for early-type galaxies of Fornax cluster. Unlike found by Cesetti et al. (2008), our elliptical galaxy sample do not show a significant correlation between EW(CaI) and EW(NaI). In both plots, RGs deviates from the ellipticals suggesting that elliptical galaxies with AGN are in a different stage in their evolution than inactive counterparts.
| SiI | CO(6-3) | NaI | CaI | CO(2-0) | |
|---|---|---|---|---|---|
| RG: off-nuc | |||||
| RG: nuc | |||||
| Ellipticals: | |||||
| Supergiants (I): | 4.30.6 | 4.62.7 | - | - | 17.68.0 |
| Giants (III): | 3.80.4 | ||||
| Dwarfs (V): | 3.20.8 |


3.3 Age estimates for stellar population of radio galaxies
It is well known that the majority of inactive elliptical galaxies have not experienced recent significant star formation, but are dominated by passively evolved relatively old population of late-type giant RGB stars. However, many recent imaging (e.g., Govoni et al. 2000; Hyvönen et al. 2007a) and spectroscopic studies (e.g., Raimann et al. 2005) have shown that, unlike inactive ellipticals, RGs have experienced a recent star formation episode and, thus, bluer host galaxy colors are due to younger stellar population component. Raimann et al. (2005) obtained spectra for 24 RGs at optical wavelengths, and they found a systematic difference in stellar population between RGs and inactive ellipticals, in the sense that RGs have a larger contribution from an intermediate age population.
Although stellar population synthesis models (e.g., Fioc & Rocca-Volmerange 1997; Bruzual & Charlot 2003) at NIR wavelengths are not as well developed as at visible wavelengths, they can be used to provide estimates for the ages of the stellar population of galaxies (Riffel et al. 2008). Theoretical spectral fitting is not currently possible at NIR, but synthesis models can be used to derive the time evolution of the EWs of diagnostic stellar lines parametrized by IMF and the metallicity of stellar population.
To calculate the evolution of EW for the NIR absorption lines we used the model of Maraston (2005) with Salpeter IMF, solar metallicity and SSP model. That model was preferred over the continuous star formation model because the latter predicts Br- lines which are not seen in our RG spectra and, furthermore, in previous studies (Kennicutt 1998; Bendo & Joseph 2004) the observed spectra were found to be more consistent with the SSP model. Metallicity and age of stellar populations are degenerate, in the sense that increasing metallicity generates older stellar populations. However, very low metallicities of RGs and ellipticals are very unlikely because the observed line indices are significantly greater than those predicted by the low metallity models.
The measured EWs of each absorption line of off-nuclear RGs and inactive elliptical galaxies were compared with corresponding EW vs. time theoretical curve computed by the synthesis model, allowing to estimate the ages of the stellar population. Note that before this comparison, the observed spectra (30 Å) were smoothed to the same resolution of the Maraston05 model (100 Å). Theoretical curves were calculated using exactly the same parameters as those in a recent NIR spectroscopic study of starburst galaxies by Riffel et al. (2008), and we refer to their Fig. 4 for the behavior of the absorption lines as a function of age. Fitting was performed for -band CaI feature and CO(2.29) bandhead, and the results of the fitting are given in Table 5. Note that the theoretical EW values are not unique with evolutionary time, but the same EW can have two to four different time values between very young (10 Myr) and intermediate age (2 Gyr) stellar population fits. EWs of CaI and CO(2.29) absorption lines of RGs are formally consistent with the fits of a young (400 Myr) and intermediate age (2 Gyr) stellar population. However, the young population is unlikely because massive stars passing the red giant phase will explode as supernovae, and emission lines of [FeII](m) and H21-0S(1)(m) from the supernova should be seen. The lack of these lines in the observed spectra implies either weak or nonexistent supernova activity and, thus, nonexistent young population. For these reasons, although both are formally consistent with the observations, the intermediate age population is preferred over the young population in Table 5.
This result is in good agreement with the ages of nearby RGs derived from the optical spectra (Raimann et al. 2005), and suggests the widespread existence of a two-component stellar population containing both an old dominating component and an intermediate age component, in both RGs and inactive ellipticals. Note that a similar two-component model was recently suggested by Silva et al. (2008) for three early-type galaxies of Fornax cluster. The sample of Raimann et al. (2005) includes one common object to us, namely NGC 612. For that object, they estimated the stellar population to be Gyr of age that is consistent with our result (Table 5). These ages are, on the other hand, only in reasonable agreement with those based on fitting single-age, single-metallicity stellar populations to optical and NIR colours. For example, using this method, James et al. (2006) derived luminosity-weighted mean ages between 3 and 14 Gyr, with a mean of 8 Gyr, for field and Virgo cluster elliptical galaxies. However, we note that near-infrared is much more sensitive spectral region to trace evolved RGB stars than optical, in the sense that even a relatively small RGB fraction in a stellar population generates strong contribution to the strength of near-infrared absorption features. This causes a systematic effect between the age estimates from optical and near-infrared methods. Although RGs and inactive ellipticals occupy different loci in the index vs. index plots of Fig. 7, reflecting differencies in their stellar content, the best-fit age estimates of both samples are in reasonable agreement. Most likely, this indicates different metallicities in RGs and inactive ellipticals.
RGs appear to be slightly older than late-type starburst galaxies (1 Gyr) observed by Riffel et al. (2008) in NIR. This might indicate that RGs have experienced nuclear activity and enhanced star formation earlier than starburst galaxies, and in those RGs star formation have finished possibly due to AGN feedback phenomenon.
| Target | CaI | CO | (2.29) | Young | Interm. | |
|---|---|---|---|---|---|---|
| Radio Galaxies: | ||||||
| PKS 0023-33 | 350 | 1580 | 280 | 2000 | 315 | 1800 |
| 3C 29 | 340 | 1800 | 680 | 1260 | 510 | 1500 |
| NGC 612 | 320 | 2000 | 630 | 1580 | 480 | 1800 |
| ESO 552-G14 | 320 | 2000 | 320 | 2630 | 320 | 2300 |
| PKS 0521-36 | 280 | 2240 | - | - | 280 | 2200 |
| ESO 528-G36 | 310 | 2000 | 700 | 1300 | 510 | 1650 |
| NGC 6998 | 350 | 1600 | - | - | 350 | 1600 |
| PKS 2158-380 | 330 | 1800 | 700 | 1300 | 500 | 1500 |
| Combined RG | 350 | 2000 | 660 | 1400 | 500 | 1700 |
| Ellipticals: | ||||||
| NGC 2640 | 320 | 2000 | 700 | 1300 | 510 | 1650 |
| NGC 4478 | 360 | 1600 | 270 | - | 320 | 1600 |
| NGC 4472 | 280 | 2140 | 400 | 2000 | 340 | 2100 |
| NGC 4546 | 260 | 2240 | 380 | 2040 | 320 | 2100 |
| NGC 4564 | 280 | 2140 | 400 | 2000 | 340 | 2100 |
| NGC 4621 | 630 | 1100 | 370 | 2400 | 500 | 1750 |
| NGC 4649 | 280 | 2100 | 370 | 2100 | 330 | 2100 |
| NGC 4697 | 340 | 1800 | 360 | 2500 | 350 | 2150 |
| NGC 5576 | 260 | 2300 | 320 | 2800 | 290 | 2550 |
| Combined E | 340 | 1900 | 350 | 2200 | 350 | 2050 |
-
a
Column (1) gives the name of target; (2) and (3) best-fit young and intermediate ages based on the EWs of CaI; (4) and (5) ages based on the EWs of CO(2.29), and (6) and (7) the average age of the young and intermediate age stellar population component.
4 Conclusions
We have observed the first NIR -band spectra of a sizable sample of low redshift RGs to characterize the EWs of their diagnostic NIR absorption line features and, in addition, based on the evolution models of the diagnostic features trace the intermediate age stellar population component. RG sample was compared with nearly similar size inactive elliptical galaxy sample obtained with the same telescope, instrument and wavelength range. For both samples spectral indices of several absorption features were measured in both bands, namely SiI (m), CO(6-3) (m) in the -band, and NaI (m), CaI (m), CO(2-0) (m) in the -band. These lines are sensitive to the stellar temperature and/or luminosity so they can be used as a tool for identifying different spectral and luminosity classes of stellar population. NIR spectroscopy is powerful to study intermediate age stellar populations having advantages over optical spectroscopy to trace TP-AGB stars. Although currently stellar population synthesis models are not fully self-consistent for the interpretation of NIR spectra of galaxies, they still can be used to estimate the age of stellar population by comparing the measured EWs of diagnostic stellar lines to the EWs calculated by theoretical evolution curve.
Plotting EW(NaI+CaI) vs.EW(CO 2.29) RGs are consistent with the relation of giants stars, whereas inactive ellipticals deviates more strongly from the relation toward main sequence dwarf stars, and on average, EW(CO2.29) of RGs is somewhat greater than that of inactive ellipticals. Most likely, EWs are not significantly affected by non-stellar dilution, and thus it indicates that elliptical galaxies containing AGN are in a different stage in their evolution than their inactive elliptical counterparts. Our result supports previous optical spectroscopic studies of RGs which have shown evidence from intermediate age stellar population component, indicating a link between a nuclear activity and star formation in the host galaxy. Furthermore, RGs appear to contain a slightly older stellar population component than those of late-type starburst galaxies suggesting that RGs have experienced enhanced star formation earlier than starburst galaxies. There are no H21-0S(1) and [FeII] emission lines in the RG spectra indicating either only very small or non-existing contribution from very young stellar population.
To have a better understanding of the stellar content of RGs, larger NIR spectroscopic sample is needed with higher spectral and spatial resolution. This gives the possibility to obtain velocity dispersion of the galaxies which, together with luminosity, can be used to calculate the M/L ratio of galaxies that is essential information for tracing the young population. Furthermore, the correlation between velocity dispersion and K-band NaI index can be used as a young population indicator for early-type galaxies as was suggested by Silva et al. (2008). To characterize stellar population gradients from the central region, where AGN and star formation may co-exist, to the outer regions of galaxies higher spectral and spatial resolution are needed. Furthermore, to better interpret the composite NIR spectra of galaxies, more extended stellar population synthesis models should be developed. To assert the unified model of radio-loud AGNs, where RGs are the parent population of BL Lac objects, larger samples of NIR spectra of BL Lac objects are required together with high resolution optical spectroscopy.
Acknowledgements.
This work was supported by the Italian Ministry for University and Research (MIUR) under COFIN 2002/27145, ASI-IR 115 and ASI-IR 35, ASI-IR 73 and by the Academy of Finland (projects 8121122 and 8107775). This research has made use of the NASA/IPAC Extragalactic Database (NED) which is operated by the Jet Propulsion Laboratory, California Institute of Technology, under contract with the National Aeronautics and Space Administration. We thank the referee, Alexandre Vazdekis, for his constructive criticism, which significantly improved the paper, and Valentin Ivanov for allowing us to use the data on inactive elliptical galaxies prior to publication.References
- Ali et al. (1995) Ali, B., Carr, J., DePoy, D., Frogel, J., & Sellgren, K. 1995, AJ, 110, 2415
- Aretxaga et al. (2001) Aretxaga, I., Terlevich, E., Terlevich, R., Cotter, G., & Diaz, A. 2001, MNRAS, 325, 636
- Bellamy et al. (2003) Bellamy, M., Tadhunter, C., Morganti, R., et al. 2003, MNRAS, 344, L80
- Bendo & Joseph (2004) Bendo, G. & Joseph, R. 2004, AJ, 127, 3338
- Boroson et al. (1985) Boroson, T., persson, S., & Oke, J. 1985, ApJ, 293, 120
- Bressan et al. (2006) Bressan, A., Falomo, R., Valdes, J., & Rampazzo, R. 2006, ApJ, 645, L101
- Bruzual & Charlot (2003) Bruzual, G. & Charlot, S. 2003, MNRAS, 344, 1000
- Carretero et al. (2007) Carretero, C., Vazdekis, A., & Beckman, J. E. 2007, MNRAS, 375, 1025
- Cavaliere & Vittorini (2000) Cavaliere, A. & Vittorini, V. 2000, ApJ, 543, 599
- Cesetti et al. (2008) Cesetti, M., Ivanov, V., Morelli, L., et al. 2008, A&A, arXiv:0808.3573v1
- Combes (2005) Combes, F. 2005, astro-ph/0505463
- Falomo & Kotilainen (1999) Falomo, R. & Kotilainen, J. 1999, A&A, 352, 85
- Fasano et al. (1996) Fasano, G., Falomo, R., & Scarpa, R. 1996, A&A, 282, 40
- Fioc & Rocca-Volmerange (1997) Fioc, M. & Rocca-Volmerange, B. 1997, A&A, 326, 950
- Förster Schreiber (2000) Förster Schreiber, N. M. 2000, AJ, 120, 377
- Fremaux et al. (2007) Fremaux, J., Pelat, D., Boisson, C., & Joly, M. 2007, A&A, 473, 377
- Frogel et al. (1978) Frogel, J. A., Persson, S. E., Matthews, K., & Aaronson, M. 1978, ApJ, 220, 75
- Frogel et al. (2001) Frogel, J. A., Stephens, A., Ramírez, S., & DePoy, D. L. 2001, AJ, 122, 1896
- Govoni et al. (2000) Govoni, F., Falomo, R., Fasano, G., & Scarpa, R. 2000, A&A, 353, 507
- Heidt et al. (2004) Heidt, J., Tröller, M., Nilsson, K., et al. 2004, A&A, 418, 813
- Holt et al. (2007) Holt, J., Tadhunter, C. N., González Delgado, R. M., et al. 2007, MNRAS, 381, 611
- Hyvönen et al. (2007a) Hyvönen, T., Kotilainen, J., Falomo, R., Örndahl, E., & Pursimo, T. 2007a, A&A, 476, 723
- Hyvönen et al. (2007b) Hyvönen, T., Kotilainen, J., Örndahl, E., Falomo, R., & Uslengi, M. 2007b, A&A, 462, 525
- Jahnke (2002) Jahnke, K. 2002, PhD thesis, Universität Hamburg
- Jahnke et al. (2004) Jahnke, K., Kuhlbrodt, B., & Wisotzki, L. 2004, MNRAS, 352, 399
- James et al. (2006) James, P., Salaris, M., Davies, J., Phillipps, S., & Cassisi, S. 2006, MNRAS, 367, 339
- Kennicutt (1998) Kennicutt, R. 1998, ARA&A, 36, 189
- Kleinmann & Hall (1986) Kleinmann, S. & Hall, D. 1986, ApJS, 62, 501
- Kojima & Noguchi (1997) Kojima, M. & Noguchi, M. 1997, ApJ, 481, 132
- Kotilainen & Falomo (2004) Kotilainen, J. & Falomo, R. 2004, A&A, 424, 107
- Kotilainen et al. (2005) Kotilainen, J., Hyvönen, T., & Falomo, R. 2005, A&A, 440, 831
- Kuntschner et al. (2002) Kuntschner, H., Smith, R., Colless, M., et al. 2002, MNRAS, 337, 172
- Longhetti et al. (2000) Longhetti, M., Bressan, A., Chiosi, C., & Rampazzo, R. 2000, A&A, 353, 917
- Mannucci et al. (2001) Mannucci, F., Basile, F., Poggianti, B., et al. 2001, MNRAS, 326, 745
- Maraston (2005) Maraston, C. 2005, MNRAS, 362, 799
- Mayya (1997) Mayya, Y. 1997, ApJ, 482, L149
- Merrill & Ridgway (1979) Merrill, K. & Ridgway, S. 1979, ARA&A, 17, 9
- Mobasher & James (2000) Mobasher, B. & James, P. 2000, MNRAS, 316, 507
- Nolan et al. (2001) Nolan, L., Dunlop, J., Kukula, M., Hughes, D., & Boroson, T. 2001, MNRAS, 323, 308
- Oliva et al. (1995) Oliva, E., Origlia, L., Kotilainen, J., & Moorwood, A. 1995, A&A, 301, 55
- Oliva et al. (1999) Oliva, E., Origlia, L., Maiolino, R., & Moorwood, A. 1999, A&A, 350, 9
- Origlia et al. (1997) Origlia, L., Ferraro, F. R., Fusi Pecci, F., & Oliva, E. 1997, A&A, 321, 859
- Origlia et al. (1993) Origlia, L., Moorwood, A., & Oliva, E. 1993, A&A, 280, 536
- Örndahl et al. (2003) Örndahl, E., Rönnback, J., & van Groningen, E. 2003, A&A, 404, 883
- Peletier et al. (1990) Peletier, R., Valentijn, E., & Jameson, R. 1990, A&A, 233, 62
- Raimann et al. (2005) Raimann, D., Storchi-Bergman, T., Quintana, H., Hunstead, R., & Wisotzki, L. 2005, MNRAS, 364, 1239
- Ramirez et al. (1997) Ramirez, S., DePoy, D., Frogel, J., Sellgren, K., & Blum, R. 1997, AJ, 113, 1411
- Riffel et al. (2008) Riffel, R., Pastoriza, M. G., Rodriguez-Ardila, A., & Maraston, C. 2008, MNRAS, ArXiv:0805.1167
- Sanchez et al. (2004) Sanchez, S., Jahnke, K., Wisotzki, L., et al. 2004, ApJ, 614, 586
- Schade et al. (2000) Schade, D., Boyle, B., & Letawsky, M. 2000, MNRAS, 315, 498
- Silva et al. (2008) Silva, D. R., Kuntschner, H., & Lyubenova, M. 2008, ApJ, 674, 194
- Springel et al. (2005) Springel, V., Di Matteo, T., & Hernquist, L. 2005, ApJ, 620, L79
- Strateva et al. (2001) Strateva, I., Ivezić, v. Z., Knapp, G. R., et al. 2001, AJ, 122, 1861
- Tadhunter et al. (2002) Tadhunter, C., Dickon, R., Morganti, R., et al. 2002, MNRAS, 330, 977
- Tadhunter et al. (2003) Tadhunter, C., Marconi, A., Axon, D., et al. 2003, MNRAS, 342, 861
- Tantalo & Chiosi (2004) Tantalo, R. & Chiosi, C. 2004, MNRAS, 353, 405
- Trager et al. (2000) Trager, S., Faber, S., Worthey, G., & Gonzalez, J. 2000, AJ, 120, 165
- Vázquez et al. (2003) Vázquez, G. A., Carigi, L., & González, J. J. 2003, A&A, 400, 31
- Wallace & Hinkle (1996) Wallace, L. & Hinkle, K. 1996, ApJS, 107, 312
- Wallace & Hinkle (1997) Wallace, L. & Hinkle, K. 1997, ApJS, 111, 445
- Wills et al. (2004) Wills, K., Morganti, R., Tadhunter, C., Robinson, T., & Villar-Martin, M. 2004, MNRAS, 347, 771
- Worthey et al. (1994) Worthey, G., Faber, S. M., Gonzalez, J. J., & Burstein, D. 1994, ApJS, 94, 687
- Worthey & Ottaviani (1997) Worthey, G. & Ottaviani, D. 1997, ApJS, 111, 377
- Yamada et al. (2006) Yamada, Y., Arimoto, N., Vazdekis, A., & Peletier, R. F. 2006, ApJ, 637, 200