11email: grossi@arcetri.astro.it 22institutetext: Universitá di Milano-Bicocca, Piazza delle Scienze 3, 20126 Milan, IT 33institutetext: Center for Radiophysics and Space Research, Cornell University, Ithaca, NY 14853 44institutetext: Jansky Fellow of the National Radio Astronomy Observatory, 520 Edgemont Road, Charlottesville, VA 22903. 55institutetext: Universitá di Bologna, via Ranzani 1, 40127, Bologna, IT 66institutetext: INAF-Osservatorio Astronomico di Brera, via Brera 28, 20121, Milan, IT
The Hi content of early-type galaxies from the ALFALFA survey
Abstract
Aims. We present the analysis of the Hi content of a sample of early-type galaxies (ETGs) in low-density environments (LDEs) using the data set provided by the Arecibo Legacy Fast ALFA (ALFALFA) survey. We compare their properties to the sample in the Virgo cluster that we studied in a previous paper (di Serego Alighieri et al. 2007, Paper I). Our aim is both to investigate how the cool interstellar medium (ISM) of these systems depends on the galaxy mass and the environment and to relate the properties of the neutral hydrogen to the warm phases of the ISM.
Methods. We have selected a sample of 62 nearby ETGs (V 3000 km s-1) in an area of the sky where the ALFALFA data are already available (RA, DEC), avoiding the region of the Virgo cluster. Among these, 39 have absolute B magnitudes fainter than M.
Results. Fifteen out of 62 galaxies have been firmly detected with ALFALFA ( 25%). Five additional galaxies show a weaker Hi emission (S/N ) and they will need deeper observations to be confirmed. Eight objects had 21-cm measurements reported in the literature. One by one comparison with the available material confirms, as expected, that ALFALFA data are, with rare exceptions, of equal or better quality than the best spectra previously obtained for these objects. All together, our analysis doubles the number of known gas-rich ETGs in this area. The Hi detection rate is 44% in luminous ETGs (M) and 13% in dwarf ETGs (M). In both cases it is 10 times higher than that of the Virgo cluster. The presence of gas can be related to a recent star formation activity: 60% of all ETGs with Hi have optical emission line ratios typical of star-forming galaxies and blue colours suggesting the presence of young stellar populations, especially in the dwarf subsample.
Conclusions. We show that the Hi detection rate of ETGs depends both on the environment and mass. The fraction of early-type systems with neutral hydrogen is higher in more massive objects when compared to early-type dwarfs. The ETGs in LDEs seem to have more heterogeneous properties than their Virgo cluster counterparts, since they are able to retain a cold interstellar gas component and to support star formation activity even at recent epochs.
Key Words.:
Galaxies: elliptical and lenticular, cD – Galaxies: dwarf – Galaxies: evolution – Galaxies: ISM1 Introduction
| ID | MB | Vopt | VHI | V50 | MHI | log | m-M | H | T | code | |
|---|---|---|---|---|---|---|---|---|---|---|---|
| mag | km s-1 | km s-1 | km s-1 | Jy km s-1 | 107M⊙ | mag | Å | ||||
| UGC4590 | -17.26 | 1901 | – | 208 | 0.65 | 13.3 | -0.97 | 32.17 | 11.3 | -1 | – |
| UGC4599 | -19.07 | 2072 | 2071 1 | 148 | 35.340.09 | 850.5 | 0.11 | 32.53 | -0.01 | -2 | |
| SDSSJ093155.94+073210.3 | -14.30 | 2217 | – | 83 | 0.42 | 11.7 | 0.16 | 32.49 | -1.7 | -2 | – |
| SDSSJ093208.81+082810.8 | -14.41 | 2340 | – | 83 | 0.46 | 14.3 | 0.20 | 32.60 | -3.6 | -5 | – |
| MRK0706 | -17.56 | 2489 | 2501 7 | 61 | 0.640.06 | 22.5 | -0.86 | 32.73 | 123.0 | -1 | |
| SDSSJ093608.59+061525.4 | -15.66 | 2424 | 241311 | 127 | 0.600.06 | 19.7 | -0.16 | 32.66 | 21.1 | -1 | |
| NGC2962 | -20.08 | 1959 | 1958 1 | 414 | 4.220.12 | 112.7 | -1.17 | ⋆32.64 | – | -1 | |
| SDSSJ094218.94+044121.8 | -13.67 | 2036 | – | 83 | 0.50 | 12.1 | 0.42 | 32.31 | 0.5 | -5 | – |
| SDSSJ095036.25+124832.7 | -14.49 | 1335 | – | 83 | 0.41 | 4.8 | -0.31 | 31.54 | 9.3 | -5 | – |
| CGCG064-021 | -18.48 | 2822 | 2676 9 | 36 | 0.300.07 | 13.1 | -1.47 | 32.96 | -1.0 | -5 | |
| CGCG064-055 | -17.92 | 2789 | – | 210 | 0.68 | 30.2 | -0.88 | 32.99 | 20.7 | -5 | – |
| LeoI | -11.00 | 229 | – | 82 | 0.51 | 6.3 | -2.79 | ⋆21.80 | – | -5 | – |
| SDSSJ102326.34+123542.5 | -14.49 | 2739 | – | 84 | 0.44 | 18.9 | 0.29 | 32.96 | -1.9 | -5 | – |
| SDSSJ102339.36+123725.6 | -15.16 | 2723 | – | 83 | 0.42 | 18.0 | -0.001 | 32.95 | 23.4 | -5 | – |
| SDSSJ104140.97+134929.6 | -14.34 | 1271 | – | 83 | 0.45 | 5.4 | -0.20 | 31.57 | 1.0 | -5 | – |
| SDSSJ104435.28+135622.7 | -12.20 | 633 | – | 82 | 0.50 | 0.5 | -0.37 | 28.91 | -1.7 | -5 | – |
| LeG14a | -11.75 | 886 | – | 82 | 0.45 | 1.5 | 0.27 | 30.34 | – | -2 | – |
| LeG17a | -14.07 | 1013 | – | 83 | 0.33 | 1.9 | -0.54 | 30.95 | -1.1 | -2 | – |
| NGC3377a | -19.18 | 684 | – | 207 | 0.63 | 1.9 | -2.59 | ⋆30.25 | – | -5 | – |
| NGC3379a | -20.03 | 897 | – | 207 | 0.59 | 1.7 | -2.98 | ⋆30.21 | -1.2 | -5 | – |
| NGC3384a | -19.57 | 733 | – | 82 | 0.35 | 1.1 | -2.97 | ⋆30.32 | – | -3 | – |
| CGCG066-026a | -13.10 | 541 | – | 82 | 0.43 | 0.3 | -1.01 | 28.54 | -1.4 | -5 | – |
| SDSSJ104926.70+121528.0 | -14.43 | 1321 | 1338 12 | 47 | 0.310.08 | 4.1 | -0.35 | 31.87 | 102.6 | -5 | |
| UGC5944 | -15.15 | 1073 | – | 83 | 0.35 | 1.0 | -1.25 | ⋆30.22 | -1.1 | -5 | – |
| NGC3412a | -18.93 | 853 | – | 207 | 0.56 | 1.7 | -2.54 | ⋆30.27 | – | -2 | – |
| SDSSJ105101.51+132000.5 | -11.97 | 656 | – | 82 | 0.37 | 0.4 | -0.40 | 29.12 | -2.7 | -5 | – |
| SDSSJ105131.35+140653.2 | -11.34 | 832 | 816 9 | 32 | 0.220.05 | 0.5 | 0.01 | 29.87 | -10.6 | -5 | |
| SDSSJ105204.79+150149.7 | -12.47 | 828 | – | 82 | 0.47 | 1.1 | -0.12 | 29.87 | -1.3 | -5 | – |
| SDSSJ105219.51+110235.6 | -13.45 | 824 | – | 82 | 0.43 | 0.9 | -0.60 | 29.75 | -2.4 | -5 | – |
| UGC6062 | -19.31 | 2629 | – | 209 | 0.73 | 30.5 | -1.43 | 32.92 | -1.2 | -1 | – |
| NGC3489a | -19.26 | 692 | 692 2 | 107 | 0.860.06 | 2.6 | -2.48 | ⋆30.41 | – | -1 | |
| IC676 | -19.42 | 1414 | 1421 2 | 176 | 1.330.07 | 21.9 | -1.62 | 32.12 | 33.6 | -1 | |
| SDSSJ111445.02+123851.7a | -10.86 | 582 | 629 3 | 44 | 0.620.04 | 0.4 | 0.03 | 28.36 | 5.5 | -5 | |
| IC2684 | -12.42 | 648 | 590 2 | 25 | 0.570.03 | 0.4 | -0.52 | 28.79 | 2.3 | -5 | |
| SDSSJ111701.18+043944.2 | -13.40 | 1446 | 1441 24 | 96 | 0.300.07 | 4.8 | 0.13 | 31.90 | 5.2 | -5 | |
| SDSSJ112224.02+125846.4 | -11.54 | 626 | – | 82 | 0.40 | 0.3 | -0.38 | 28.49 | -2.7 | -1 | – |
| IC2782 | -14.44 | 860 | – | 82 | 0.44 | 0.8 | -1.08 | 29.69 | -1.5 | -5 | – |
| IC2787 | -13.33 | 708 | – | 82 | 0.37 | 0.3 | -1.00 | 28.96 | -2.2 | -5 | – |
| IC692 | -17.31 | 1157 | 1156 3 | 52 | 3.590.06 | 37.2 | -0.55 | 31.61 | 8.9 | -5 | |
| NGC3773 | -17.31 | 987 | 983 3 | 90 | 3.060.06 | 8.7 | -1.18 | 30.21 | 63.6 | -2 | |
| IC719 | -17.87 | 1849 | 184818 | 231 | 4.080.10 | 53.9 | -0.61 | ⋆31.87 | 1.1 | -2 | |
| UGC6655 | -13.66 | 748 | 750 3 | 55 | 1.260.07 | 1.0 | -0.66 | 28.81 | 121.7 | -1 | |
| 2MASXJ11434609+1342273 | -16.58 | 2920 | 2926 10 | 42 | 0.220.05 | 11.2 | -0.77 | 33.14 | 102.2 | -2 | |
| SDSSJ114516.18+135221.2 | -14.56 | 2957 | – | 84 | 0.37 | 19.1 | 0.27 | 33.16 | -1.5 | -1 | – |
| 2MASXJ11460404+1134529 | -17.89 | 2977 | 292214 | 168 | 0.720.06 | 37.8 | -0.77 | 33.17 | 75.0 | -1 | |
| NGC4880 | -18.36 | 1377 | – | 200 | 0.63 | 2.9 | -2.08 | 30.71 | -1.6 | -1 | – |
| SDSSJ134757.45+041850.6 | -12.01 | 954 | – | 83 | 0.49 | 2.4 | 0.38 | 30.79 | -1.6 | -5 | – |
| SDSSJ135142.91+052647.4 | -15.77 | 1241 | – | 83 | 0.46 | 5.9 | -0.73 | 31.85 | -1.1 | -1 | – |
| MAPS-NGPO_559_1243538 | -13.83 | 977 | – | 83 | 0.43 | 2.3 | -0.36 | 30.91 | 17.6 | -1 | – |
| UGC8799 | -14.42 | 1132 | – | 83 | 0.49 | 2.0 | -0.65 | ⋆30.61 | -1.1 | -5 | – |
| NGC5338 | -17.17 | 804 | 803 3 | 135 | 0.570.06 | 2.2 | -1.72 | ⋆30.54 | 24.9 | -2 | |
| SDSSJ135502.70+050525.2 | -15.13 | 1396 | – | 83 | 0.49 | 7.6 | -0.36 | 32.05 | -1.4 | -5 | – |
| SDSSJ135621.31+051944.2 | -14.54 | 1395 | – | 83 | 0.45 | 7.0 | -0.16 | 32.05 | -1.2 | -5 | – |
| CGCG046-013 | -16.41 | 1516 | – | 83 | 0.50 | 8.6 | -0.82 | 32.17 | -1.5 | -5 | – |
| SDSSJ135723.57+053425.2 | -15.01 | 1055 | – | 83 | 0.45 | 3.7 | -0.62 | 31.36 | 0.6 | -5 | – |
| UGC8986 | -17.78 | 1232 | – | 207 | 0.70 | 8.5 | -1.37 | 31.78 | -1.2 | -2 | – |
| SDSSJ142043.54+040837.0 | -15.03 | 1704 | – | 83 | 0.43 | 8.6 | 0.27 | 32.34 | 3.5 | -2 | – |
| SDSSJ144329.18+043153.4 | -15.81 | 1745 | 1716 2 | 74 | 1.360.06 | 28.6 | -0.06 | 32.38 | 13.5 | -5 | |
| NGC5770 | -18.41 | 1454 | – | 200 | 0.63 | 5.4 | -1.83 | ⋆31.39 | – | -2 | – |
| SDSSJ152655.37+094657.5 | -13.96 | 1858 | – | 83 | 0.41 | 7.7 | 0.11 | 32.26 | 0.2 | -5 | – |
| IC1131 | -18.05 | 2017 | – | 200 | 0.63 | 18.0 | -1.16 | 32.71 | – | -5 | – |
| NGC6014 | -20.04 | 2491 | – | 200 | 0.63 | 25.4 | -1.80 | 33.08 | – | -2 | – |
In the monolithic scenario (Larson 1974; Chiosi & Carraro 2002), early-type galaxies (ETGs) form in a single, short, and highly efficient burst of star formation at high redshift () followed by a more quiescent evolution until today as the residual gas flows into the nuclear region of the galaxy. In this model, the bulk of the stellar population was formed at early epochs and ETGs appear today as gas-poor systems dominated by an old stellar population. On the other hand, hierarchical structure formation scenarios suggest that ETGs seen today in clusters have followed different evolutionary paths compared to the galaxies in LDEs (Governato et al. 1999), which are still undergoing hierarchical assembly and therefore are expected to be on average younger with more heterogenous properties (Schweizer & Seitzer 1992; Barnes 1997). Larson et al. (1980) first pointed out that field ellipticals may have experienced a more extended star formation history with respect to their cluster counterparts. Rose et al. (1994) found an intermediate-age population in E/S0 galaxies in LDEs, suggesting a wider spread in the epochs of major star formation activity. Spectroscopic observations of 26 ETGs located in voids (Wegner & Grogin 2008) indicate that even though there is a range of old ( 9 Gyr) and young ( 5 Gyr) systems, there appears to be a greater proportion of young galaxies in voids than in clusters.
The finding of gaseous structures, such as rings and discs, mostly in ETG field galaxies, can give further indication that merging events with gas-rich objects are taking place today in LDEs (see review by Schweizer et al. 1990). Detailed studies of nearby ETGs have shown that a fraction of them contains neutral hydrogen (Sanders 1980; Knapp et al. 1985; Huchtmeier 1994) and they can host extended Hi structures around them (Oosterloo et al. 2007), accompanied in some cases by traces of ongoing or recent star formation (Sadler et al. 2000; Serra et al. 2007; Hau et al. 2008).
The presence of neutral hydrogen in ETGs may be explained as the consequence of a recent accretion of a gas-rich satellite or of a merging process between similar-size galaxies (Knapp et al. 1985; van Driel & van Woerden 1991; Barnes 2002). Simulations show that spheroidal galaxies with extended gaseous discs can form in spiral mergers (Barnes 2002; Burkert & Naab 2004), as the result of the subsequent infall of the Hi from the tidal tails to the main merging remnant. This process can rebuild the gaseous disc on the timescale of few Gyrs leading to an elliptical or a S0 galaxy with an extended gaseous component (Hibbard & Mihos 1995).
An alternative scenario foresees that the gas is accreted from the intergalactic medium via a ’cold mode’, where the gas cools along filamentary structures without being shock-heated to the virial temperature of the halo (T K; Kereš et al. 2005; Macciò et al. 2006).
When the Hi distribution is mapped at high resolution, gas-rich ETGs show regular Hi structures appearing as low column density ( cm-2 ) discs or rings in rotation (van Driel & van Woerden 1991; Oosterloo et al. 2007). The regular kinematics of these structures suggests that they are relatively old and long-lived (a few Gyrs). Hi tails or clouds offset from the optical counterpart are also found in some systems (Morganti et al. 2006; Oosterloo et al. 2007) which is indicative of recent interactions or of a gas accretion process.
Nonetheless, the rate of detection of neutral hydrogen in nearby ETGs varies broadly depending on the depth of observations and the choice of the sample (Sadler et al. 2002; Morganti et al. 2006; di Serego Alighieri et al. 2007). It is well known that the Hi content of late-type galaxies in dense cluster decreases when compared to systems of the same morphological type in lower density regions (Giovanardi et al. 1983a; Haynes & Giovanelli 1986; Solanes et al. 2001). But how does the Hi content of ETGs vary with the environment? Variations in the detection rate of Hi in ETGs have already been noticed in previous studies (Haynes & Giovanelli 1980; Giovanardi et al. 1983b; Huchtmeier 1994; Oosterloo et al. 2007), confirming that the probability of finding ETGs with gas is higher in lower density environments. The Hi Parkes All-Sky Survey (HIPASS; Meyer et al. 2004) in the southern hemisphere provides a large database at 21-cm which has been recently used to study the Hi content of 2500 nearby ETGs (E and S0) extracted from the RC3 catalog (de Vaucouleurs et al. 1991). HIPASS detected Hi with a rate of 6% for elliptical and 13% for S0 galaxies (Sadler et al. 2002). However this preliminary analysis of the HIPASS data is plagued by confusion, since 30%-50% of the Hi detected ellipticals have more than one neighbor with similar optical velocity within the 15′ Parkes beam, and no distinction between different environments has been analysed or discussed. These results suggest the need for a systematic attempt to determine the Hi properties of ETGs with a better spatial resolution, extending this analysis to a more uniform sample of galaxies in different environments.

In Paper I we have used data from the ALFALFA survey (Giovanelli et al. 2005, 2007), an ongoing blind survey at 21-cm performed with the Arecibo telescope, to start a more uniform and systematic study of the Hi content of ETGs, by analysing it in the Virgo cluster. The advantage of using ALFALFA with respect to a previous blind Hi survey such as HIPASS is twofold: its higher sensitivity and the smaller beam size which reduces the possibility of confusing the Hi detections. We have defined an optical sample of 457 ETG, extracted from the Virgo Cluster Catalog (VCC Binggeli et al. 1985), which are brighter than the VCC completeness limit at BT = 18.0. We have correlated this optical sample with the catalog of detected Hi sources from ALFALFA. Only 9 out of 457 ETGs (roughly 2%) are detected in Hi , with the majority of ETGs with gas having peculiar morphologies and being located in the outer regions of the cluster.
Here we extend our analysis to a low density sample of ETGs, to compare the Hi detection rate in different environments.
The paper is organised as follows: in Section 2 we describe the sample selection, in Section 3 we give an overview of the results, presenting the 21-cm detections, and their optical properties. In Section 4 we discuss the role of the environment on the Hi detection rate of ETGs, and the evidence of recent star forming activity in the sample, and in Section 7 we present our conclusions.
2 Sample selection
The strategy we have followed in this study is the same as in Paper I for the Virgo cluster. We define a–priori an optical sample of ETGs within a definite radial velocity limit, which we then search for Hi , using the ALFALFA survey.
The selection of a LDE optical sample of ETGs as similar as possible to the Virgo one, in terms of luminosity distribution, and possibly complete to a faint limiting magnitude is the crucial point of this work. For this aim we have used the Sloan Digital Sky Survey (SDSS; York et al. 2000; Stoughton et al. 2002) which provides a homogeneous data set of galaxies with both photometric and spectroscopic measurements in different environments: from voids to groups and rich clusters. Spectra are taken only for a subset of objects, the so called main spectroscopic sample, consisting of galaxies with -band magnitudes and -band half-light surface brightnesses mag arcsec-2 (Strauss et al. 2002).
First we selected all the objects in the seventh data release (DR7; Abazajian & Sloan Digital Sky Survey 2008) within the sky region where ALFALFA data are currently available with the same cut in radial velocity as in Paper I, i.e.
-
•
V 3000 km s-1;
-
•
8 RA 16h, avoiding the region of the Virgo cluster between 12h and 13h;
-
•
DEC .
The criterium on the radial velocity was imposed to reach a comparable Hi mass detection limit to the one of Paper I. After this preliminary selection we obtained 307 galaxies of all morphological types.
Bernardi et al. (2005) defined a set of criteria to separate early and late-type galaxies in the SDSS database from the value of two outputs by the SDSS pipeline, the spectroscopic parameter and the photometric parameter 111 is a spectroscopic parameter giving the spectral type from a principal component analysis, while measures the fraction of light profile that is fitted by a de Vaucoulers law: early-type morphologies are defined by choosing and . Applying both these cuts we obtained only 4 galaxies. However we realised that this method was not appropriate for our aims. The use of would prevent to select early-type dwarfs, because their light profiles are generally fitted by an exponential law (Ferguson & Binggeli 1994), while the choice of would have automatically excluded ETGs with emission line spectra, a possibility that cannot be rejected a-priori, especially for our interest in gas-rich ETGs. Moreover, because the aperture of a SDSS spectroscopic fiber (3”) samples only the inner parts of nearby galaxies, we found that, using this criterium on its own, the bulges of some nearby late-type galaxies were mistakenly selected as early-type objects. Therefore we examined by visual inspection the SDSS multi-colour images of the 307 galaxies and classified 50 of them as early-type (E and S0).
The completeness of the main spectroscopic sample depends on the magnitude (Strauss et al. 2002). The main source of incompleteness is due to blending with saturated stars, an effect which is more significant for brighter and larger galaxies. According to Strauss et al. (2002), at bright magnitudes () only 5% of the galaxies in the Zwicky catalog are missed, while from comparison with visual inspections of all objects brigther than over 22 deg2 of sky, the completeness of the sample is above 99%.
To remedy the incompleteness of the SDSS spectroscopic sample at bright magnitudes, we have looked for ETGs with V 3000 km s-1in the RC3 catalog (de Vaucouleurs et al. 1991) and in the Nasa/IPAC Extragalactic Database (NED), and we found that some galaxies had been missed by our selection from the SDSS database. From the RC3 we added 10 bright ETGs, probably excluded by the SDSS spectroscopic target selection algorithm because blended with saturated stars. From NED we found also one faint dwarf (LeG 14) whose -band magnitude is fainter than the limit of the main sample (), and Leo I, which was not included in the SDSS spectroscopic sample because it is resolved.
Thus we have built an apparent magnitude limited and bound in redshift sample of ETGs in LDEs which is complete down to the -band magnitude (Strauss et al. 2002). Our final list of targets is composed of 62 objects, 34 ellipticals and 28 S0s. For the galaxies in common with the RC3 catalog (de Vaucouleurs et al. 1991) we have adopted the RC3 morphological classification. 39 objects have absolute magnitudes M, and they can be considered as dwarf ETGs.
Figure 1 shows the sky distribution of the galaxy sample and the regions we have selected, which also include the Leo group; in Table 1 the main observational parameters of our targets are displayed. The columns are as follows:
Column (1). The name of the galaxy.
Column (2). The absolute B magnitude of the galaxy. B apparent total magnitudes have been derived from the RC3 when available, otherwise they have been calculated from the 222The model magnitude () in the SDSS database is defined as the total magnitude calculated by using the de Vaucouleurs or exponential model that best fits the galaxy profile in the band. , magnitudes derived from the SDSS database and converted to the Johnson system using the following relation B= + 0.17 + 0.47 (Smith et al. 2002). A correction to the magnitudes, exp[-0.11()] , has been applied to compensate for the overestimate of the local sky flux near bright large galaxies performed by the SDSS photometric pipeline (Mandelbaum et al. 2005).
Column (3). The optical heliocentric velocity of the galaxy extracted from NED in km s-1.
Column (4). Heliocentric velocity of the Hi detections, measured as the midpoint of the 50% level of the peak flux density.
Column (5). Velocity width of the Hi line profile, measured at half peak value. More details on the way it has been estimated can be found in Giovanelli et al. (2007).
Column (6). Integrated flux density of the source in Jy km s-1and its estimated uncertainty. For non detections, upper limits on the flux density have been derived by measuring the rms of the integrated spectrum, obtained over a region of 5 5′ around the optical position. The flux value has then been calculated for a S/N = 5 and a velocity width of 200 km s-1if M or 80 km s-1if M.
Cols (7). The Hi mass (and upper limits for non detections) in units of M⊙ , obtained using the standard equation d where dMpc is the assumed distance in Mpc.
Cols (8). Logarithm in base 10 of the Hi mass-to-stellar light ratio in solar units (and upper limits for non detections).
Cols (9). Distance modulus. For 12 objects (labeled with a star) direct distance measurements are available from various indicators such as the tip of the red giant branch, surface brightness fluctuations, supernovae, planetary nebulae, and they have been taken from Tully et al. (2008) and NED333http://nedwww.ipac.caltech.edu/level5/NED1D/. For the other galaxies we have adopted the Hubble flow distance moduli calculated in NED, based on the local velocity field given in Mould et al. (2000), assuming km s-1Mpc The corresponding distances range between 230 kpc (Leo I) and 47 Mpc (2MASX11460404+1134529).
Cols (10). H equivalent width in Angstrom, derived from the SDSS spectra. The H equivalent width of NGC3773 has been taken from Gavazzi et al. (in preparation), because it is not included in the SDSS spectroscopic sample.
Cols (11). Morphological type of the galaxies in the sample. T=-5 refers to ellipticals, and T=-3,-2,-1 correspond to S0 galaxies.
Cols (12). The code of the Hi detections. Given that the signal threshold in the ALFALFA catalog is S/N 6.5 for V 400 km s-1(Saintonge 2007), we define with code firm detections with S/N above the adopted ALFALFA threshold, code denotes reliable detections with a lower signal-to-noise ratio ( S/N ) which have an optical counterpart with a similar redshift, while code refers to possible detections which need to be corroborated with deeper observations.


3 Results
3.1 Hi properties
For each galaxy we have analysed the ALFALFA grids searching for 21-cm emission. We found 15 good quality detections out of 62 galaxies (25%; code and ), while five additional candidate sources have lower S/N () and they will need deeper observations to be confirmed (code ).
15 objects of our sample of 62, have been previously observed at 21-cm. In particular, 6 out of our 15 detections had previous measurements, and the spectra we obtain are in good agreement with those in the literature. Upon inspection of the published spectra we find ours to be of comparable or better quality with the exception of NGC3489 (Bregman et al. 1992), IC719 (Giovanardi et al. 1983b), and NGC5701 (Duprie & Schneider 1996), which are instead of sensitivity higher than ours. Two others have been previously detected but with a marked disagreement with our data; this is the case of UGC4599 (Theureau et al. 2007; Rosenberg & Schneider 2000), and of IC676 (Davoust & Contini 2004). In both cases our data are definitely of superior quality. As for the undetected ones, 4 objects have in the literature Hi limits worse than those here provided (NGC3379, 3412, 4880, 5770), while for NGC3377 the published limits are lower than ours (Knapp et al. 1979). We do not confirm the dubious detection of NGC6014 of comparable sensitivity to ours (Lewis 1983). Finally, Sage & Welch (2006) report a 21-cm detection of NGC3384 (M M⊙ ) at a level well below our sensitivity.
In total we added 7 new 21-cm detections and, possibly, 5 more sources (code ), doubling (at least) the number of ETGs with neutral hydrogen in this region of the sky.
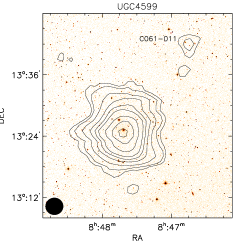
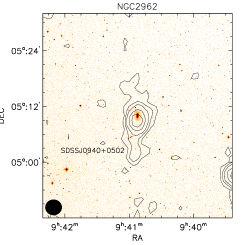
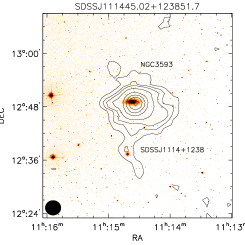
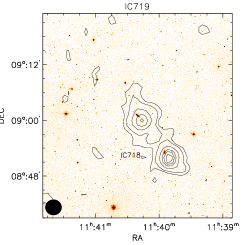
The spectra of all the Hi detections (including the dubious ones) are shown in Fig. 2. The atomic gas is regularly rotating in UGC4599 and NGC2962, as indicated by the double horn profiles. Four galaxies (UGC4599, NGC2962, IC719, and SDSSJ111445.02+123851.7) have gas-rich neighbours to which they appear to be connected by a Hi bridge, and their contour maps are displayed in Figure. 3. The maps of UGC4599, NGC2962 and IC719 show that the gas extends far beyond the optical disc in these objects. Here we discuss the Hi properties of some of the most interesting 21-cm detections.
UGC4599. It is the galaxy with the highest Hi mass of the sample (M M⊙ ). The gaseous distribution is very extended ( 100 kpc) and in rotation as indicated by the double horn 21-cm profile. It belongs to the compact group n. 79 in the Updated Zwicky Catalog (UZC; Focardi & Kelm 2002). From the ALFALFA cube one can see a possible companion also detected at 21-cm (CGCG061-011) with Vhel = 2087 km s-1(Fig. 3). In a few channels there is evidence for Hi emission in the region between the two galaxies which connects to the disc of UGC4599, although this feature is not visible in Fig. 3.
NGC2962. The Hi emission appears to be connected to that of the galaxy SDSSJ094056.3+050240.5, being located at a projected distance of about 8 arcminutes ( kpc; see Fig. 3). In the Lyon Group of Galaxies catalog (Garcia 1993) it belongs to the group n. 178 whose brightest member is NGC2966. From the ALFALFA data, within a box of 1.5 degrees in RA and DEC and a radial velocity range of km s-1, there are 8 systems which are detected at 21-cm. The rotating Hi structure shows the largest velocity width of the sample (V 415 km s-1).
NGC3489. This lenticular galaxy belongs to the Leo Group, but it is in between the two subgroups defined by M66 and M96. It is among the faintest detection with one of the lowest Hi masses (2 M⊙ ). The Hi structure is not resolved by the Arecibo beam thus it is not shown in Fig. 3.
SDSSJ111445.02+123851.7 A dwarf galaxy in the M66 subgroup of Leo. The 21-cm emission (Fig. 3) extends to the north towards the brighter companion NGC3593 (V 628 km s-1; at a projected distance of 10 arcminutes/30 kpc), a S0a galaxy with two counterrotating stellar discs of different scale length and surface brightness (Bertola et al. 1996). The smaller and less massive one corotates with the Hi gaseous disc, contrary to the more massive stellar disc. The accretion of a gas-rich satellite is addressed as a possible mechanism to explain the double structure of NGC3593 (Pizzella et al. 1999).
IC719. It is a S0 galaxy fairly isolated. It shows only one companion (IC718; V 1860 km s-1) to which it seems to be connected by a Hi bridge (see Fig. 3).
3.2 Hi content vs. B band luminosity
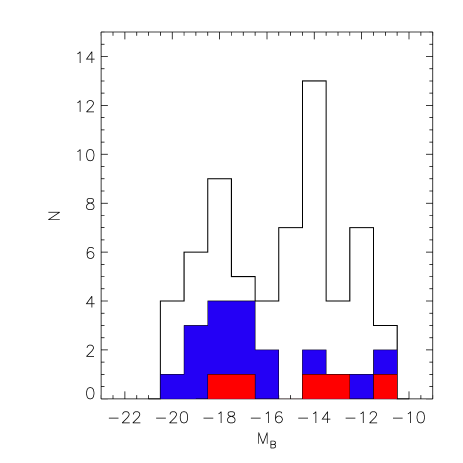
The SDSS database provides photometry for all the galaxies of our sample, including those for which spectroscopic information is not available. As mentioned in Section 2, B apparent magnitudes have been taken from the RC3 for the galaxies included in this catalog, otherwise they have been computed from the dereddened SDSS photometry using the relation from Smith et al. (2002). Figure 4 displays the absolute magnitude distribution of all the galaxies, compared to those detected at 21-cm (filled histogram). The five code detections are also shown. Given that our sample is complete down to we can evaluate what is the completeness magnitude limit in MB. The colour distibution of these galaxies ranges between 0.4 and 1.4 and the maximum distance modulus is ; this implies that the sample we have selected is at least complete down to M.
A large fraction of the observed luminous (M) early-type systems (10 out of 23, 44%) contain neutral hydrogen. At fainter magnitudes (M) we find 5 out 39 gas-rich dwarfs (13%, not taking into account the uncertain detections), although the incompleteness of the sample becomes important for M. The detection rate per magnitude bin peaks at M (60%), and then it drops at magnitudes fainter than M.
Other studies in the field find similar high Hi detection rates in ETGs, however the difference with a dense environment like Virgo is striking. In Paper I we found that only 2 out of 55 galaxies brighter than M have neutral hydrogen (about 4%). The fraction of luminous ETG with Hi in LDEs is 10 times higher than in Virgo. However the three brightest ellipticals of the LDE sample (NGC3377, NGC3379 and NGC3384) do not show Hi emission down to the sensitivity limit of the ALFALFA data set (see Table 1). On the fainter side of the distribution, the Hi detection rate for dwarf ETGs in LDEs is almost ten times higher than in Virgo where we found only 7 gas-rich early-type dwarfs out of 407 (1.7%, see Paper I).
3.3 The MHI/LB distribution of the sample
In Figure 5 we compare the gas-mass-to-light ratios of the LDE and Virgo cluster samples displayed as a function of the absolute B magnitude. The Hi mass-to-light-ratios (MHI/LB ) for the LDE sample range between 3 (NGC3489) and 1.3 in solar units (UGC4599 which shows an unusually high MHI/LB for a S0 galaxy). Non detections are indicated with their upper limits on MHI/LB . As one can notice from Fig. 5 there is a spread in the Hi content of the luminous ETGs (M), and the MHI/LB ratios of the sample do not seem to be correlated with the luminosity, at least at brighter magnitudes, as it is generally found in other morphological types (Verheijen & Sancisi 2001; Gavazzi et al. 2008). This could give an indication that gas-rich luminous objects have recently accreted gas either via merging or from the IGM as it has been suggested in previous works (Knapp et al. 1985). The figure clearly shows the difference with respect to Virgo, where only two objects with M have been detected at 21-cm, and the only Hi detected luminous elliptical (M86) has a very low MHI/LB ratio.

From the MHI/LB distribution of the sample we can check whether we are finding a a ”peculiar” set of galaxies with a higher gas content than what is usually expected for these morphological types. The median MHI/LB for ellipticals and S0s in the Uppsala General Catalog (UGC) is 0.04 (Roberts & Haynes 1994). For the luminous galaxies in our LDE sample we find MHI/LB = 0.07, which is roughly comparable to the UGC. On the other hand, the dwarf ellipticals/spheroidals detected with ALFALFA have a median gas-mass-to-stellar light ratio, MHI/LB = 0.9, which is more similar to those of dwarf irregulars (MHI/LB ). In the Local Group, for example, the dE galaxies NGC205 and NGC185 have both MHI/LB = 0.001 ML⊙ (Mateo 1998), while early-type dwarfs in the Sculptor group with Hi masses around 105 M⊙ , exhibit MHI/LB ratios between 0.08 and 0.2 (Bouchard et al. 2005). The lack of low luminosity galaxies with low relative gas content is probably a selection effect due to the smaller volume that the ALFALFA sensitivity allows for these systems at a given MHI/LB ratio, as shown in Fig. 5.
| ID | H | O[III]5007 | H | N[II]6583 | Ref | ||||
| erg s-1cm-2 | erg s-1cm-2 | erg s-1cm-2 | erg s-1cm-2 | ||||||
| MRK0706 | 1.62 | 2671 37 | 5035 62 | 10850 125 | 1981 30 | 1 | |||
| SDSSJ093608.59+061525.4 | 1.41 | 74 4 | 151 6 | 347 7 | 57 4 | 1 | |||
| NGC2962 | 2.85 | – | – | 20 | 130 | 2 | |||
| SDSSJ104926.70+121528.0 | 1.02 | 260 8 | 892 14 | 857 14 | 40 4 | 1 | |||
| NGC3489 | 3.73 | 1488 | 4367 | 3235 | 4302 | 3 | |||
| IC676 | 2.00 | 589 17 | 175 16 | 4071 57 | 1921 34 | 1 | |||
| SDSSJ111445.02+123851.7 | 1.27 | 1.5 1.3 | 10 3 | 19 2 | 3.0 2 | 1 | |||
| IC692 | 1.23 | 165 21 | 563 23 | 753 9 | 120 11 | 1 | |||
| 2MASXJ11434609+1342273 | 1.89 | 832 14 | 641 11 | 4187 53 | 1286 17 | 1 | |||
| NGC3773 | 1.13 | (271 11) | (355 15) | (879 35) | (157 7) | 4 | |||
| UGC6655 | 1.28 | 1635 31 | 5352 96 | 5563 67 | 515 12 | 1 | |||
| 2MASXJ11460404+1134529 | 1.22 | 1135 20 | 3294 43 | 4294 47 | 424 12 | 1 | |||
| NGC5338 | 1.91 | 407 15 | 531 18 | 2742 19 | 893 21 | 1 | |||
| SDSSJ144329.18+043153.4 | 1.68 | 9 2 | 16 2 | 41 2 | 5 1 | 1 | |||
| UGC4590 | 2.23 | 48 5 | 16 5 | 507 11 | 176 9 | 1 | |||
| SDSSJ095036.25+124832.7 | 1.64 | 9 5 | 25 5 | 92 3 | 17 3 | 1 | |||
| CGCG064-055 | 1.34 | 200 11 | 2714 42 | 1810 17 | 1507 34 | 1 | |||
| SDSSJ102339.36+123725.6 | 1.85 | 17 3 | 33 4 | 94 3 | 18 3 | 1 | |||
| MAPS-NGPO_559_1243538 | 1.82 | 28 4 | 72 5 | 124 3 | 11 3 | 1 |
3.4 Optical emission lines and colours
To check whether we can find traces of a recent star formation activity and/or differences in the stellar population in our sample of ETGs, we have looked for optical emission lines in the SDSS spectroscopic database and we have analysed the optical colours provided by the SDSS photometric database.
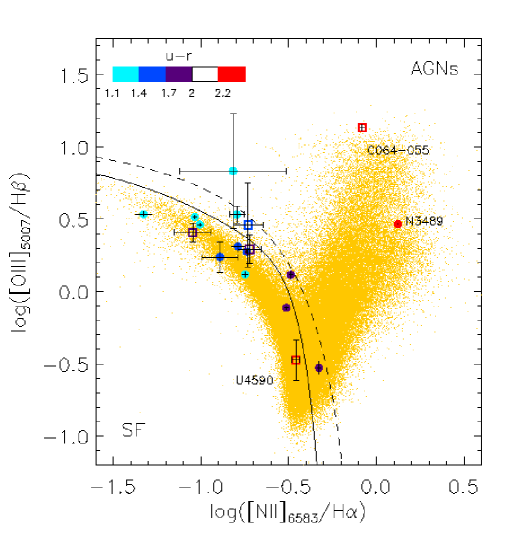
Different ionising mechanisms can produce emission line spectra in galaxies, however the use of diagnostic diagrams (Baldwin et al. 1981; Veilleux & Osterbrock 1987), for given values of the emission line ratios [OIII]5007/H and [NII]6583/H, allows to distinguish the spectra of normal star forming (SF) systems from those with an active galactic nuclei (AGN), such as Seyfert galaxies and low-ionization nuclear emission regions (LINERs) (Kewley et al. 2001; Kauffmann et al. 2003; Stasińska et al. 2006).
We have extracted from the SDSS database the fluxes of the four lines H, [OIII]5007, H and [NII]6583 (Table 2) and their ratios are shown in Figure 6. For the 12 galaxies without SDSS spectra we have used the values reported in the literature when emission lines had been observed, as in NGC2962 (Gallagher et al. 2005), NGC3489 (Ho et al. 1997) and NGC3773 (Moustakas & Kennicutt 2006). The solid and dashed lines in the figure define the region of the diagram below which SF galaxies can be found, according to Stasinska et al. (2006) and Kauffmann et al. (2003) respectively. 10 out of the 15 certain 21-cm detections fall in the SF region of the diagram (67%). As regards the remaining five galaxies, line ratios of NGC3489 indicate that this is a Seyfert galaxy (Ho et al. 1997), while the other four have no clearly detected [OIII] emission lines. Particularly, the spectrum of NGC2962 does not show neither [OIII]5007 nor H emission lines (Gallagher et al. 2005), as well as IC719, thus we do not display these objects in Fig. 6, even though the [NII]6583/H ratio would place them in the AGN region of the diagram. The SDSS spectrum of IC2684 shows low S/N H, and [NII] emission lines, thus it is difficult to draw any conclusions on the position of this galaxy in the diagnostic diagram. Finally, the spectrum of UGC4599, which is the galaxy with the highest Hi mass, have no emission lines, but for the latter galaxy one has to take into account that the SDSS spectrum is sampling only its inner 3′′ region, while the multi-colours image shows a blue ring where SF is probably occurring at about 30′′ from the centre. Two of the five uncertain Hi sources (SDSSJ104926.70+121528.0 and 2MASXJ11434609+1342273) have emission line ratios typical of Hii regions.
It is interesting to note the presence of four ETGs non detected at 21-cm in the SF area of the diagram (UGC4590, SDSSJ102339.36+123725.6, MAPS-NGPO_559_1243538 and SDSSJ095036.25+124832.7). The spectrum of CGCG064-055 instead appears to be typical of a Seyfert galaxy.
versus colour-colour diagrams are used to separate between early and late-type morphology in the SDSS (Strateva et al. 2001, Lamareille et al. 2006) and the boundary between the two classes of galaxies is set at (Strateva et al. 2001). In Fig. 6 we display the colours of the galaxies with emission lines. One can notice that all the systems detected at 21-cm falling in the SF region have blue colours (), more similar to those of later morphological types (Lamareille et al. 2006); the bluer the galaxy the greater the [OIII]Hβ ratio. As regards the ETGs non detected at 21-cm in the SF region, they also have colours bluer than , except for UGC4590, whose spectrum shows weak [OIII] emission lines. The reamaining galaxies outside the SF region both with or without Hi such as NGC3489, CGCG064-055 and NGC2962 (not shown in the plot) have all colours typical of early-type morphologies.
4 Discussion
4.1 The role of the environment
The aim of our study was to assess the extent to which the neutral hydrogen content of ETGs can be affected by the environment. In this paper we have selected a uniform set of galaxies which are members of groups (both small and more populated such as Leo), or evolve in relative isolation, and we have compared it to a rich cluster like Virgo (Paper I).
The reduced Hi content of early-type systems in Virgo is remarkable when compared to the LDE sample. The percentage of galaxies detected at 21-cm is 10 times higher in regions of low intergalactic density both for luminous and dwarf ETGs, confirming that the impact of the environment on the gaseous content of galaxies is fundamental.
Several factors may concur to the higher detection rate of Hi in LDEs. Contrary to clusters, groups have low velocity dispersions and crossing times smaller than the Hubble time, so that interactions and mergers are more likely to occur (Mamon 2007). The lack of an intragroup hot medium and the low relative velocities imply that the role of ram pressure stripping (Gunn & Gott 1972) is reduced in LDEs. On the other hand, luminous ETGs in Virgo are primarily confined to the central regions of the cluster and are strongly concentrated around M87 (Binggeli et al. 1987), where mechanisms such as ram-pressure, or turbulent/viscous stripping (Nulsen 1982) and tidal interactions (Moore et al. 1996) are more efficient at removing the gas from a galaxy.
Another explanation for the paucity of gas-rich luminous ETGs in Virgo compared to the LDE case, may be the relatively short evaporation time for a cold gas cloud embedded in a hot intracluster medium. Following McKee & Cowie (1977) we estimate that the evaporation time due to heat conduction for a cloud of 500 pc radius and cm -3 density, embedded in a hot plasma with properties typical of Virgo (Ghizzardi et al. 2004) is around few times yrs (for conductivity at the Spitzer’s value). Within this scheme the paucity of Hi detections of bright cluster ETGs compared to lower density environments derives from the dearth of Hi rich dwarfs to be cannibalized. Within 6∘ from M87, we estimate from the VCC (Binggeli et al. 1985) an average density of gas-rich dwarfs gal Mpc-3 with a velocity dispersion km s-1. If we fix a cross section diameter of 100 kpc for the capture by a giant member, this implies an impact rate of Gyr-1. That is, in each bright ETG, the time between collisions/capture of a Hi rich dwarf amounts to 19 Gyr. Given, as said before, a survival time of the neutral gas of 6 108 Myr, this gives an expected detection rate around 3%, in agreement with the observed one.
Finally an important role in evaporating Hi clouds could be also played by the possible presence of a hot ISM in luminous ETGs. At this stage, unfortunately, we can derive little information about the relation between the cool and hot ISM for the LDE sample, since the overlap with X-ray datasets is very small. Few objects have been observed, but no evidence of a hot ISM has been reported in any of them to relatively low levels (O’Sullivan et al. 2001; David et al. 2006), with the exception of NGC3379, where a small amount of hot gas is detected in an outflow phase (Trinchieri et al. 2008). A more systematic analysis of the effects of a hot plasma on the Hi content of ETGs in different environments will be presented in a subsequent work (Grossi et al., in prep.).
4.2 Star formation in LDE ETGs
Warm ionised gas is considered a reliable tracer of star formation activity in spiral galaxies, but in E and S0 galaxies other ionising sources such as AGNs or old stars (post asymptotic giant branch stars or low mass core helium-burning stars) can produce emission line spectra (di Serego Alighieri et al. 1990; Trinchieri & di Serego Alighieri 1991; Binette et al. 1994). The presence of ionised gas is quite common in ETGs (Sarzi et al. 2006), particularly Falcón-Barroso et al. (2006) find that emission lines are slightly more frequent in S0s (83%) than in ellipticals (66%). In general, line ratios in ETGs, especially in the more luminous ones, are typical of LINERs (Phillips et al. 1986; Filippenko 2003; Serra et al. 2008).
We find that 40% of the ETGs in our sample have H equivalent widths (EWs) greater than 1 , indicating the presence of ionised gas (see Table 1). This fraction is lower than what is generally found in other samples of ETGs.
Searching for optical emission lines other than H we find that 30% of our ETGs have spectra with H, [OIII] and [NII] in emission. The majority of them lie in the SF side of the diagnostic diagram displayed in Fig. 6, the so-called ’left wing of the seagull’ (Stasińska et al. 2006). The upper side of the left wing corresponds to low metallicity SF galaxies, while more massive and metal-rich galaxies populate the bottom of the SF region. Objects move to the right of the left wing as the metallicity increases. Combining the presence of the optical lines with the colours from the SDSS photometry, 12 out of 20 ETGs with neutral hydrogen (60% if we include code detections) appear to show traces of ongoing SF activity. The colours of the galaxies in the SF region are predominantly blue and particularly they are bluer than , values that are more similar to those of later type morphologies. Thus a significant fraction of the ETGs with gas seems to be forming stars.
If we exclude IC676, all the gas-rich ETGs in the SF region are either low luminosity or dwarf ETGs with M. Evidence of ongoing star formation activity is not unusual in the central regions of low luminosity ETGs (Sadler et al. 2000). Semi-analytic models expect that low luminosity ellipticals and field ellipticals may have experienced more extended star formation histories or could have been formed in later mergers (Khochfar & Burkert 2001).
Even though star formation could be the dominant source of ionisation in the ETGs of our sample with optical emission line spectra, one has to consider that the diagnostic diagram does not allow to unambiguously distinguish whether the gas is ionised by massive young stars or hot old stars (Stasińska et al. 2008; Kniazev et al. 2008), and a further analysis of the UV colours is needed to disentangle this issue.
Finally 35% of the firm Hi detection galaxies (or 40% if one includes the code objects) do not present emission lines in their optical spectra, or do not have line ratios typical of Hii regions. A possible explanation could be that star formation has now faded, but it occurred in a recent past ( Gyr). Indeed some of these gas-rich galaxies have relatively blue colours for their moprhological type (such as IC2684 with ). Alternatively, the lack of SF activity in ETGs with gas could be due to the too low column densities of the observed gaseous structures in their sample (at most a few times cm-2 ), which would not allow to trigger star formation on a large scale. Thus it is possible that, even if ETGs host a gaseous component, only in some of them the conditions for star formation are attained and the gas converted into stars. If this does not occur, the gaseous discs and rings could survive for several Gyr (Morganti et al. 2006; Oosterloo et al. 2007).
5 Conclusions
To better understand the environmental effects on the evolutionary path of ETGs, after having studied the Hi content of a sample in a dense cluster like Virgo (Paper I) here we have used the ALFALFA data set to make a similar analysis on a LDE sample to identify any differences in the ISM and stellar properties of such galaxies. Using the SDSS database we have built an apparent magnitude limited sample of 62 ETGs with radial velocity below 3000 km s-1which is complete down to mag.
Our main results are:
-
•
The Hi detection rate of luminous ETGs in LDEs is 44%, 10 times higher with respect to what we found in the Virgo cluster. The three brightest ellipticals (the Leo group members NGC 3377, NGC 3379 and NGC3384) do not appear to have a gaseous component down to the 5 detection limit of V/200 km s-1) (/11 Mpc) M⊙ . In agreement with previous studies (Giovanardi et al. 1983b) we confirm that the probability of finding S0 galaxies with gas is higher in LDEs compared to a rich cluster like Virgo. The non detection of ellipticals brighter than M at 21-cm prevents to make any comparison of their Hi properties between different environments.
-
•
The Hi detection rate lowers to 13% when one considers only the early-type dwarfs of the sample. The gas content of the dwarfs (MHI/LB ) appears to be greater than typical values usually found in dE/dS0 morphological types. The fraction of gas-rich dwarf ETGs in LDEs is about 10 times higher than the Virgo cluster.
-
•
The presence of Hi in LDE ETGs is possibly the result of recent minor or major merging of gas-rich companions. We find that 25% of the galaxies with Hi emission do also appear to have gas-rich companions. However we cannot exclude that, given the less ’hostile’ environment where such galaxies are evolving in, with gas removal mechanisms being less effective, some of them may have been able to retain their original gas content compared to their cluster counterparts.
-
•
From the analysis of the emission line ratios of these galaxies we find that 60% of the ETGs with gas show traces of ongoing star formation and colours suggesting the presence of young stellar population (). The presence of gas seems to be related to a recent star formation activity in a significant fraction of the gas-rich ETGs. In some ETGs, particularly the massive ones, the gas could be ionised by hot old stars.
-
•
Gas-rich ETGs without traces of recent star formation are also found. They may have not experienced any recent merging/interaction event and they have been passively evolving because the surface densities of their Hi discs are too low for star formation to occur. Alternatively we cannot exclude that they may have got their gas from IGM accretion, a process which not necessarily may trigger star forming activity in the galaxy (Morganti et al. 2006, Oosterloo et al. 2007).
-
•
Few ETGs non detected with ALFALFA show emission line spectra of star forming galaxies, and colours indicative of young stellar populations. Deeper 21-cm observations are needed to set stronger constraint on the Hi content of these galaxies.
Acknowledgements.
We want to thank Maurizio Salaris, Marcel Clemens, Luc Binette and Grazyna Stasińska for useful discussions, and Natalia Vale Asari who kindly supplied the SDSS DR5 catalog used in Figure 6.RG, MPH acknowledge partial support from NSF grants AST 0307661 and AST 0607007, and from the Brinson Foundation. This work is based on observations collected at Arecibo Observatory. The Arecibo Observatory is part of the National Astronomy and Ionosphere Center, which is operated by Cornell University under a cooperative agreement with the National Science Foundation.
This research has made use of the NASA/IPAC Extragalactic Database (NED) which is operated by the Jet Propulsion Laboratory, California Institute of Technology, under contract with the National Aeronautics and Space Administration.
Funding for the SDSS and SDSS-II has been provided by the Alfred P. Sloan Foundation, the Participating Institutions, the National Science Foundation, the U.S. Department of Energy, the National Aeronautics and Space Administration, the Japanese Monbukagakusho, the Max Planck Society, and the Higher Education Funding Council for England. The SDSS Web Site is http://www.sdss.org/.
The SDSS is managed by the Astrophysical Research Consortium for the Participating Institutions. The Participating Institutions are the American Museum of Natural History, Astrophysical Institute Potsdam, University of Basel, University of Cambridge, Case Western Reserve University, University of Chicago, Drexel University, Fermilab, the Institute for Advanced Study, the Japan Participation Group, Johns Hopkins University, the Joint Institute for Nuclear Astrophysics, the Kavli Institute for Particle Astrophysics and Cosmology, the Korean Scientist Group, the Chinese Academy of Sciences (LAMOST), Los Alamos National Laboratory, the Max-Planck-Institute for Astronomy (MPIA), the Max-Planck-Institute for Astrophysics (MPA), New Mexico State University, Ohio State University, University of Pittsburgh, University of Portsmouth, Princeton University, the United States Naval Observatory, and the University of Washington.
References
- Abazajian & Sloan Digital Sky Survey (2008) Abazajian, K. & Sloan Digital Sky Survey, f. t. 2008, ArXiv e-prints
- Baldwin et al. (1981) Baldwin, J. A., Phillips, M. M., & Terlevich, R. 1981, PASP, 93, 5
- Barnes (1997) Barnes, J. E. 1997, in Astronomical Society of the Pacific Conference Series, Vol. 116, The Nature of Elliptical Galaxies; 2nd Stromlo Symposium, ed. M. Arnaboldi, G. S. Da Costa, & P. Saha, 469–+
- Barnes (2002) Barnes, J. E. 2002, MNRAS, 333, 481
- Bernardi et al. (2005) Bernardi, M., Sheth, R. K., Nichol, R. C., Schneider, D. P., & Brinkmann, J. 2005, AJ, 129, 61
- Bertola et al. (1996) Bertola, F., Cinzano, P., Corsini, E. M., et al. 1996, ApJ, 458, L67+
- Binette et al. (1994) Binette, L., Magris, C. G., Stasińska, G., & Bruzual, A. G. 1994, A&A, 292, 13
- Binggeli et al. (1985) Binggeli, B., Sandage, A., & Tammann, G. A. 1985, AJ, 90, 1681
- Binggeli et al. (1987) Binggeli, B., Tammann, G. A., & Sandage, A. 1987, AJ, 94, 251
- Bouchard et al. (2005) Bouchard, A., Jerjen, H., Da Costa, G. S., & Ott, J. 2005, AJ, 130, 2058
- Bregman et al. (1992) Bregman, J. N., Hogg, D. E., & Roberts, M. S. 1992, ApJ, 387, 484
- Burkert & Naab (2004) Burkert, A. & Naab, T. 2004, in Coevolution of Black Holes and Galaxies, ed. L. C. Ho, 421–+
- Chiosi & Carraro (2002) Chiosi, C. & Carraro, G. 2002, MNRAS, 335, 335
- David et al. (2006) David, L. P., Jones, C., Forman, W., Vargas, I. M., & Nulsen, P. 2006, ApJ, 653, 207
- Davoust & Contini (2004) Davoust, E. & Contini, T. 2004, A&A, 416, 515
- de Vaucouleurs et al. (1991) de Vaucouleurs, G., de Vaucouleurs, A., Corwin, Jr., H. G., et al. 1991, Third Reference Catalogue of Bright Galaxies (Volume 1-3, XII, 2069 pp. 7 figs.. Springer-Verlag Berlin Heidelberg New York)
- di Serego Alighieri et al. (2007) di Serego Alighieri, S., Gavazzi, G., Giovanardi, C., et al. 2007, A&A, 474, 851
- di Serego Alighieri et al. (1990) di Serego Alighieri, S., Trinchieri, G., & Brocato, E. 1990, in Astrophysics and Space Science Library, Vol. 160, Windows on Galaxies, ed. G. Fabbiano, J. S. Gallagher, & A. Renzini, 301–+
- Duprie & Schneider (1996) Duprie, K. & Schneider, S. E. 1996, AJ, 112, 937
- Falcón-Barroso et al. (2006) Falcón-Barroso, J., Sarzi, M., Bacon, R., et al. 2006, New Astronomy Review, 49, 515
- Ferguson & Binggeli (1994) Ferguson, H. C. & Binggeli, B. 1994, A&A Rev., 6, 67
- Filippenko (2003) Filippenko, A. V. 2003, in Astronomical Society of the Pacific Conference Series, Vol. 290, Active Galactic Nuclei: From Central Engine to Host Galaxy, ed. S. Collin, F. Combes, & I. Shlosman, 369–+
- Focardi & Kelm (2002) Focardi, P. & Kelm, B. 2002, A&A, 391, 35
- Gallagher et al. (2005) Gallagher, J. S., Garnavich, P. M., Berlind, P., et al. 2005, ApJ, 634, 210
- Garcia (1993) Garcia, A. M. 1993, A&AS, 100, 47
- Gavazzi et al. (2008) Gavazzi, G., Giovanelli, R., Haynes, M. P., et al. 2008, A&A, 482, 43
- Ghizzardi et al. (2004) Ghizzardi, S., Molendi, S., Pizzolato, F., & De Grandi, S. 2004, ApJ, 609, 638
- Giovanardi et al. (1983a) Giovanardi, C., Helou, G., Salpeter, E. E., & Krumm, N. 1983a, ApJ, 267, 35
- Giovanardi et al. (1983b) Giovanardi, C., Krumm, N., & Salpeter, E. E. 1983b, AJ, 88, 1719
- Giovanelli et al. (2005) Giovanelli, R., Haynes, M. P., Kent, B. R., et al. 2005, AJ, 130, 2598
- Giovanelli et al. (2007) Giovanelli, R., Haynes, M. P., Kent, B. R., et al. 2007, AJ, 133, 2569
- Governato et al. (1999) Governato, F., Gardner, J. P., Stadel, J., Quinn, T., & Lake, G. 1999, AJ, 117, 1651
- Gunn & Gott (1972) Gunn, J. E. & Gott, J. R. I. 1972, ApJ, 176, 1
- Hau et al. (2008) Hau, G. K. T., Bower, R. G., Kilborn, V., et al. 2008, MNRAS, 385, 1965
- Haynes & Giovanelli (1980) Haynes, M. P. & Giovanelli, R. 1980, ApJ, 240, L87
- Haynes & Giovanelli (1986) Haynes, M. P. & Giovanelli, R. 1986, ApJ, 306, 466
- Hibbard & Mihos (1995) Hibbard, J. E. & Mihos, J. C. 1995, AJ, 110, 140
- Ho et al. (1997) Ho, L. C., Filippenko, A. V., & Sargent, W. L. W. 1997, ApJS, 112, 315
- Huchtmeier (1994) Huchtmeier, W. K. 1994, A&A, 286, 389
- Kauffmann et al. (2003) Kauffmann, G., Heckman, T. M., Tremonti, C., et al. 2003, MNRAS, 346, 1055
- Kereš et al. (2005) Kereš, D., Katz, N., Weinberg, D. H., & Davé, R. 2005, MNRAS, 363, 2
- Kewley et al. (2001) Kewley, L. J., Dopita, M. A., Sutherland, R. S., Heisler, C. A., & Trevena, J. 2001, ApJ, 556, 121
- Khochfar & Burkert (2001) Khochfar, S. & Burkert, A. 2001, ApJ, 561, 517
- Knapp et al. (1979) Knapp, G. R., Kerr, F. J., & Henderson, A. P. 1979, ApJ, 234, 448
- Knapp et al. (1985) Knapp, G. R., Turner, E. L., & Cunniffe, P. E. 1985, AJ, 90, 454
- Kniazev et al. (2008) Kniazev, A. Y., Pustilnik, S. A., & Zucker, D. B. 2008, MNRAS, 384, 1045
- Larson (1974) Larson, R. B. 1974, MNRAS, 166, 585
- Larson et al. (1980) Larson, R. B., Tinsley, B. M., & Caldwell, C. N. 1980, ApJ, 237, 692
- Lewis (1983) Lewis, B. M. 1983, AJ, 88, 1695
- Macciò et al. (2006) Macciò, A. V., Moore, B., Stadel, J., & Diemand, J. 2006, MNRAS, 366, 1529
- Mamon (2007) Mamon, G. A. 2007, in Groups of Galaxies in the Nearby Universe, ed. I. Saviane, V. D. Ivanov, & J. Borissova, 203–+
- Mandelbaum et al. (2005) Mandelbaum, R., Hirata, C. M., Seljak, U., et al. 2005, MNRAS, 361, 1287
- Mateo (1998) Mateo, M. L. 1998, ARA&A, 36, 435
- McKee & Cowie (1977) McKee, C. F. & Cowie, L. L. 1977, ApJ, 215, 213
- Meyer et al. (2004) Meyer, M. J., Zwaan, M. A., Webster, R. L., et al. 2004, MNRAS, 350, 1195
- Moore et al. (1996) Moore, B., Katz, N., Lake, G., Dressler, A., & Oemler, A. 1996, Nature, 379, 613
- Morganti et al. (2006) Morganti, R., de Zeeuw, P. T., Oosterloo, T. A., et al. 2006, MNRAS, 371, 157
- Mould et al. (2000) Mould, J. R., Hughes, S. M. G., Stetson, P. B., et al. 2000, ApJ, 528, 655
- Moustakas & Kennicutt (2006) Moustakas, J. & Kennicutt, Jr., R. C. 2006, ApJS, 164, 81
- Nulsen (1982) Nulsen, P. E. J. 1982, MNRAS, 198, 1007
- Oosterloo et al. (2007) Oosterloo, T. A., Morganti, R., Sadler, E. M., van der Hulst, T., & Serra, P. 2007, A&A, 465, 787
- O’Sullivan et al. (2001) O’Sullivan, E., Forbes, D. A., & Ponman, T. J. 2001, MNRAS, 328, 461
- Phillips et al. (1986) Phillips, M. M., Jenkins, C. R., Dopita, M. A., Sadler, E. M., & Binette, L. 1986, AJ, 91, 1062
- Pizzella et al. (1999) Pizzella, A., Corsini, E. M., Bertola, F., Funes, J. G., & Beltrán, J. C. V. 1999, in Astronomical Society of the Pacific Conference Series, Vol. 163, Star Formation in Early Type Galaxies, ed. P. Carral & J. Cepa, 292–+
- Roberts & Haynes (1994) Roberts, M. S. & Haynes, M. P. 1994, ARA&A, 32, 115
- Rose et al. (1994) Rose, J. A., Bower, R. G., Caldwell, N., et al. 1994, AJ, 108, 2054
- Rosenberg & Schneider (2000) Rosenberg, J. L. & Schneider, S. E. 2000, ApJS, 130, 177
- Sadler et al. (2002) Sadler, E. M., Oosterloo, T., & Morganti, R. 2002, in Astronomical Society of the Pacific Conference Series, Vol. 273, The Dynamics, Structure and History of Galaxies: A Workshop in Honour of Professor Ken Freeman, ed. G. S. Da Costa & H. Jerjen, 215–+
- Sadler et al. (2000) Sadler, E. M., Oosterloo, T. A., Morganti, R., & Karakas, A. 2000, AJ, 119, 1180
- Sage & Welch (2006) Sage, L. J. & Welch, G. A. 2006, ApJ, 644, 850
- Saintonge (2007) Saintonge, A. 2007, AJ, 133, 2087
- Sanders (1980) Sanders, R. H. 1980, ApJ, 242, 931
- Sarzi et al. (2006) Sarzi, M., Falcón-Barroso, J., Davies, R. L., et al. 2006, MNRAS, 366, 1151
- Schweizer & Seitzer (1992) Schweizer, F. & Seitzer, P. 1992, AJ, 104, 1039
- Schweizer et al. (1990) Schweizer, F., Seitzer, P., Faber, S. M., et al. 1990, ApJ, 364, L33
- Serra et al. (2008) Serra, P., Trager, S. C., Oosterloo, T. A., & Morganti, R. 2008, A&A, 483, 57
- Serra et al. (2007) Serra, P., Trager, S. C., van der Hulst, J. M., et al. 2007, New Astronomy Review, 51, 3
- Smith et al. (2002) Smith, J. A., Tucker, D. L., Kent, S., et al. 2002, AJ, 123, 2121
- Solanes et al. (2001) Solanes, J. M., Manrique, A., García-Gómez, C., et al. 2001, ApJ, 548, 97
- Stasińska et al. (2008) Stasińska, G., Asari, N. V., Fernandes, R. C., et al. 2008, MNRAS, 391, L29
- Stasińska et al. (2006) Stasińska, G., Cid Fernandes, R., Mateus, A., Sodré, L., & Asari, N. V. 2006, MNRAS, 371, 972
- Stoughton et al. (2002) Stoughton, C., Lupton, R. H., Bernardi, M., et al. 2002, AJ, 123, 485
- Strauss et al. (2002) Strauss, M. A., Weinberg, D. H., Lupton, R. H., et al. 2002, AJ, 124, 1810
- Theureau et al. (2007) Theureau, G., Hanski, M. O., Coudreau, N., Hallet, N., & Martin, J.-M. 2007, A&A, 465, 71
- Trinchieri & di Serego Alighieri (1991) Trinchieri, G. & di Serego Alighieri, S. 1991, AJ, 101, 1647
- Trinchieri et al. (2008) Trinchieri, G., Pellegrini, S., Fabbiano, G., et al. 2008, ApJ, 688, 1000
- Tully et al. (2008) Tully, R. B., Shaya, E. J., Karachentsev, I. D., et al. 2008, ApJ, 676, 184
- van Driel & van Woerden (1991) van Driel, W. & van Woerden, H. 1991, A&A, 243, 71
- Veilleux & Osterbrock (1987) Veilleux, S. & Osterbrock, D. E. 1987, ApJS, 63, 295
- Verheijen & Sancisi (2001) Verheijen, M. A. W. & Sancisi, R. 2001, A&A, 370, 765
- Wegner & Grogin (2008) Wegner, G. & Grogin, N. A. 2008, AJ, 136, 1
- York et al. (2000) York, D. G., Adelman, J., Anderson, Jr., J. E., et al. 2000, AJ, 120, 1579