11email: Antonios.Manousakis@unige.ch 22institutetext: Observatoire de Genève, Université de Genève, Chemin des Maillettes 51, CH-1290 Versoix, Switzerland 33institutetext: Department of Astronomy, University of Maryland College Park, MD 20742-2421, USA
Pulsed thermal emission from the accreting pulsar
XMMU J054134.7-682550††thanks:
Based on observations obtained with XMM-Newton, an ESA science mission with instruments and contributions directly funded by
ESA Member States and NASA
Abstract
Aims. Soft X-ray excesses have been detected in several Be/X-ray binaries and interpreted as the signature of hard X-ray reprocessing in the inner accretion disk. The system XMMU J054134.7-682550, located in the LMC, featured a giant Type II outburst in August 2007. The geometry of this system can be understood by studying the response of the soft excess emission to the hard X-ray pulses.
Methods. We have analyzed series of simultaneous observations obtained with XMM-Newton/EPIC-MOS and RXTE/PCA in order to derive spectral and temporal characteristics of the system, before, during and after the giant outburst. Spectral fits were performed and a timing analysis has been carried out. Spectral variability, spin period evolution and energy dependent pulse shapes are analysed.
Results. The outburst spectrum could be modeled successfully using a cutoff powerlaw, a cold disk emission, a hot blackbody, and a cyclotron absorption line. The magnetic field and magnetospheric radius could be constrained. The thickness of the inner accretion disk is broadened to a width of 75 km. The hot blackbody component features sinusoidal modulations indicating that the bulk of the hard X-ray emission is emitted preferentially along the magnetic equator. The spin period of the pulsar decreased very significantly during the outburst. This is consistent with a variety of neutron star equations of state and indicates a very high accretion rate.
Key Words.:
X-Rays: Binaries – Stars: emission line, Be – Accretion, accretion disks – Magelanic Clouds1 Introduction
Be/X-ray binaries consist of a neutron star orbiting a Be star, which is defined as a non-supergiant B-type star whose spectrum shows (or showed, at some time) one or more Balmer lines in emission. Be/X-Ray binaries display X-ray pulsations, a signature of the strong magnetic field (G) of the neutron star orbiting a massive star companion. Most known Be/X-Ray binaries undergo outbursts in which their X-ray luminosity suddenly increases by a factor of with respect to the quiescence level.
They can feature two types of outbursts: Type I (or normal) X-ray outbursts of moderate intensity ( erg s-1) occuring during the periastron passage of the neutron star and Type II (or giant) X-ray outbursts of higher intensity ( erg s-1) lasting for several weeks or even months. Generally, Type II outbursts start shortly after periastron passage, but do not show any other correlation with orbital parameters (Finger & Prince, 1997). A small fraction of Be/X-ray binares are persistent sources (the prototype being X-Per), with a low luminosity erg s-1 at an almost constant emitting level (Reig & Roche, 1999).
During giant outbursts, the spin period of the neutron star has been observed to decrease (neutron star spin-up), indicating that angular momentum is transfered from the accreted material to the neutron star, through an accretion disk (Finger et al., 1999; Wilson et al., 2003).
Corbet (1986) has shown that Be/X-Ray binaries fall into a narrow area in the diagram. This correlation has been interpreted as a result of the rotation of the neutron star at the equilibrium velocity between the spin-up, and the spin-down led by centrifugal effects of the strong magnetic field (Waters & van Kerkwijk, 1989).
The X-ray spectra of Be/X-Ray binaries are very close to those of accreting pulsars, although these depend on the physical conditions close to the neutron star. The spectra can be characterized by cutoff powerlaws. In a few systems with low interstellar absorption, there is evidence for soft excesses at low energies, often modeled as blackbody components (White et al., 1983; Hickox et al., 2004; Paul et al., 2002; Endo et al., 2000). Hickox et al. (2004) showed that the soft excesses observed in luminous X-ray sources (erg s-1) can only be explained by reprocessing of hard X-rays by optically thick material, near the inner edge of the accretion disk. Many, if not all, bright sources with low absorption have shown this feature.
XMMU J054134.7-682550, located in the Large Magellanic Cloud - LMC, has been proposed as a likely HMXB by Shtykovskiy & Gilfanov (2005). Palmer et al. (2007) found XMMU J054134.7-682550 in a flaring state during a routine scan of the Swift-BAT data on August 3, 2007 at a level of mCrab. Subsequent RXTE observations on August 9, 2007 revealed X-ray pulsations (s) and cyclotron features at 10 keV (Markwardt et al., 2007). Assuming that this source is a Be system having a (giant) type II outburst, Markwardt et al. (2007) estimated an orbital period of about 80 days (within a factor of 2) based on the Corbet diagram. The average PCA (Proportional Counter Array on board RXTE) spectrum could be fit with a cut-off power law, with photon index 0.47 and an e-folding cut-off energy of 16 keV (Markwardt et al., 2007).
In this paper we present XMM-Newton and RXTE data revealing a soft pulsed thermal emission. In section 2, we present the observations and data reduction; in section 3, the spectral and timing analysis. In section 4, we discuss the source reprocessing geometry and summarize our results.
| Observation | XMM-Newton | RXTE | ||||
|---|---|---|---|---|---|---|
| Start | Exposure (ks) | Counts | Start | Exposure (ks) | Counts | |
| 1 | 2007-07-06T23:32:48 | 10.4 | 15241 | - | ||
| 2 | 2007-08-21T15:12:12 | 7.5 | 33184 | 2007-08-21T19:07:28 | 3.5 | 192650 |
| 3 | 2007-10-05T23:50:15 | 17.0 | 22576 | 2007-10-05T21:57:52 | 1.6 | 24537 |
| 4 | 2007-11-24T22:06:15 | 19.3 | 4332 | - |
2 Observations and data reduction
2.1 Observations
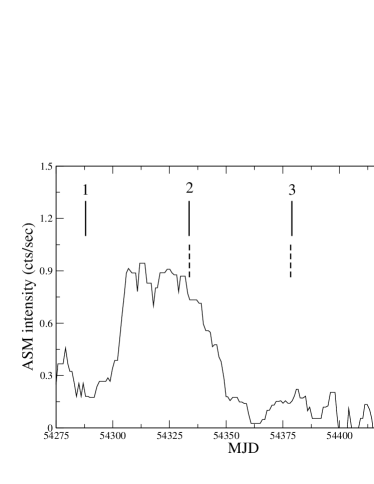
Figure 1 displays the long-term RXTE/ASM light curve of XMMU J054134.7-682550, featuring an outburst with a duration of about 50 days (Markwardt et al., 2007). The four observing runs used in this work were carried out using the PCA on board the Rossi X-ray Timing Experiment (RXTE) and EPIC-MOS on board XMM-Newton (XMM) (Jansen et al., 2001). Table 1 lists the start time, exposure, and number of source counts for each observation. For observation and the XMM and RXTE exposures were performed quasi-simultaneously. RXTE/PCA data were not available for observations and .
2.2 Data reduction
Rossi X-ray Timing Experiment (RXTE)
We used data from RXTE obtained in late August 2007 and
early October 2007 (Table 1).
The PCA (Jahoda et al., 2006) instrument consists of 5 identical multianode Proportional Counter Units (PCU), operating in the keV energy band, with an effective
area of approximately cm2 and a 1 degree FWHM field of view.
PCA spectra and light-curves were extracted using standard FTOOLS (HEASOFT111http://heasarc.gsfc.nasa.gov/lheasoft/ version 6.3.1).
Data were accumulated from Standard-2 mode222http://heasarc.gsfc.nasa.gov/docs/xte/xtegof.html. The Bright Background model
() was used for observation 2 at the peak of the outburst, and the Faint Background model was used for observation 3.
We applied good time intervals (GTI) with an elevation greater than 10 degrees and a pointing offset angle
less than 0.02 degrees. Response matrices were created using the tool pcarsp.
XMM-Newton
Serendipitous observations of XMMU J054134.7-682550 were performed by EPIC-MOS on board XMM-Newton for four epochs between July and November 2007
(obsID: 0500860301 - 0500860601, PI: Lanz)
The Science Analysis Software (SAS) version 7.1.0 was used to produce event lists for the EPIC-MOS[12] (Turner et al., 2001)
instrument running emchain. EPIC MOS was operated in small window mode for the pointed object, i.e. Cal 83. All the rest of the CCDs were operated in full frame
mode providing a time resolution of 2.6 s.
Significant pile-up effects were identified in obsevation 2 and 3 and were reduced by selecting data within an annular ring around the piled-up area, although
out of time events were not identified. The source was outside the field of view of the other XMM-Newton instruments.
3 Data analysis
3.1 Outburst spectrum
The spectral analysis was performed using the XSPEC333http://xspec.gsfc.nasa.gov/ package version 11.3.2 (Arnaud, 1996).
For the outburst spectrum quasi-simultaneous observations were available, i.e., observation 2.
We selected data from EPIC/MOS1+2 and RXTE/PCA covering the energy band keV and keV, respectively.
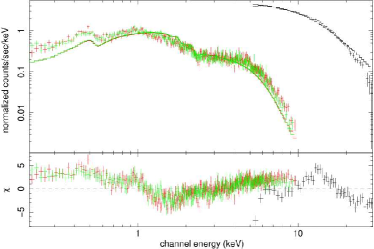
To fit the spectrum, we initially used a very simple model, made of three components: photoelectric absorption, a powerlaw with high energy exponential cutoff,
and a cross-calibration factor, i.e., const*wabs*cutoff.
The model failed to fit the data, providing (Fig 2).
The residuals (Fig. 2, lower panel) indicate a clear soft excess below keV and spectral features in the keV energy range.
We added a fourth spectral component in order to account for the soft excess: either a blackbody (bbody) or a disk black body (diskbb).
This additional spectral component improves the fit very significantly, providing for diskBB and
for bbody, and a cross-calibration factor of in both cases.
The best fit column density cm-2 is, however, less than the galactic value in the source direction (Dickey & Lockman, 1990). Fixing the column density to the galactic value, and using only one thermal model, an additional excess is observed below keV, indicating that one thermal model is not adequate to represent the data. The model can be further improved by adding both disk and blackbody spectral components. To better constrain the parameters, we decided to fix the disk’s inner radius to the radius of the magnetosphere, cm, inferred from the cyclotron line. The disk component turned out to the softer (and cooler) than the single blackbody emitting region.
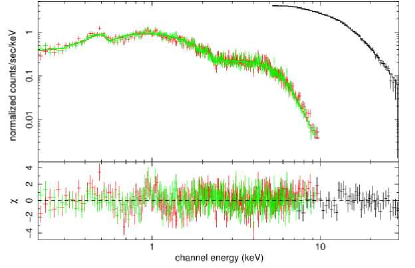
We finally added a sixth model component, a cyclotron line to account for the residuals observed around keV.
This model (const*wabs*(cutoff*cyclabs+diskbb+bb)) fits the data very well (fig. 3) providing , and
a cross-calibration factor . Table 2 lists the best fit parameters. The continuum, characterised by and E keV, is typical for an accreting pulsar.
The energy of the fundamental line ( keV) is
consistent with the value derived from the RXTE data alone (Markwardt et al., 2007).
We do not find evidence for cyclotron harmonic lines.
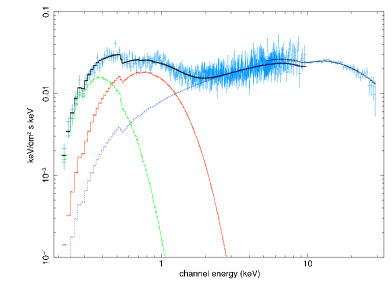
Figure 4 shows the model, unfolded spectrum, and the additive components of the model. The relative contribution of each component is also plotted. Above 5 keV the powerlaw cutoff component (blue dotted line) dominates the spectrum. At low energies, the blackbody (red dotted line) and the disk emission (green dotted line) dominates at 1 keV and below 0.5 keV, respectively.
Based on this model, we estimated the unabsorbed flux for each component in the energy range keV as, , , given the distance to the LMC.
The residuals show some significant broad emission feature at 1 keV. Such features, possibly an Fe L line complex (Oosterbroek et al., 1997; McCray et al., 1982), have been detected in other X-ray binary pulsars (Endo et al., 2000).
| Parameters | Value | Unit |
|---|---|---|
| (fixed) | cm-2 | |
| keV | ||
| R | (fixed) | km2 |
| keV | ||
| km2 | ||
| keV | ||
| Normcutoff | ph keV-1 cm-2 s-1 at 1keV | |
| keV | ||
| keV | ||
| /d.o.f |
| Obs. | Normalization | Normalization | ||
|---|---|---|---|---|
diskbb |
cutoff
|
(d.o.f) | ||
| 1 | 2.510.05 | 1.0 | ||
| 2 | 13.70.1 | 3.23 | ||
| 3 | 2.770.05 | 1.04 | ||
| 4 | 0.230.01 | 0.4 |
3.2 Spectral variability
To search for spectral variability during and outside of the outburst, we used a simple model to fit and compare
the data of high and low signal to noise.
To achieve this we removed the cyclotron line and the single black body component.
The resulting model (const*wabs*(diskbb+cutoff)) was first fit to the outburst data with all parameters free except , fixed to the galactic value.
For the pre- and post-outburst data several parameters were fixed
to those obtained for the outburst spectrum:
kT keV, , and E keV, C, and C.
The remaining free parameters are the normalization
of the disk blackbody, and of the cut-off power law.
Table 3 lists the results of our fits including the corresponging and the relative strength of the soft and hard components in the keV energy band.
The latter peaked to a value of 3.2 for observation 2, during the outburst.
The ratio was about 1.0 in observation 1 and 3 obtained close to the beginning and end of the outburst. Later
on, during observation 4, this relative strength decreased to 0.4. The outburst is characterized by a global
softening of the spectrum, signature of more efficient accretion.
3.3 Timing analysis during the outburst
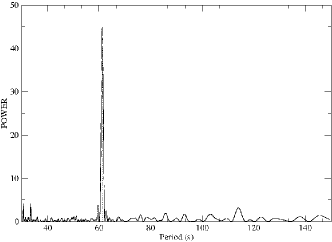
We produced lightcurves in the energy bands keV (from RXTE standard-2 mode, i.e 16 seconds resolution), keV and keV (from EPIC-MOS[1] event lists). Figure 5 shows the Lomb-Scargle periodogram, derived from the keV lightcurve, with the power spectrum density distribution peaking at a period of s, and the corresponding folded lightcurve.
In order to derive the likely pulse shape for the thermal spectral components, we have corrected the soft lightcurve for the contamination of the hard component in the soft band using , where is the ratio of the counts predicted by the best fit model for both the soft and hard components, respectively.
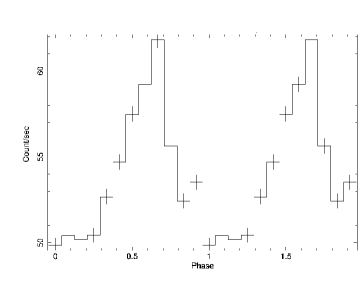
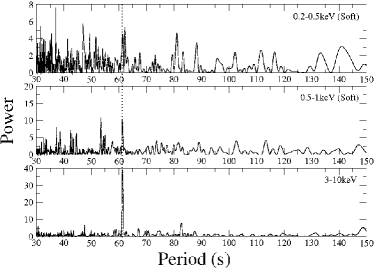
Figure 6 shows the Lomb-Scargle periodograms obtained for the corrected “soft” keV, keV, and for the “hard” keV lightcurves. The corresponding folded lightcurves, using a period of s, are displayed in figure 7.
The power spectrum density distribution at P=s increases with energy (Fig 6). The pulsation is well detected above keV and not significantly detected below keV.
The shape of the peak in the folded keV lightcurve is sharper and narrower than in the “soft” lightcurves (Fig. 7). The pulse starts simultaneously below 1 keV and above 3 keV, however the soft pulse appears to last twice the time.

3.4 Variability of the spin period
Table 4 lists the periods derived for each observation in two energy bands, i.e. keV (obtained from XMM/EPIC-MOS[1]) and keV (obtained from RXTE/PCA). Between observation 1 and 3, the neutron star spinned up by s over a period of days. Assuming a massive OB star and circular orbit with a period of 80 days the Doppler effects can be neglected ().
| Observation | keV | keV |
|---|---|---|
| 1 | - | |
| 2 | ||
| 3 | ||
| 4 | - |
3.5 Likely nearIR candidate
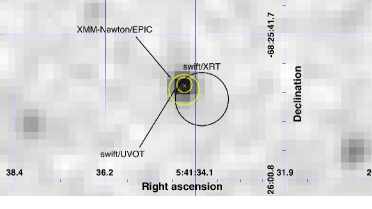
The SWIFT XRT position provided by Palmer et al. (2007) is compatible with the position we derive
from the XMM-Newton MOS image (using SAS edetect task): (systematic uncertainty
of 2 arcsec). The XMM derived position is compatible with the optical counterpart detected by
SWIFT UVOT (Palmer et al., 2007) corresponding to 2MASS for which Cutri et al. (2003) provide J=13.840.03 H=12.740.03, K=13.630.05 and
Monet et al. (2003) provide B2=13.76, and R2=13.84.
The infrared-optical spectral energy distribution of the likely stellar counterpart was fitted with a blackbody of temperature K suggesting a B star. Additional reddening would increase the temperature. An infrared excess detected above the blackbody fit (in the H band) may be an instrumental effect or the signature of a circumstellar disk (Wilson et al., 2005).
4 Discussion
The fundamental cyclotron absorption line, located at keV, indicates a magnetic field of (where is the gravitational redshift). The magnetospheric radius () can be obtained by equating the kinetic energy density of the accreted material to the magnetic energy density (White & Stella, 1988).
The soft X-ray excess was modeled with a cold disk and a hot blackbody. The inner radius of the disk component was fixed to the radius of the magnetosphere. The surface emitting the hot blackbody component can be estimated from the spectral fit as 4.6 km2. Assuming that this corresponds to a broadened inner disk, its thickness can be estimated as 75 km.
If the inner disk is heated by the pulsar’s hard X-ray emission, the covering factor can be estimated as , corresponding to km. The hot blackbody could therefore indeed be produced by reproccessing of hard x-rays on a broadened accretion disk.
Spectral variability was studied by applying a simple model to all the datasets. During the outburst the thermal component is more enhanced than the powerlaw component, suggesting a more effective accretion ( 0.8) and/or a broadened accretion disk.
The cooling time scale of the hot blackbody component ( s) is much shorter than the pulse period. When the neutron star rotates, the maximum of the reprocessed hard X-ray emission will move along the inner edge of the accretion disk. Pulsations of the soft blackbody are therefore expected.
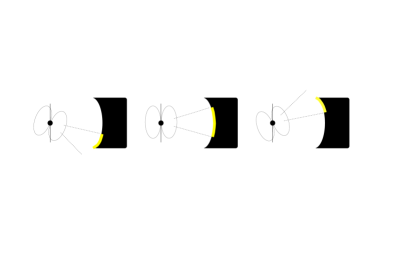
Figure 7 shows the different shapes of the folded lightcurves in the soft and hard energy bands (0.5-1 keV and 3-10 keV). The “hard” pulse () is shorter than the the hot blackbody pulse (). The folded lightcurve of the hot blackbody component can in fact be represented by a sine curve (continuous line in the middle panel of fig. 7) which could be expected in the very simplified source geometrical model represented in figure 9. In this model we assume that the hard X-rays are emitted preferentially towards the magnetic equator (Becker & Wolff, 2007) of the neutron star and that these photons illuminate the inner edge of the accretion disk. The illuminated disk re-radiates at soft X-rays and features a sinusoidal modulation.
We have also observed a significant spin-up of the pulsar ( s) over a period of days, i.e. and s yr-1.
Ghosh & Lamb (1979a, b) described the interaction between the accretion disk and the stellar magnetic field and calculated the effect of the accretion torque on the spin of the neutron star. A relation between the mass M and radius R of the neutron star can be estimated for a given magnetic field, luminosity, spin period, and period derivative observed during the outburst. Our observations indicate a relation M/ R/10 km, which is compatible with a range of neutron star equations of state (Lattimer & Prakash, 2001), and an accretion rate of M.
2MASS is the likely optical counterpart of XMMU J054134.7-682550. The available photometry suggests a temperature of K, confirming a B stellar counterpart.
5 Conclusion
We report on XMM-Newton and RXTE observations of the X-ray binary pulsar XMMU J054134.7-682550, performed in August 2007, during a giant type II outburst lasting for roughly 50 days. The outburst spectrum was fit successfully with a power law modified by an exponentional high energy cutoff, a cyclotron absorption line, and two soft thermal components. We summarize our results as follows:
-
•
The reprocessing region corresponds to the broadened inner edge of the accretion disk broadened to 75 km.
-
•
The soft X-ray pulse shape profile (0.5-1 keV) shows sinusoidal modulation, a signature of illumination of the broadened inner disk.
-
•
The spin up of the pulsar and the enhancement of the disk emission during the outburst indicate a high accretion rate ( 0.8).
-
•
The infrared-optical spectral energy distribution of the counterpart suggests a hot primary star of T13000K, likely a B-type star.
Acknowledgements.
M.A. acknowledges support from a Swiss National Science Foundation Professorship (PP002–110504). T. Lanz was supported by NASA grant NNX07AQ47G This research has made use of NASA’s Astrophysics Data System Bibliographic Service. The ASM lightcurve was obtained from the quick-look results provided by the ASM/RXTE team.References
- Arnaud (1996) Arnaud, K. A. 1996, in Astronomical Society of the Pacific Conference Series, Vol. 101, Astronomical Data Analysis Software and Systems V, ed. G. H. Jacoby & J. Barnes, 17–+
- Becker & Wolff (2007) Becker, P. A. & Wolff, M. T. 2007, ApJ, 654, 435
- Corbet (1986) Corbet, R. H. D. 1986, MNRAS, 220, 1047
- Cutri et al. (2003) Cutri, R. M., Skrutskie, M. F., van Dyk, S., et al. 2003, 2MASS All Sky Catalog of point sources. (The IRSA 2MASS All-Sky Point Source Catalog, NASA/IPAC Infrared Science Archive. http://irsa.ipac.caltech.edu/applications/Gator/)
- Dickey & Lockman (1990) Dickey, J. M. & Lockman, F. J. 1990, ARA&A, 28, 215
- Endo et al. (2000) Endo, T., Nagase, F., & Mihara, T. 2000, PASJ, 52, 223
- Finger et al. (1999) Finger, M. H., Bildsten, L., Chakrabarty, D., et al. 1999, ApJ, 517, 449
- Finger & Prince (1997) Finger, M. H. & Prince, T. A. 1997, in American Institute of Physics Conference Series, Vol. 410, Proceedings of the Fourth Compton Symposium, ed. C. D. Dermer, M. S. Strickman, & J. D. Kurfess, 57–+
- Ghosh & Lamb (1979a) Ghosh, P. & Lamb, F. K. 1979a, ApJ, 232, 259
- Ghosh & Lamb (1979b) Ghosh, P. & Lamb, F. K. 1979b, ApJ, 234, 296
- Hickox et al. (2004) Hickox, R. C., Narayan, R., & Kallman, T. R. 2004, ApJ, 614, 881
- Jahoda et al. (2006) Jahoda, K., Markwardt, C. B., Radeva, Y., et al. 2006, ApJS, 163, 401
- Jansen et al. (2001) Jansen, F., Lumb, D., Altieri, B., et al. 2001, A&A, 365, L1
- Lattimer & Prakash (2001) Lattimer, J. M. & Prakash, M. 2001, ApJ, 550, 426
- Markwardt et al. (2007) Markwardt, C. B., Swank, J. H., & Corbet, R. 2007, The Astronomer’s Telegram, 1176, 1
- McCray et al. (1982) McCray, R. A., Shull, J. M., Boynton, P. E., et al. 1982, ApJ, 262, 301
- Monet et al. (2003) Monet, D. G., Levine, S. E., Canzian, B., et al. 2003, AJ, 125, 984
- Oosterbroek et al. (1997) Oosterbroek, T., Parmar, A. N., Martin, D. D. E., & Lammers, U. 1997, A&A, 327, 215
- Palmer et al. (2007) Palmer, D. M., Grupe, D., & Krimm, H. A. 2007, The Astronomer’s Telegram, 1169, 1
- Paul et al. (2002) Paul, B., Nagase, F., Endo, T., et al. 2002, ApJ, 579, 411
- Reig & Roche (1999) Reig, P. & Roche, P. 1999, MNRAS, 306, 100
- Shtykovskiy & Gilfanov (2005) Shtykovskiy, P. & Gilfanov, M. 2005, A&A, 431, 597
- Turner et al. (2001) Turner, M. J. L., Abbey, A., Arnaud, M., et al. 2001, A&A, 365, L27
- Waters & van Kerkwijk (1989) Waters, L. B. F. M. & van Kerkwijk, M. H. 1989, A&A, 223, 196
- White & Stella (1988) White, N. E. & Stella, L. 1988, MNRAS, 231, 325
- White et al. (1983) White, N. E., Swank, J. H., & Holt, S. S. 1983, ApJ, 270, 711
- Wilson et al. (2003) Wilson, C. A., Finger, M. H., Coe, M. J., & Negueruela, I. 2003, ApJ, 584, 996
- Wilson et al. (2005) Wilson, C. A., Weisskopf, M. C., Finger, M. H., et al. 2005, ApJ, 622, 1024