Effects of the magnetic orderings on the
dynamical conductivity:
optical investigations of EuFe2As2 single crystals
Abstract
The magnetic, transport and optical properties of EuFe2As2 single crystals have been investigated parallel and perpendicular to the -plane. The anisotropy depends only slightly on temperature. In both orientations, the spin-density wave transition at K shows up as a considerable increase in the dc resistivity. Susceptibility measurements evidence the magnetic order of the Eu2+ moments at K with little influence on the electronic transport taking place in the FeAs layers. Polarization-dependent infrared spectroscopy reveals strongly anisotropic optical properties and yields a carrier density of only and a bandmass of . A sizeable Drude contribution is present at all temperatures and narrows upon cooling. Below , the spin-density-wave gap develops in the in-plane optical conductivity; no appreciable change is detected for the perpendicular polarization. Modifications in the phonon features are associated with changes of the electronic properties at . The extended Drude analysis yields a linear behavior of the frequency-dependent scattering rate below , indicating an interaction between the charge carriers and spin fluctuations in the spin-density-wave state.
pacs:
75.30.Fv, 75.20.Hr, 78.20.CiI Introduction
There is a small number of fundamental issues in solid state science that remain of central importance even when a new class of materials emerge. Besides the effect of reduced dimensions and the Mott transition, the interplay of magnetism and superconductivity is certainly among those fascinating topics. It has been intensively explored in heavy-fermion compounds,Ott87 organic conductors Ishiguro98 and cuprates,Ichikawa00 all of them exhibit certain types of magnetic order in the close vicinity to a superconducting phase of unconventional nature.
The observation of K superconductivity in LaFeAsO1-xFx has brought a new round of investigations since iron is supposed to form magnetic order at low temperature. Two classes of ferropnictide superconductors have drawn extensive attention, i.e. doping of FeAsO ( lanthanides) and Fe2As2 ( Sr, Ba, etc.) by holes or electrons. The parent compounds of these two systems are suggested to have a spin-density-wave (SDW) instability associated with the FeAs layers in the temperature range between 130 and 200 K, that will be gradually suppressed upon charge-carrier doping, and finally the material becomes superconducting.Kamihara08 ; Chen08a ; Chen08b ; Rotter08 By now the relation of the antiferromagnetic spin-fluctuations to the mechanism of superconductivity is not clear. Around also a structural transition is observed, where the symmetry changes from tetragonal () to orthorhombic ().Kasinathan09
Like in BaFe2As2 and SrFe2As2, Mößbauer spectroscopy and magnetic susceptibility studies of EuFe2As2 revealedRaffius93 ; Shuai that the magnetic transition due to an antiferromagnetic (AFM) ordering of itinerant carriers in the Fe sublattice that form a SDW; in the title compound the temperature of the phase transition is approximately 190 K. The peak in resistivity supports this assignment; however, the relation to the structural transition around the same temperature is not solved by now. Compared with other compounds of the 122 family, the exceptional case in EuFe2As2 is that in coexistence to the SDW phase a second magnetic ordering takes place in the localized Eu moments at K.Shuai
While in BaFe2As2 Co- or Ni-substitution of Fe causes a suppression of the SDW and the appearance of a superconducting state,Sefat08 ; Li08 no superconductivity is found in the Eu analog EuFe2-xNixAs2;Ren08a nevertheless, there seems to be some interaction between the Eu and Fe/Co/Ni subsystems, because the arrangement of the Eu moments turns to be ferromagnetic for .Ren08a Replacing Eu by K, for instance, supresses the SDW, and also substantially broadens the Eu order and shifts it down below 10 K; in spite of the short-range magnetic order, at K superconductivity is detected in Eu0.5K0.5Fe2As2.Jeevan08b ; Gasparov09
Applying pressure to EuFe2As2 suppresses the SDW phase, too, but only some onset of superconductivity was inferred at K where a drop in resistivity is detected above 2 GPa;Miclea08 the AFM ordering temperature of the Eu2+ moments is nearly unaffected by pressure. Very recently, superconductivity was reported in EuFe2As2 by partially substituting As by isovalent P, inducing chemical pressure without destroying the magnetic transition of the Eu2+ moments.Ren08b This agrees with predictions of magnetic quantum criticality between an antiferromagnetic and paramagnetic metal.Dai08 As a matter of fact, the ferromagnetic interaction between the Eu2+ moments (which is probably due to RKKY interaction) is strengthened as a consequence of P doping in a similar manner as observed in EuFe2-xNixAs2. Here we investigate the influence of these different magnetic ordering phenomena on the charge carrier dynamics in EuFe2As2 in order to elucidate the effect of spin fluctuations on the superconducting ground state in ferropnictides, in general.
II Experimental Detail
Single crystals of EuFe2As2 were grown using FeAs as self-flux dopants.Shuai The platelets with a typical size of have naturally flat surface. The specimens from two different laboratories were characterized by transport and susceptibility measurements; the good agreement obtained in all results confirms the intrinsic nature of the findings reported here. The temperature-dependent dc resistivity was obtained by standard four-probe technique, using silver paint as contacts. For the out-of-plane measurements, the mechanic stability of the contacts during temperature sweeps and inter-layer inclusions of presumably un-reacted precursor material cause severe problems. Therefore particular care has to be taken to obtain quantitatively reproducible results. remark1 The magnetic susceptibility was measured down to 4 K by a Quantum Design SQUID system at different magnetic fields up to 2 Tesla applied parallel and perpendicular to the plane.
The optical reflectivity was investigated by Fourier transform spectroscopy with the electric field polarized in both the -plane and the -direction. The Bruker IFS 113v and IFS 66v/s interferometers utilized in our study cover the frequency range from 30 to 12 000 cm-1. The experiments were performed at various temperatures down to 10 K. As reference, gold was evaporated onto the sample in situ and the measurements repeated at each temperature. The -axis infrared experiments were performed using an infrared microscope Bruker Hyperion. For the high-frequency extrapolation up to the ultraviolet, we used room-temperature ellipsometric data (6000 - 30 000 cm-1) by a Woollam variable angle spectroscopic ellipsometer. The low-frequency extrapolation was done according to the dc conductivity. The complex optical conductivity was calculated from the reflectivity spectra using Kramers-Kronig analysis.DresselGruner02 It is worth to note, that we also applied a simple Hagen-Rubens extrapolation for the low-frequency reflectivity in polarization, and found that the optical conductivity in the measured range does not depend on the extrapolation. In the perpendicular direction, we extrapolated by assuming a constant reflectivity.
In addition, we have performed far-infrared reflection measurements in an optical cryostat Oxford Spectromag 4000 where a magnetic field up to 5 Tesla can be applied perpendicular to the plane. The experiments were performed down to K with particular emphasis on the magnetic ordering at K.
III Results
III.1 Electrical Resistivity
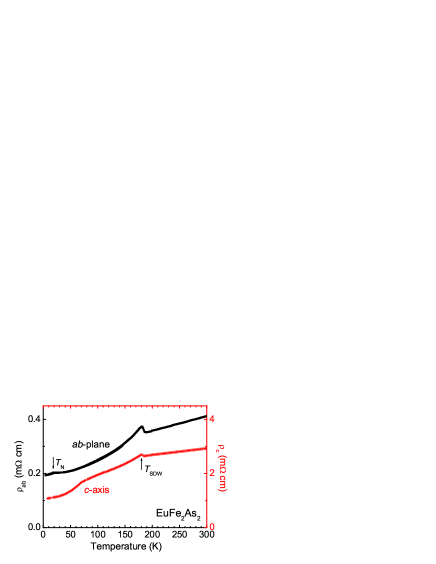
EuFe2As2 is a poor metal with a room temperature conductivity of only which is more than two order of magnitude lower compared to a normal metals, like iron or gold. From the analysis of our optical data discussed below in Sec. IV.1, we conclude that this is mainly due to the reduced charge carrier density. The electrical resistivity of several EuFe2As2 crystals was measured in the -plane and in -direction. The results are plotted in Fig. 1 as a function of temperature. When is reduced below room temperature, the in-plane resistivity slowly decreases as . This is similar to the behavior reported for high- cuprates above . A sharp upturn in is observed at K associated to the SDW transition. With further cooling, the resistivity decreases again, leading a peak in around 189 K. The rise in resistivity evidences the loss in density-of-states at the Fermi energy upon entering the SDW phase. A similar peak is observed in the perpendicular direction, , indicating that the gap opens more or less isotropically over the entire Fermi surface. However, the resistivity soon continues to drop as the temperature is reduced further; this means that not all bands are affected by the SDW transition. Our conclusions are in accord with previous findings.Ren08a ; Jeevan08b ; Xiang08 ; Jeevan08a ; Singh08 ; Yildirim09
Compared to the linear resistivity behavior above , that might be influenced by fluctuations of the Fe spins, the slope of curve gets even steeper for , because the scattering rate of carriers is reduced in the SDW state, where some of the bands become (partially) gapped. Here the in-plane resistivity follows a quadratic temperature dependence all the way down to 30 K where it saturates at a constant value. It seems unlikely that this behavior is due to electron-electron scattering but might express scattering on magnetic excitations where a behavior is predicted for a ferromagnet and for an antiferromagnet,Fournier93 with details strongly depending on the dispersion relation.
At K we observe a kink in because another scattering channel freezes out due to the AFM ordering of the Eu2+ moments. Obviously, the energy scales of the SDW linked to Fe and the AFM order in the Eu sublattice are different by an order of magnitude, as indicated by the ordering temperature. The two phase transitions also influence the electronic scattering very differently: for the scattering is strongly reduced, while the change at is minor.
The resistivity measured along the perpendicular direction exceeds considerably: (300 K)=3 .remark1 Nevertheless, the temperature behavior closely resembles the in-plane properties; the anisotropy ratio is almost temperature independent. Hence, EuFe2As2 exhibits a metallic behavior of in both directions. Although the 2D layered structure is identified for the FeAs-based compounds as in cuprates, this observation is distinct from high- cuprates which commonly exhibit a different temperature dependences of the in-plane and out-of-plane resistivity.Sadovskii Our findings, of only weak anisotropic in dc conductivity support the conclusion of high-magnetic field measurementsAltarawneh08 ; Yuan09 indicating nearly isotropic superconductivity in (Ba,K)Fe2As2.
The SDW of the Fe ions can clearly be seen in , indicating its three dimensional nature. Similar observations have been reported for the sister compound BaFe2As2.XHChenBa The AFM transition at K is not seen in , in contrast to the in-plane resistivity. This is somewhat surprising and infers that the magnetic order of Eu2+ ions is of short range and does not lead to a complete three-dimensional order.
III.2 Magnetic Susceptibility
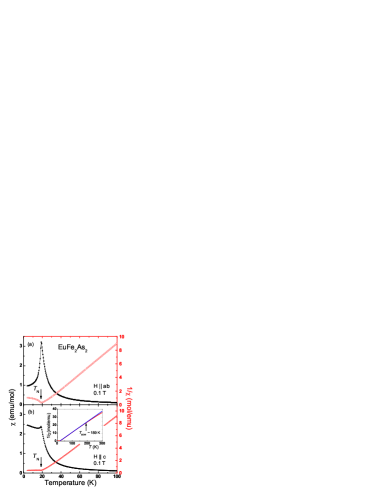
Figure 2 exhibits the temperature dependence of the magnetic susceptibility of EuFe2As2 measured for a magnetic field of 0.1 Tesla oriented both parallel and perpendicular to the plane. Also shown is the inverse susceptibility and which clearly proves that the paramagnetic regime can be nicely described by the Curie-Weiss law. As demonstrated in the inset of Fig. 2, this behavior is well observed over a very wide temperature range from 20 K to 200 K; here the magnetic response is isotropic. Slight deviations from are only observed for higher temperatures, i.e. above the SDW transition which is identified as a tiny kink.
At K, a distinct anomaly shows up in both orientations that is ascribed to the ordering of the Eu2+ moments.Shuai It is concluded that the Eu2+ spins align ferromagnetically within the planes, but antiferromagnetically along the -direction, as sketched in the inset of Fig.3. The upturn of below K indicates a metamagnetic transition of Eu in this direction. The excellent quality of our samples are confirmed by the good agreement of our results with the report by Jiang et al., Shuai where also a more detailed description of can be found. It should be noted that although Fe and Eu both carry magnetic moments, which is a unique behavior in Fe2As2 family, there is almost no coupling between both subsystems; one reason is the large difference of energy scales for local Eu ordering and itinerant Fe antiferromagnetism. Nevertheless, the resistivity behavior and magnetoresistance studied in Ref. Shuai, reflects that the charge carriers are scattered by the Eu moments to some degree. In addition, the absence of superconductivity in EuFe2-xNixAs2 – while it is present Ni doped BaFe2As2 – indicates that the magnetic state of Eu effects superconductivity.Ren08a In the same direction goes the conclusion drawn from the Eu substitution by K, resulting in K for Eu0.5K0.5Fe2As2.Jeevan08b ; Gasparov09
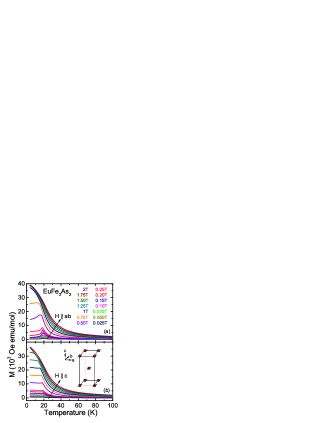
Further investigations of the magnetization and under various magnetic fields are presented in Fig. 3. With increasing field up to 0.75 T, the AFM transition in -plane gradually shifts to lower temperature. For 1 T, the metamagnetic transition is suppressed, and tends to saturate below 10 K, indicating a full ferromagnetic state of the Eu moments. In the case of , a significantly higher external magnetic field (1.5 T) is needed to fully suppress the AFM ordering of Eu [Fig. 3(b)]. This suggests that the Eu moments align close to the -plane but still have a -axis component [cf. the schematic diagram in Fig. 3(b)].
III.3 Optical Properties
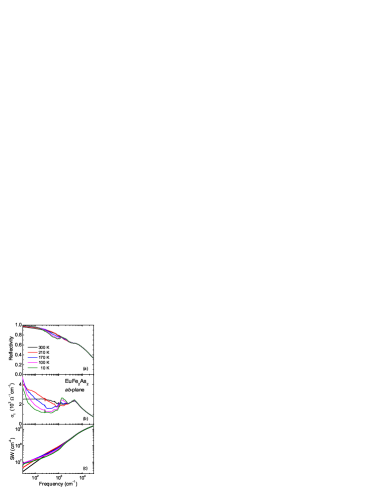
The upper panel of Fig. 4 shows the -plane reflectivity in the whole spectral range for some selected temperatures as indicated. Above K the reflectance resembles a metal, although the plasma edge is not clearly seen; a fact well-known from high-temperature and organic superconductors.Basov05 ; Dressel04 This expresses the poor metallic behavior, already seen in resistivity (Sec. III.1); but also the overlap with interband transitions leads to an overdamped plasma edge. At 1000 cm-1 the reflectance is already as low as 80%. Below the SDW transition, K, a drop in is observed around 1250 cm-1 that is fully developed when reaches 10 K. The reflectivity is strongly suppressed between 200 and 1000 cm-1; but it rapidly increases towards unity for because the compound remains metallic for any temperature.
For all temperatures the in-plane optical conductivity spectra of EuFe2As2 show a broad peak in the mid-infrared (5000 cm-1) due to interband transitions [Fig. 4(b)].Singh08 This maximum gets slightly stronger as the temperature is reduced, basically recovering the spectral weight lost in the low-frequency region (see below). For , the frequency region below 1000 cm-1 is depleted and the spectral weight piles up around 1300 cm-1. Although the Drude contribution is appreciably reduced, it is always present: indicating a partial gap opening of the Fermi surface. The zero-frequency peak narrows upon cooling, because the decreasing scattering rate of the charge carriers. This is in accord with the observation from a falling resistivity (Fig. 1).
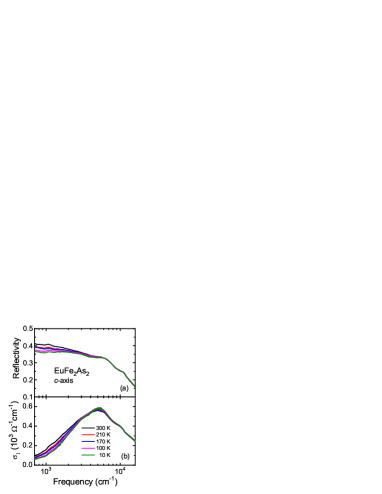
In the -direction (Fig. 5), the shows only 40% reflectance in the mid-infrared and gradually falls at high frequencies. On lowering the temperature, decreases by not more than 10%. The optical conductivity exhibits a broad maximum around 5000 cm-1 which only slightly varies with temperature; it corresponds to the same interband transition detected in the plane. Although is reduced by a factor of 2 in the range of 1000 cm-1, when going from room temperature to 10 K, the indications of a SDW gap are not as clear as for the in-plane conductivity. Considerable changes are already seen for K and the variation extends all the way up to 3000 cm-1, i.e. well above the energy identified as the SDW gap by the in-plane measurements. Thus we conclude that the formation of the SDW state is not observed in the optical properties for in spite of the clear feature present in the dc resistivity . In general, the substantial difference in the optical properties of polarization compared to the in-plane results is in compliance with the dc anisotropy ratio of 10, although we could not see indications of a Drude-like peak in our limited frequency range.
IV Analysis and Discussion
IV.1 Charge Carrier Density
As a first step, we fit the conductivity spectra of EuFe2As2 by the Drude-Lorentz model;DresselGruner02 this allows us to separate different contributions. As an example, in Fig. 6(a) the terms are plotted for the low-temperature data . If the conductivity peak around 5000 cm-1 is modelled by a Lorentz term and ascribed to an interband transition, the quasi-free-carrier parts remaining at lower-frequencies yields a plasma frequency of approximately 14 000 cm-1 at room-temperature. This value for EuFe2As2 is in good agreement with cm-1 obtained in the sister compounds BaFe2As2 and SrFe2As2.Hu08
Alternatively, we can calculate the spectral weightDresselGruner02
| (1) |
as a function of cut-off frequency . As seen in Fig. 4(c), no obvious step or saturation evidences a plasma frequency up to 30 000 cm-1; this is in accord with the gradual decrease of the reflectivity to higher frequencies [Fig. 4(a)]. Although the spectral weight shifts to higher frequencies below the SDW transition, it is basically recovered around 2500 cm-1 as can be seen from the merger of the different curves in Fig. 4(c). Hence, the overall spectral weight remains conserved at any temperature. The same behavior was observed in optical experiments of the Ba and Sr analogues.Hu08 ; Pfuner08 To leave out the interband transition at 5000 cm-1 and consider only the itinerant electrons, we have chosen cm-1 as suitable cut-off frequency and then get 13 800 cm-1 for the quasi-free-carrier plasma frequency.
Using Eq. (1) with the bandmass – as obtained from our extended Drude analysis discussed below in Sec. IV.4 – and cm-1, the carrier density is estimated to be , significantly lower than typical for conventional metals. If we convert to the number of carriers per unit cell by using the low-temperature volume nm3 for reported by M. Tegal et al.,Tegal we obtain electrons per formula unit.
IV.2 Spin-Density-Wave Gap
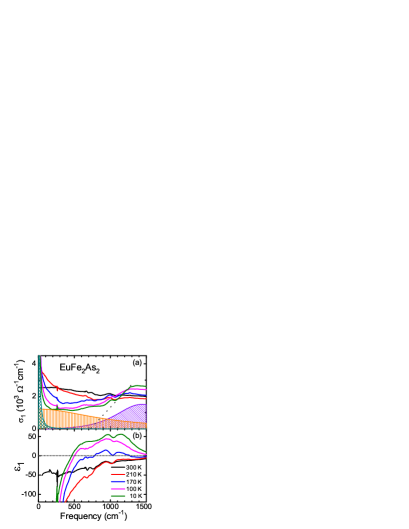
Upon passing through the SDW transition, there is a strong reduction of the optical conductivity below 1200 cm-1 as magnified in the linear-frequency presentation of Fig. 6(a). With decreasing temperature the peak above the SDW gap grows and also the gap becomes slightly larger; as expected from a mean-field transition. From a linear extrapolation of the 10 K conductivity (dotted line), we can estimate a gap value of cm-1, well above the mean-field value of cm-1. In SrFe2As2 ( K) Hu et al.Hu08 identified two gaps with peaks at 500 and 1500 cm-1; accordingly for BaFe2As2 ( K) they find the double peak features at lower energies (360 cm-1 and 890 cm-1). The Eu compound investigated in the present study falls right between with K, and the 1300 cm-1 maximum is likely to correspond to the reported high-frequency peak. However, we cannot find clear indications for a low-energy gap. Around 600 cm-1, a small step might be identified, in particular in the 100 K spectrum, but since it smears out upon lowering the temperature instead of getting more pronounced, we hesitate to associate it with a second gap. Also the dielectric constant shown in Fig. 6(b) gives no evidence for a two-gap structure. Interestingly, for BaFe2As2 Pfuner et al. Pfuner08 report a pseudogap of 500 cm-1, but they do not observe changes at higher energies, in contrast to Hu et al.Hu08 ; remark2 Multiple-gap features are not surprising for a compound with many bands crossing the Fermi energy; similar properties have been reported in MgB2,Kuzmenko02 the model compound of a two-gap superconductor.
To estimate the spectral-weight shift upon opening of the SDW gap, we identify an isobetic point cm-1 in the optical spectra below which decreases as and above which the spectral weight piles up. As can be seen in Figs. 4(b) and 6(a), basically remains unaltered with temperature. The relative shift in spectral weight
| (2) |
is approximately 35%.
Supplementary information can be obtained from the dielectric constant plotted in Fig. 6(b). The zero-crossing of at , 1600 and 1780 cm-1, for , 100 and 10 K, respectively, is an alternative method to identify the SDW gap.
At all temperatures, there remains some zero-frequency contribution that pulls the dielectric constant negative as expected for a metal. For low temperatures, the zero-crossing with positive slope () occurs around cm-1, where denotes the screened plasma frequency of the zero-frequency contribution which shifts only little for K. From Fig. 6(b) we see that the dielectric constant reaches for K, which yields cm-1 for the narrow Drude-like contribution. This value agrees well with the one we get from the Drude-Lorentz fit shown in Fig. 6(a), where the narrow Drude contribution has cm-1 at K.
It is apparent from Fig. 6(a), that there exists a sizeable electronic background in the range between 200 and 700 cm-1 that stays at all temperatures. While at K this contribution is not so clear, it starts to be well pronounced at K and changes only little below 100 K. It should also be noted that the background conductivity is present in all compounds of this ferropnictide family; for instance, it is seen in the superconducting Ba0.55K0.45Fe2As2, too, where the magnetic order is suppressed by doping.Yang08 Hence we do not related this term to the SDW transition. This electronic background could be interpreted as a high-frequency tail of the Drude-like contribution, appearing due to interactions of the charge carriers with other excitations. Another possibility would be to describe this feature by a broad Drude term with a width around 1000 cm-1 [the orange shaded contribution in Fig. 6(a)]. Since the Fermi level is crossed by five Fe bands according to theoretical studies,Jeevan08a ; Xiang08 zero-frequency contributions could stretch well above the far-infrared to account for excitations in different Fe 3 bands.
IV.3 Magnetic Field Dependence
In order to obtain information on the magnetic scattering effects, we have measured the in-plane optical reflectivity in the frequency range cm-1 when a magnetic fields was applied up to 5 Tesla. In the far-infrared (up to 600 cm-1) we find an overall rise of the 10 K reflectivity (not shown). For Tesla it is only 1%, but increases to 5% at 5 Tesla. The reflectivity enhancement with magnetic field diminishes as the temperature increases; above 30 K, no significant change is observed. This infers that the scattering of the remaining conduction electrons described by the broad Drude-term in Fig. 6(a)(orange shaded) is partially suppressed by the magnetic field. This behavior does not change upon passing the magnetic order at K; which implies that the ferrromagnetic order of the Eu moments taking place above 1 Tesla has no appreciable influence on the optical properties in this frequency range.
IV.4 Extended Drude Analysis
A deeper insight into the low-energy excitations and the relevant scattering mechanisms of EuFe2As2 is obtained by performing an extended Drude analysis of the conductivity spectra; here the scattering rate and effective mass are assumed to be frequency dependent.DresselGruner02 This approach is commonly applied to correlated electron systems like heavy fermions, organics and high-temperature superconductors:Dressel04 ; Dordevic06
| (3) |
Here is the real part of a complex frequency dependent scattering rate , with the imaginary part related to the frequency dependent mass enhanced compared to the bandmass . From the complex conductivity we obtain expressions for and in terms of and as follows:
| (4a) | |||||
| (4b) | |||||
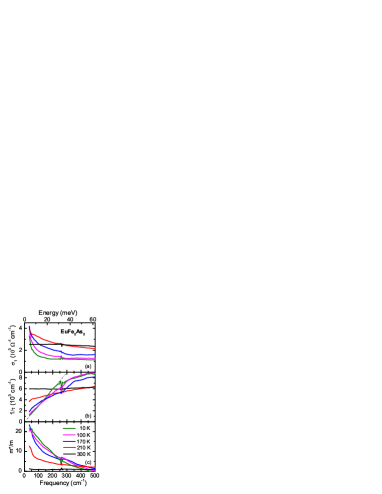
The frequency dependent scattering rate and mass are plotted in Figs. 7(b) and (c) for various temperatures.
It is important to note that the absolute values of and strongly depend on the chosen plasma frequency in Eqs. (4); as mentioned above, this is not that clear cut. Nevertheless, the frequency dependence is not influenced by this renormalization and gives the insight into the physics. From the room temperature spectra, using cm-1, we can calculate an effective mass by Eq. (1) that corresponds to the optical bandmass . This is a reasonable value and independent of frequency as expected for a Drude metal. Accordingly, the scattering rate is constant at about cm-1. At K we already notice a gradual increase of down to low energies [Fig. 7(c)]. The corresponding scattering rate slightly increases with frequency due to the shaping up of the narrow zero-frequency response, as plotted in Fig. 7.
In the SDW state, some of the electronic bands are gapped, implying that only a reduced number of carriers is available for transport, as seen from the jump in at and the opening of an optical gap below. Although the overall spectral weight is eventually conserved, a considerable fraction (as discussed in Sec.IV-B) is shifted to energies above the gap. Accordingly a reduced should be used for the generalized Drude analysis in Eq. (4) for 170, 100, and 10 K: , 11 900 and 11 000 cm-1, respectively. The enhancement of the effective mass extends over a wide energy range and amounts up to for K as displayed in Fig. 7(c).remark3
For , is strongly suppressed at low frequencies due to reduced phase space for scattering of charge carriers upon opening of the SDW gap. This result agrees with dc resistivity (cf. Sec. III.1) where we concluded that the slope of gets steeper due to the same effect. We find a linear increase of up to approximately 200 cm-1, as seen from Fig. 7(b). This evidences scattering on bosonic excitations, for instance excitations of the spin density wave.Millis05 The slope grows as the temperature decreases because the magnetic order is completed further. The AFM ordering of the Eu2+ ions at has little influence on the electronic scattering processes in this energy range and seems to be confined to the in-plane dc transport; which is not surprising since . Below 500 cm-1, the effective mass also starts to increase and reaches more than 20 below , indicating that the carriers are strongly interacting.
Here one should note that in the frequency range of our extended Drude analysis, the conductivity is dominated by the response of mobile carriers. In Fig. 7(c) we can see that at becomes negative at approximately 470 cm-1. This is a clear sign that the data above 470 cm-1 are dominated by density-of-states effects, like energy gaps or interband transitions; an interpretation in terms of scattering rate and effective mass becomes meaningless.Millis05 Hence, to make sure that the SDW gap does not mislead our analysis of the carrier dynamics in terms of and , we also extracted all the high-frequency features, leaving only the zero-frequency contributions for an extended Drude analysis. The results obtained this way remain the same in the low-frequency range as plotted in Fig. 7; this strongly supports, that our analysis procedure and interpretation is valid and robust.
It is instructive to compare our findings with the spectra of chromium, the canonical example of a three-dimensional SDW system.Barker68 ; Basov02 ; Dordevic06 There also a gap opens over some parts of the Fermi surface as a consequence of the SDW ordering. Below the Drude mode narrows and the low-energy spectral weight is suppressed. From the extended Drude analysis a suppression of the scattering rate in the SDW state was obtained below 500 cm-1 and an overshoot for higher frequencies. Basov et al. argue that the area above and below the SDW transition should be conserved.Basov02 Indeed, this is true if we consider in the whole frequency range. However, the most important part of our extended Drude analysis is confined to the narrow Drude-response (not analysed for Cr). Similar to the case of Cr, this contribution becomes sharper for due to the reduced phase space, described by a drop in . The information is obtained from the particular shape of the zero-frequency response and its temperature dependence.
Yang et al. performed an extended Drude analysis of their optical spectra on Ba0.55K0.45Fe2As2 after subtracting the mid-infrared contribution described by a Lorentz oscillator.Yang08 The low-temperature scattering rate increases with frequency for cm-1, which was interpreted as bosonic excitations – most probable magnetic fluctuations – in support of our findings.
IV.5 Vibrational Features
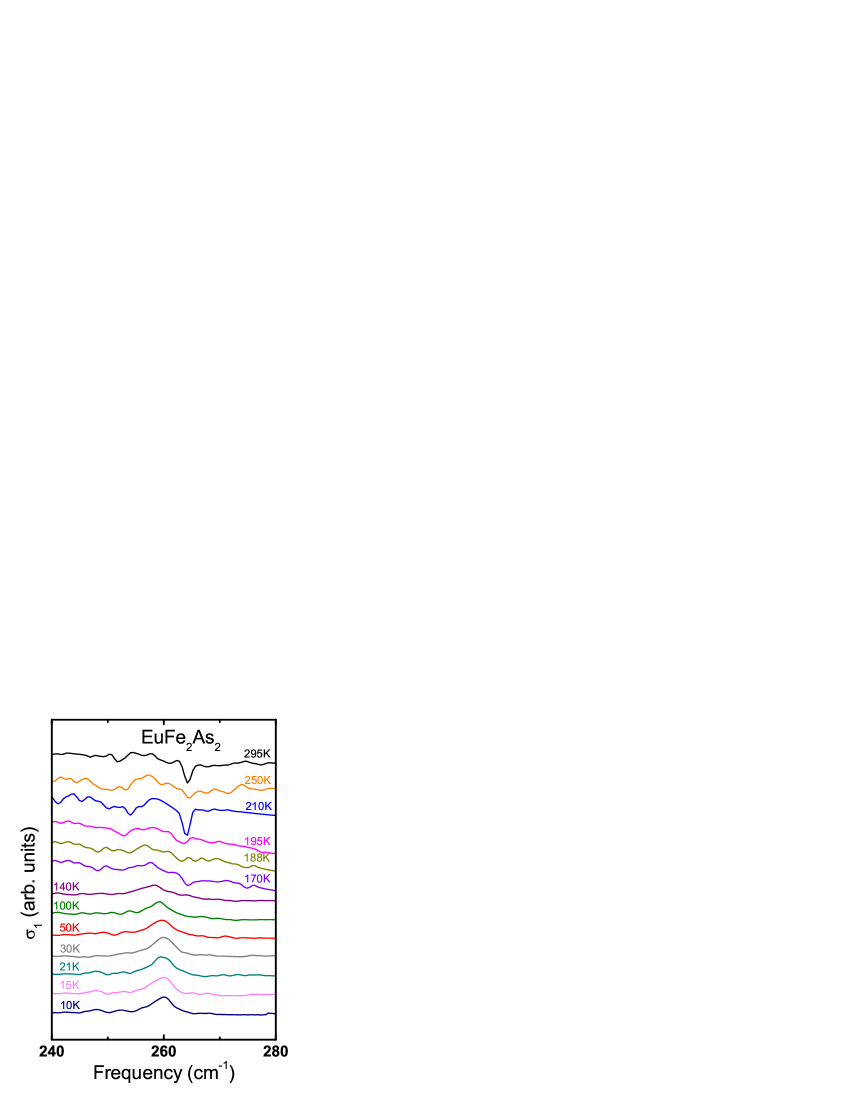
In our optical spectra displayed in Fig. 6(a), a phonon mode at 260 cm-1 is clearly observed for all the temperatures. This Eu mode involves the displacements of the Fe and As ions and is of particular importance because it changes its shape and position upon cooling. In Fig. 8 we magnify this spectral region and plot the conductivity for various temperatures. For K, this phonon appears at 264.2 cm-1 as an anti-resonance. It can be followed down to K and then becomes more and more obscured as decreases; below 170 K the anti-resonance feature is basically absent. Instead a normal phonon mode develops at lower frequency 257 cm-1, which as a matter of fact can be identified all the way up to 190 K. The mode becomes stronger upon cooling down to K and hardens to 260 cm-1.
| (m cm) | (m cm) | (cm-1) | (cm-3) | (s-1) | (nm) | (cm | (K) | (K) | ||
| 0.41 | 3.0 | 13 800 | 2 | 11 | 750 | 189 | 19 | 21 |
The anti-resonance can be successfully fitted applying Fano’s theory:FanoR ; Menovsky
| (5) |
where is the background, ( and are the linewidth and the resonant frequency, respectively) and is the Fano parameter reflecting the degree of asymmetry of the peak. The best description we get is cm-1 and for high temperatures. Such a low and negative value of indicates the single level for vibration is overlapping with the electronic background which is interacted.Menovsky For K, the fit yields and the Lorentz line shape is recovered, indicating a non-interacting case appears upon the SDW gap opening. In conclusion, no new phonon appears due to the structural phase transition, but the significant modification of the vibrational feature around 260 cm-1 upon cooling is caused by the change of the electronic background to which it is coupled. The coexistence of reminiscent features of both limiting cases – the mode and the antimode – in such a wide temperature range implies either strong fluctuation effects, or inhomogeneities or phase separation in the vicinity of the SDW transition.
The shape variation of this phonon mode by crossing the SDW transition implies that the Fe electrons interacting with this phonon are condensed to the gap feature. Our finding corresponds to the conclusions from Raman scattering experiments on CaFe2As2 and SrFe2As2,Choi08 which suggest the variation in the phonon parameters is mainly caused by the change of charge distribution within the FeAs plane and accordingly the strength of the electron-phonon interaction. In the latest report of first-principle calculations for CaFe2As2, it is also suggested that modifying the chemistry of the Fe ion due to the decrease of Fe-moment will decrease the Fe-As interaction.Yildirim
V Conclusions
The magnetic, transport and optical properties of EuFe2As2 single crystals have been investigated parallel and perpendicular the highly-conducting -plane. In Table 1 we summarize the parameters obtained. The anisotropy is basically temperature independent. From our optical data the carrier density was estimated to and the bandmass . The magnetic susceptibility is solely determined by the localized magnetic moments of the Eu2+ ions with only little interaction to the Fe subsystem. The charge carriers dynamics of EuFe2As2, on the other hand, is strongly affected by the spin-density wave transition at K when a gap opens in the optical spectrum around 1000 cm-1. A modification of the Fe-As lattice vibration upon opening of the SDW gap reflects an interaction with the electronic background that gets much less pronounced in the SDW state. The remaining charge carriers are strongly influenced by scattering at spin fluctuations that can be modified by an external magnetic field. The extended Drude analysis gives a linear dependence of the scattering rate with frequencies at low temperatures. The effective mass enhances by a factor of 21 at K. Both parameters evidence the interaction of the low-energy charge carriers with SDW excitations.
Acknowledgements.
We thank J. Braun for ellipsometric measurements in the visible range. We acknowledge help of and discussions with B. Gorshunov and V. I. Torgashev. The work was partially supported by the Deutsche Forschungsgemeinschaft (DFG). N.B. acknowledges support from the Alexander von Humboldt-Foundation. N.D. is grateful for the support by the Magarete-von-Wrangell-Programm of Baden-Württemberg. The work at Zhejiang University was supported by NSF of China.References
- (1) H. R. Ott, Prog. Low Temp. Phys. 11, 215 (1987); N. Grewe and F. Steglich, in: Handbook on the Physics and Chemistry of Rare Earths, Vol. 14, ed. by K. A. Gscheidner Jr. and L. Eyring (Elsevier, Amsterdam, 1991), p. 343
- (2) T. Ishiguro, K. Yamaji, and G. Saito, Organic Superconductors, 2nd edition (Springer-Verlag, Berlin, 1998)
- (3) N. Ichikawa, S. Uchida, J. M. Tranquada, T. Niemöller, P. M. Gehring, S.-H. Lee, and J. R. Schneider, Phys. Rev. Lett. 85, 1738 (2000)
- (4) Y. Kamihara, T. Watanabe, M. Hirano, and H. Hosono, J. Am. Chem. Soc. 130, 3296 (2008)
- (5) X. H. Chen, T. Wu, G. Wu, R. H. Liu, H. Chen, and D. F. Fang, Nature 453, 761 (2008)
- (6) G. F. Chen, Z. Liu, W. Z. Hu, J. Dong, X. D. Zhang, P. Zheng, N. L. Wang, and J. L. Luo, Chin. Phys. Lett. 25, 3403 (2008)
- (7) M. Rotter, M. Tegel, and D. Johrendt, Phys. Rev. B 78, 020503 (2008); Phys. Rev. Lett. 101, 107006 (2008); M. Rotter, M. Tegel, I. Schellenberg, F. M. Schappacher, R. Pöttgen, J. Deisenhofer, A. G nther, F. Schrettle, A. Loidl, and D. Johrendt, New J. Phys. 11, 025014 (2009)
- (8) D. Kasinathan, A. Ormeci, K. Koch, U. Burkhardt, W. Schnelle, A. Leithe-Jasper, and H. Rosner, New J Phys. 11, 025023 (2009)
- (9) H. Raffius, M. Mörsen, B. D. Mosel, W. Müller-Warmuth, W. Jeitschko, L. Terbüchte, and T. Vomhof, J. Phys. Chem. Solids 54, 135 (1993)
- (10) S. Jiang, Y. K. Luo, Z. Ren, Z. W. Zhu, C. Wang, X. F. Xu, Q. Tao, G. H. Cao, Z-A. Xu, New J. Phys. 11, 025007 (2009)
- (11) A. S. Sefat, R. Y. Jin, M. A. McGuire, B. C. Sales, D. J. Singh, and D. Mandrus, Phys. Rev. Lett. 101 117004 (2008)
- (12) L. J. Li, Y. K. Luo, Q. B. Wang, H. Chen, Z. Ren, Q. Tao, Y. K. Li, X. Lin, M. He, Z. W. Zhu, G. H. Cao, and Z-A. Xu, New J. Phys. 11, 025008 (2009)
- (13) Z. Ren, X. Lin, Q. Tao, S. Jiang, Z. Zhu, C. Wang, G. Cao, and Z-A. Xu, arXiv:0810.2595 (2008)
- (14) H. S. Jeevan, Z. Hossain, D. Kasinathan, H. Rosner, C. Geibel, and P. Gegenwart, Phys. Rev. B 78, 092406 (2008)
- (15) V. A. Gasparov, H. S. Jeevan, and P. Gegenwart, arXiv:0902.2190 (2009)
- (16) C. F. Miclea, M. Nicklas, H. S. Jeevan, D. Kasinathan, Z. Hossain, H. Rosner, P. Gegenwart, C. Geibel, and F. Steglich, arXiv:0808.2026 (2008)
- (17) Z. Ren, Q. Tao, S. Jiang, C. Feng, C. Wang, J. Dai, G. Cao, and Z-A. Xu, arXiv:0811.2390 (2008)
- (18) J. Dai, Q. Si, J. X. Zhu, and E. Abrahams, accepted for PNAS, arXiv:0808.0305 (2008)
- (19) From our measurements of a number of crystals from different sources, the exact shape of is sample dependent at low temperature. For instance, the hump around 70 K shows up in different strength, depending on the crystal, and might be related to FeAs. We also found that samples like to cleave in flakes which might infer a larger out-of-plane resisitivity than intrinsically present.
- (20) M. Dressel and G. Grüner, Electrodynamics of Solids (Cambridge University Press, Cambridge, 2002)
- (21) H. S. Jeevan, Z. Hossain, D. Kasinathan, H. Rosner, C. Geibel, and P. Gegenwart, Phys. Rev. B 78, 052502 (2008)
- (22) D. J. Singh, Phys. Rev. B 78, 094511 (2008)
- (23) F. J. Ma, Z. Y. Lu, T. Xiang, arXiv: 0806.3526 (2008)
- (24) T. Yildirim, Phys. Rev. Lett. 102, 037003 (2009)
- (25) N. F. Mott, Proc. Roy. Soc. (London), 156, 368 (1936); N. F. Mott, Adv. in Physics, 13, 325 (1964); I. A. Campbell and A. Fert, in: Ferromagnetic Materials 3, ed. by E. P. Wohlfarth (North-Holland, Amsterdam 1982), p. 747; J. M. Fournier and E. Gratz, in: Handbook on the Physics and Chemistry of Rare Earths 17, ed. by K. A. Gschneidner, L. Eyring, H. G. Lander and G. R. Choppin (North-Holland, Amsterdam 1993), p. 409.
- (26) M. V. Sadovskii, arXiv:0812.0302, review talk on 90th anniversary of Physics Uspekhi
- (27) M. M. Altarawneh, K. Collar, C. H. Mielke, N. Ni, S. L. Bud’ko, and P. C. Canfield, Phys. Rev. B 78, 220505 (2008)
- (28) H. Q. Yuan, J. Singleton, F. F. Balakirev, S. A. Baily, G. F. Chen, J. L. Luo, and N. L. Wang, Nature 457, 565 (2009)
- (29) X. F. Wang, T. Wu, G. Wu, H. Chen, Y. L. Xie, J. J. Ying, Y. J. Yan, R. H. Liu and X. H. Chen, Phys. Rev. Lett. in press, arXiv: 0806.2452 (2008)
- (30) D. N. Basov and T. Timusk, Rev. Mod. Phys. 77, 721 (2005)
- (31) M. Dressel and N. Drichko, Chem. Rev. 104, 5689 (2004)
- (32) W. Z. Hu, J. Dong, G. Li, Z. Li, P. Zheng, G. F. Chen, J. L. Luo, and N. L. Wang, Phys. Rev. Lett. 101, 257005 (2008)
- (33) F. Pfuner, J. G. Analytis, J.-H. Chu, I. R. Fisher, and L. Degiorgi, Eur. Phys. J B 67, 513 (2009)
- (34) M. Tegel, M. Rotter, V. Weiss, F. M. Schappacher, R. Poettgen and D. Johrendt, J. Phys.: Condens. Matter 20, 452201 (2008)
- (35) This obvious discrepancy can only be explained by differences in sample quality. In our case of EuFe2As2 the optical results on several crystals of different origin consistently show only one clear-cut gap around 1000 cm-1.
- (36) A. B. Kuz’menko, F. P. Mena, H. J. A. Molegraaf, D. van der Marel, B. Gorshunov, M. Dressel, I. I. Mazin, J. Kortus, O. V. Dolgov, T. Muranaka, and J. Akimitsu, Solid State Commun. 121, 479 (2002)
- (37) J. Yang, D. Hüvonen, U. Nagel, T. Rõõm, N. Ni, P. C. Canfield, S. L. Bud ko, J. P. Carbotte, and T. Timusk, arXiv:0807.1040 (2008)
- (38) S. V. Dordevic and D. N. Basov, Ann. Physik 15, 545 (2006)
- (39) Alternatively, we could consider only the zero-frequency contribution, which has been modelled by the Drude term in Fig. 6 and led to the zero-crossing of around 500 cm-1. In that case the low plasma frequency cm-1 yields a zero-frequency effective mass of only . The latter approach, however, seems to be inappropriate because it accounts only for the excitations below 100 cm-1 but does not describe the far-infrared behavior in its full extent.
- (40) A. J. Millis, A. Zimmers, R. P. S. M. Lobo, N. Bontemps, and C. C. Homes, Phys. Rev. B 72, 224517 (2005)
- (41) A. S. Barker, B. I. Halperin, and T. M. Rice, Phys. Rev. Lett. 20, 384 (1968)
- (42) D. N. Basov, E. J. Singley, and S. V. Dordevic, Phys. Rev. B 65, 054516 (2002)
- (43) U. Fano, Phys. Rev. 124, 1866 (1961)
- (44) A. Damascelli, K. Schulte, D. van der Marel and A. A. Menovsky, Phys. Rev. B 55, R4863 (1997)
- (45) K. Y. Choi, D. Wulferding, P. Lemmens, N. Ni, S. L. Bud’ko, and P. C. Canfield, Phys. Rev. B 78, 212503 (2008); G. L. Sun, D. L. Sun, M. Konuma, P. Popovich, A. Boris, J. B. Peng, K.-Y. Choi, P. Lemmens, and C. T. Lin, arXiv:0901.2728 (2009)
- (46) T. Yildirim, Phys. Rev. Lett. 102, 037003 (2009)